

JProfiler Makes Heap Dumps Useful to AI Agents
JProfiler 16.3 makes all major JProfiler subsystems available to AI agents through its MCP server. One of the most useful additions is heap dump analysis. Agents can now inspect the objects in a heap, follow their references and find out why they were not garbage collected.
Without runtime data, an AI agent cannot see which objects are alive or what keeps them reachable. JProfiler closes that gap, so the agent can start with actual evidence and use it to find the relevant source code.
A Real Support Case
Shortly after the 16.3 release, we got a support ticket for our other product, install4j, reporting a memory leak during update checks. The customer attached an HPROF heap dump that was written when the JVM ran out of memory. We asked an agent to investigate the problem and fix it if possible. The agent had several MCP servers at its disposal, including the new JProfiler MCP server.
The application was a background process that performed repeated update checks by invoking install4j update downloaders in process. Its maximum heap size was 64 MB. Eventually, the repeated update checks exhausted the available memory and caused the application to fail.
As is so often the case, the fix was small but hard to find. This investigation was a textbook example of using runtime data to guide source inspection. The story can be told in five steps:
The Technical Details
The agent only needed three MCP tools: load_snapshot, check_status and query. The first two
load a snapshot and report the available datasets. The query tool provides a low-code mode for working with profiling data.
Each dataset is represented as JSON. The agent supplies an expression in
jq, a query language for JSON, to select the data it needs and transform it into a
compact result. Filtering, sorting and projection happen in JProfiler, so only this result is returned to the agent.
Loading the Heap Dump
load_snapshot accepts JProfiler snapshots, HPROF heap dumps and JFR recordings. Snapshot loading is asynchronous.
The agent calls check_status to find out when the data is ready and which datasets and operations are available.
HPROF heap dumps are especially useful because they require no profiling agent while the application is running. You can trigger
them from a running HotSpot JVM with jcmd, or write them automatically on an OutOfMemoryError by adding
the -XX:+HeapDumpOnOutOfMemoryError VM argument to your application's command line.
For this HPROF file, the catalog contained the heap datasets for class histograms, biggest objects, instances, sizes and inspections. The dump contained 1,385,451 objects with a total size of 63 MiB. A plain HPROF file contains no allocation stack traces or performance recordings, so the analysis had to start from the object graph captured in the dump.
Finding Repeated Installer Runs
The agent started with the heap.classes dataset, filtered to the com.install4j package. The initial results
and a subsequent whole-heap query showed a surprising accumulation of installer UI and configuration objects:
| Class | Instances |
|---|---|
InstallerWizardScreenExecutor |
34 |
InstallerContextImpl |
34 |
DeferredDocumentImpl |
34 |
FormPanel |
198 |
ActionBeanConfig |
2,686 |
The matching counts showed that these objects came from repeated installer runs. Each in-process launch creates an executor, an installer context and a parsed configuration document. Only objects from the current launch should have remained. Instead, 34 complete installer runs were still retained.
The heap.biggestObjects dataset provided another hint: many installer contexts had a retained size of exactly
74,800 bytes. Such identical retained sizes often indicate repeated copies of the same object graph. In addition, each of the 34 parsed
XML documents retained 700 to 750 KB.
Following the Path to the GC Root
Finding suspicious objects is only the first step. The next question is why they are still reachable. The agent selected an
InstallerContextImpl instance with heap.instances and invoked the pathToRoot builtin in its
jq expression:
query({
  dataset: "heap.instances",
  class: "com.install4j.runtime.installer.InstallerContextImpl",
  expression: `
    .instances[0]
    | {
        id,
        keptAliveBy:
          pathToRoot(.id).paths[0].path
          | map({class, via, root})
      }
  `
})
The returned path contained the entire leak chain:
LookAndFeelChangeUtil.lookAndFeelChangeHandlers (static)
  → WeakHashMap entry value
  → look-and-feel handler registration
  → captured lambda
  → WidgetStyleHandlerImpl
  → FormEnvironmentImpl
  → FormPanel
  → InstallerContextImpl
A static field in LookAndFeelChangeUtil held the map. Its values were handler registrations whose lambdas referenced the
form environment and the installer context. The generated lambda fields named arg$1 were especially useful because they
identified captured variables. At this point, the heap evidence had identified the exact source construct to inspect.
Why the WeakHashMap Did Not Prevent the Leak
Paths from other parsed documents and from the top-level executor led to the same static map. In addition,
referrersByClass aggregated the incoming references by class. This confirmed that the look-and-feel registrations were
the common retainer for all of these objects.
An entry in a WeakHashMap is only removed when its key is no longer strongly reachable. In this object graph,
the value of each entry indirectly referenced its own key:
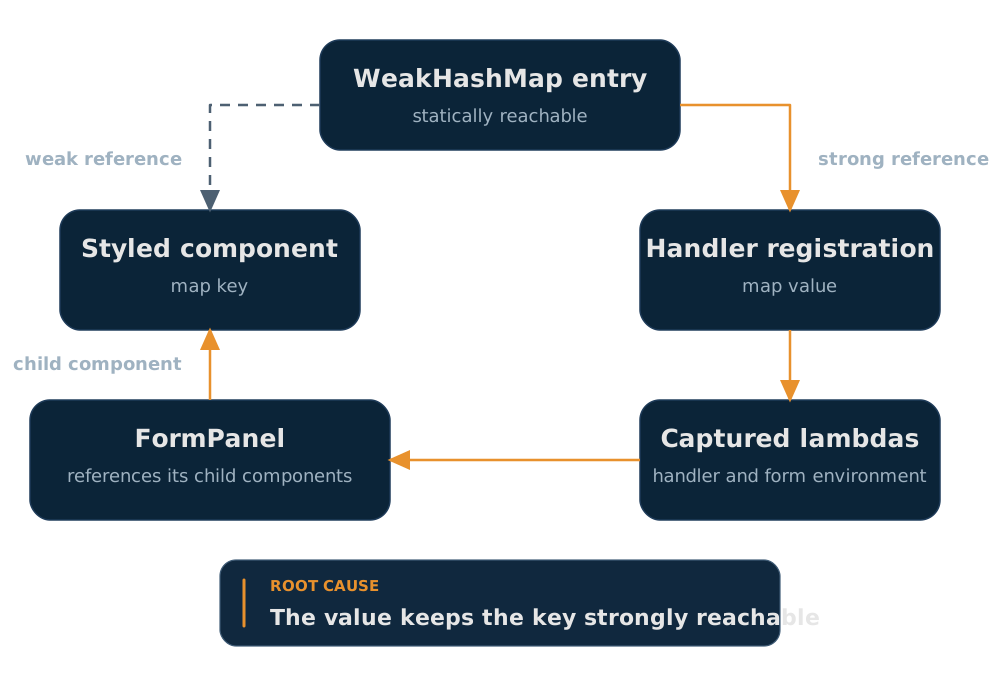
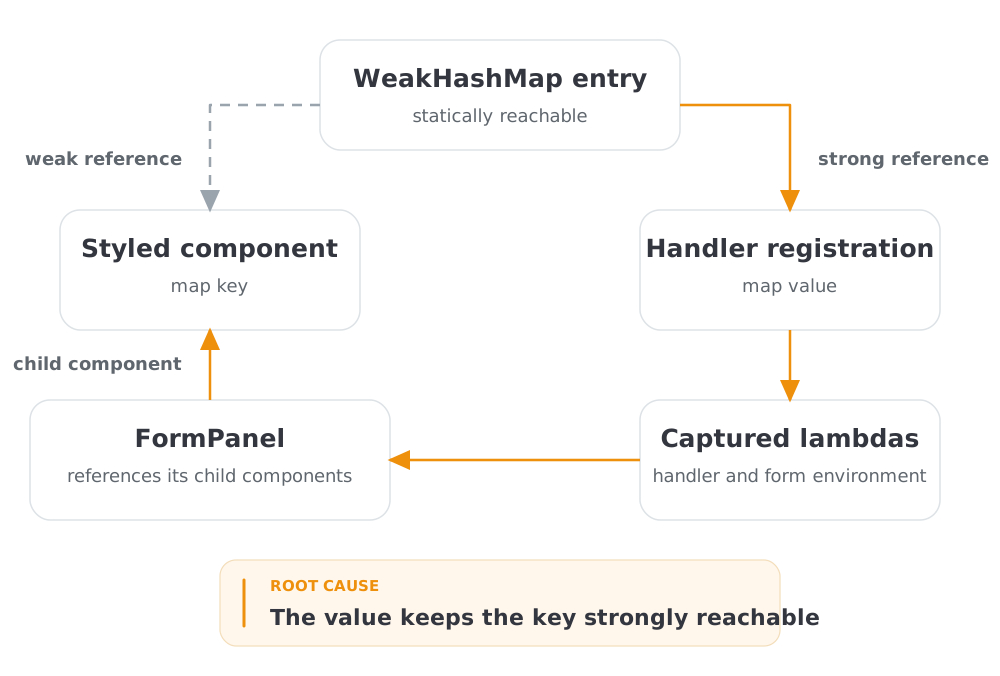
The map key was the styled Swing component, and the map value was the handler registration. The captured lambdas in the registration retained the form panel, which in turn retained its child components, including the map key. Because the map was held by a static field, this strong reference path from the map value back to the map key prevented all entries from being removed.
The source code showed the capturing pattern in WidgetStyleHandlerImpl: the styling lambdas called instance methods such
as addStyleColor, which captured the handler instance and its form environment.
Fixing the Leak
The style helper methods were made static, so the styling lambdas no longer captured the handler. Without that strong
reference to the handler, the registrations no longer retained the form panel or the map key.
The agent added a regression test that uses a WeakReference to verify that a look-and-feel registration does not retain
the handler. The test failed against the original code and passed with the fix. The full test suite passed as well, concluding the fix.
Could the Agent Have Found the Leak from the Source Code Alone?
AI agents are very good at reading source code and recognizing anomalies that can cause performance problems or resource leaks. However, this approach breaks down when a codebase is larger than the agent's context window. The agent then needs tools that can inspect runtime data.
In this case, the update check was the suspected cause. Reading the source code of the update check would not have revealed the actual leak. The leak was in widget styling that was initialized by each in-process launch. The agent used the retained objects and their reference chains to locate the relevant source code.
This is the main benefit of giving an AI agent access to a profiler. The profiler provides evidence from the application, so the agent can focus its source analysis on the code that actually caused the problem.
Getting Started
Heap dump analysis for AI agents is available in JProfiler 16.3. To give your agent this capability, go to the JProfiler agents page and execute one line in your terminal.