

Why Is Apache Fory So Fast? Profiling 5 Java Serialization Frameworks
It's no secret that the JDK architects seriously dislike Java serialization. It's a security nightmare, considerably complicates every new language feature, and on top of that it's very slow. That's why other serialization frameworks exist. There is a new kid on the block that claims impressive performance: Apache Fory. In this blog post we're going to check out if it lives up to its former name (which used to be "Fury") and compare it to the incumbents.
For the comparison, I profiled serialization and deserialization round trips of a realistic object graph with five different frameworks:
- Java serialization
- Kryo
- Apache Fory
- Jackson with both JSON and CBOR backends
The profiling data explains why Apache Fory is in the lead and that most of what Java serialization does is not serialization.
Setup & Numbers
The test dataset consists of 200 orders with customers, addresses, order lines, products, and categories. The serialized classes contain
a lot of different features that are relevant for serialization: shared references, collections, maps, enums, BigDecimal,
Date, long strings and byte arrays. Each test performs two million serialize and deserialize round trips after
a warmup phase, and an equals comparison verifies that every framework round-trips the data
correctly. The complete project is available on GitHub.
The tests were run on JDK 25 with 2 million round trips. The JVM was profiled with the JProfiler Gradle plugin in offline mode, with CPU
sampling or allocation recording, producing one snapshot per framework. For Java serialization, the java.* classes were
profiled explicitly, because by default these classes are filtered out by JProfiler.
| Framework | Time per round trip | Payload size | Total allocated |
|---|---|---|---|
| Fory 1.6 | 3.5 µs | 7,502 bytes | 4.5 GB |
| Kryo 5.6 | 8.9 µs | 7,257 bytes | 4.2 GB |
| Jackson CBOR | 12.0 µs | 7,819 bytes | 6.5 GB |
| Jackson JSON | 28.7 µs | 9,814 bytes | 8.8 GB |
| java.io | 46.8 µs | 9,152 bytes | 18.4 GB |
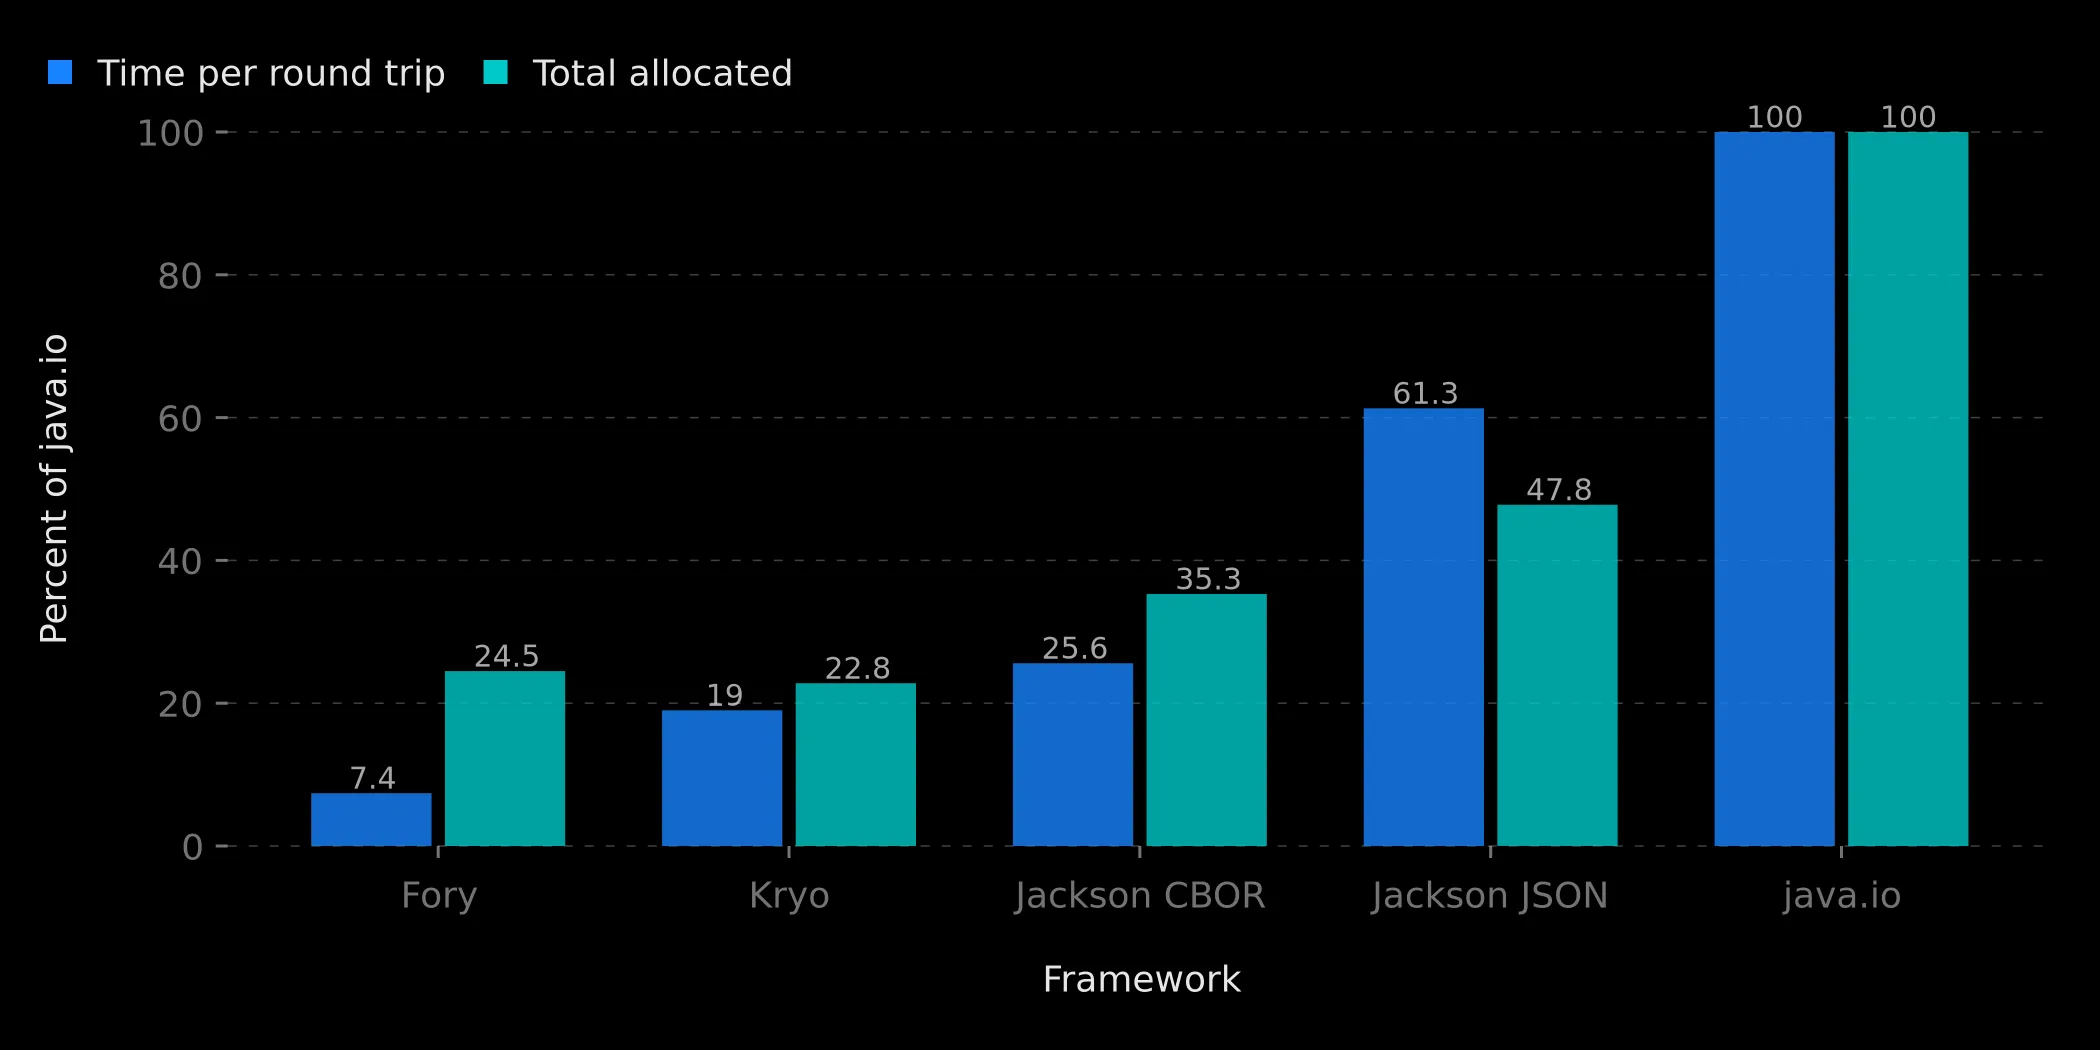
Java serialization is 13 times slower than Fory and allocates 4 times as much memory. This is consistent with published benchmarks. The chart also shows that the two columns are correlated: Kryo's round-trip times are nearly proportional to its allocations. Jackson JSON is slower than the allocation ratio suggests because it parses a lot of text which uses more CPU. Fory beats the correlation by a wide margin, at 7% of the time but 25% of the allocations. I will come back to that below. First, let us look at where the time actually goes.
Why Java Serialization Is Slow
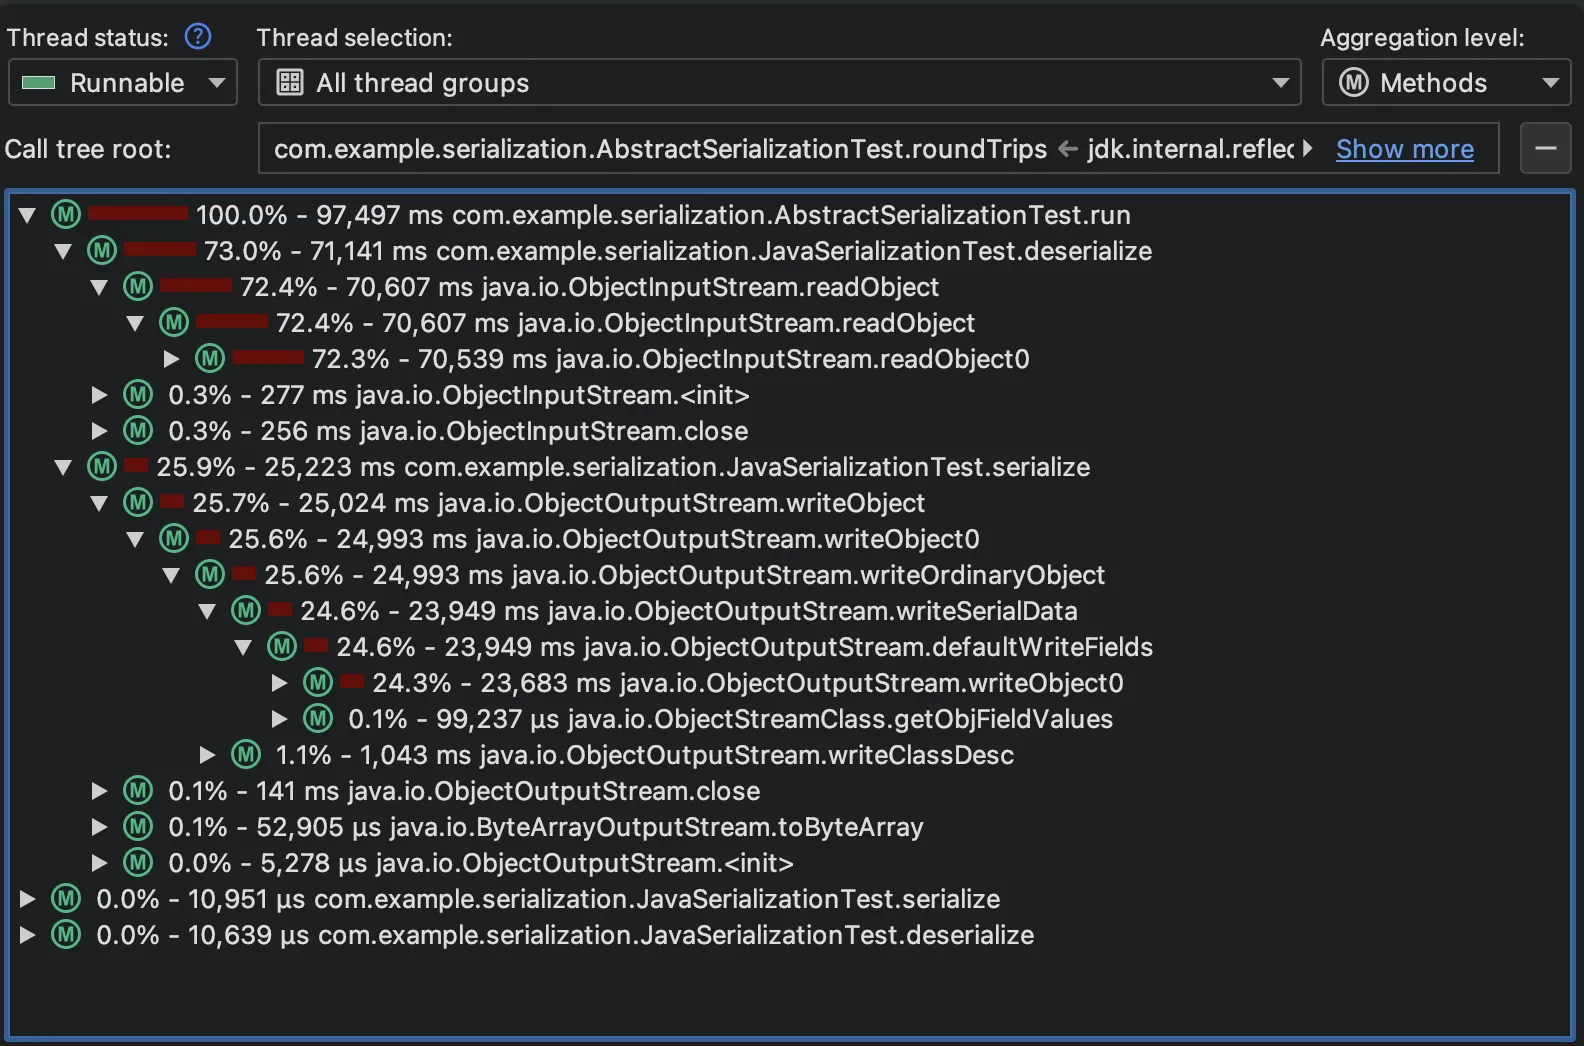
Interestingly, Java serialization is very asymmetric between reading and writing: 73% of the CPU time is spent in deserialize and
only 26% in serialize.
The main hot spots of the run show what the time is spent on:
-
jdk.internal.misc.VM.latestUserDefinedLoader0(18%): for every class descriptor in the stream, the JDK walks the call stack in native code to find the class loader that should resolve the class. -
Class.forName0(8%) andString.intern(6%): resolving those classes and interning the field names from the stream's type descriptors. Together with the class loader detection, nearly a third of the entire run is spent on answering the question "which class is this, and what fields does it have". -
ObjectInputStream$PeekInputStream.readFully(13%): moving bytes around. -
ObjectOutputStream$HandleTable.lookup(5%): tracking shared references. -
BlockDataInputStream.readUTFSpanandreadUTFBody(8% combined): parsing the many small UTF strings of the stream format.
The allocation data shows the same picture from the memory side. During the two million round trips, the Java serialization run allocated:
-
8 million
ObjectStreamClassinstances (844 MB). Class descriptors are cached by the JDK with soft references, so the garbage collector apparently evicted a lot of entries under allocation pressure. -
10 million
ObjectStreamFieldand 10.6 millionFieldValuesinstances for metadata and field storage. -
26 million
StringBuilderinstances, mostly from descriptor parsing.
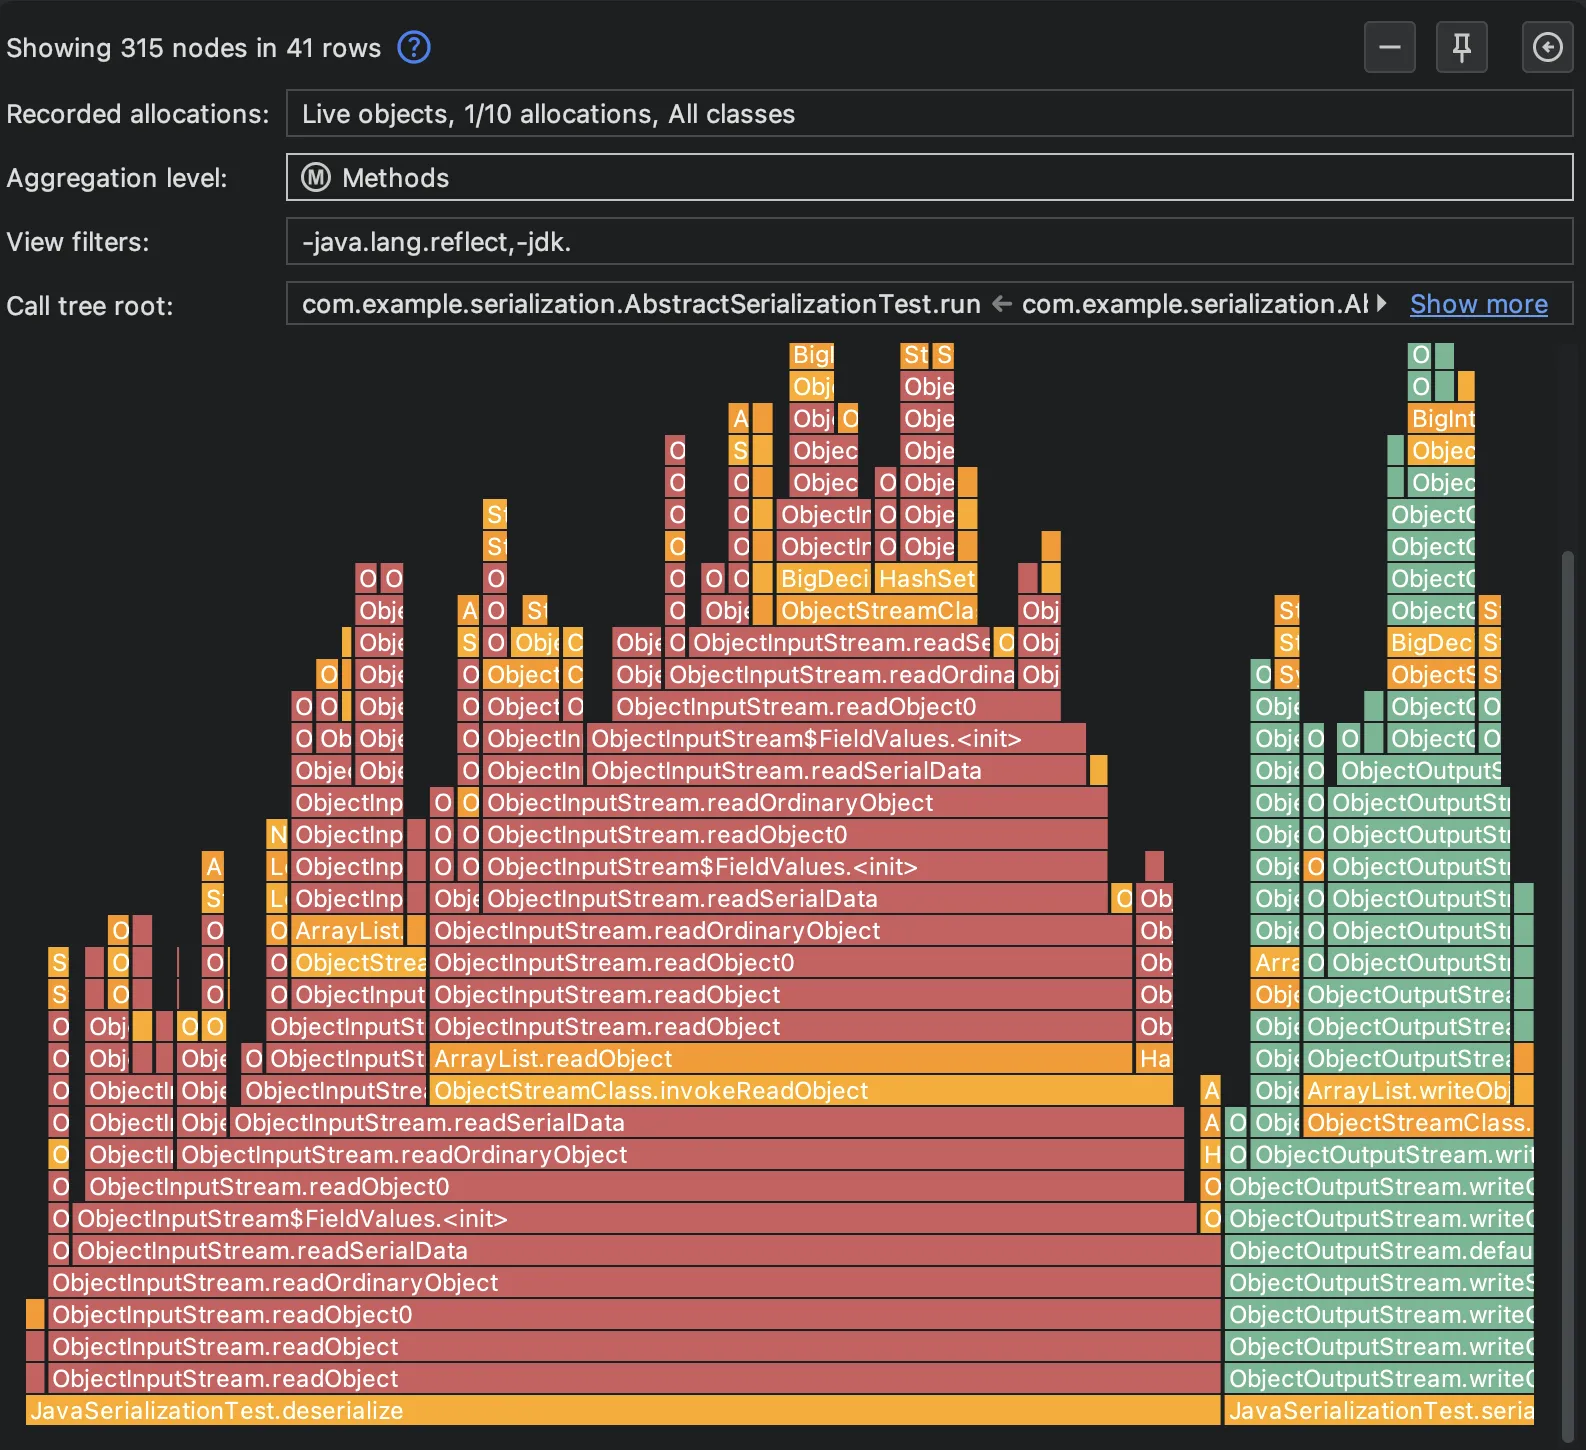
Most of this work is not related to the data being serialized. It is just the bookkeeping of the
format itself: type descriptors, field metadata, and the identity tables that track object references. Creating a fresh
ObjectInputStream for each round trip is the normal way to use the API, and it re-resolves class descriptors each time.
Why Fory and Kryo Are Fast
Fory and Kryo skip that bookkeeping entirely. There are no type descriptors to parse, no classes to resolve at read time, no reflection (at least in the hot path). What remains in the profiling data is mostly the work of actually building the result.
In the Fory snapshot, over a third of the time is spent directly in the serializer classes that Fory generates at
runtime, visible as methods like ProductForyRefCodecCompatible4_0.readFields$. Another 14% goes to
HashMap.putVal while rebuilding the attribute maps of the deserialized orders, and 6% to setting fields
through VarHandles. The profiling data shows that Fory is essentially mostly moving bytes into objects.
Kryo profiling data looks different. It spends 27% in the readObject and
writeObjectOrNull methods, 23% reading and writing strings, 12% in the identity maps that track
references, 7% in FieldSerializer, and 5% writing class names.
Kryo is fast because it does not manage descriptors like Java serialization, but it still has its own layer of per-object and
per-field dispatch.
Why Fory is so Fast
What is really interesting is that Kryo allocates the least of all frameworks, yet it is 2.5 times slower than Fory. Of course, allocations just count bytes, but they do not count the instructions spent per byte.
Kryo serializes with what amounts to an interpreter loop. For every object it looks up the serializer, for every field
it dispatches through FieldSerializer and for every class name it writes a string to the stream. None of these
dispatch methods is a bottleneck on its own, but together they add up to over 40% of the run between the data and the
bytes.
The generated codecs in Fory have no such layer. The classes that Fory compiles at runtime are just a fixed sequence
of reads and writes. Buffer access goes through bulk memory operations instead of per-byte reads, and field access through VarHandles.
The hot spots view shows this clearly: the top entry is HashMap.putVal from rebuilding the attribute maps, and the ranks
below it are dominated by the generated ForyRefCodec classes.
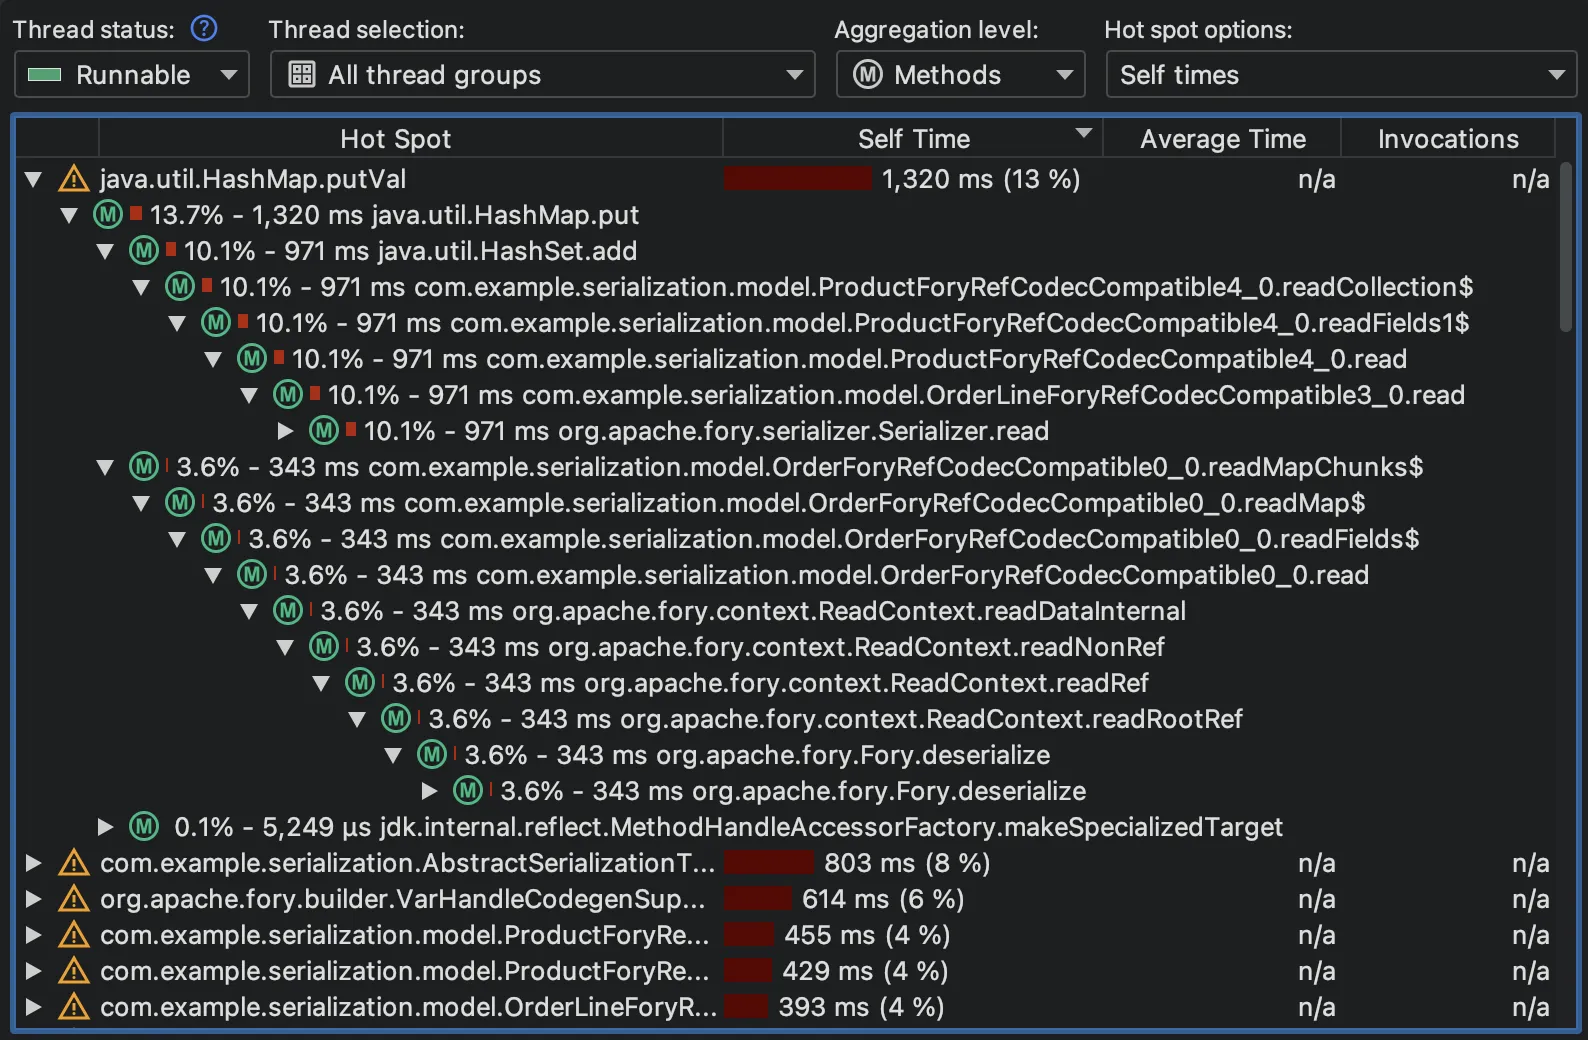
So the main take-away here is that it is code generation that puts Fory in a league of its own.
Different Trade-Offs for Jackson
Jackson is the most widely used serialization framework, but its selling point is not speed alone. Jackson is the default go-to solution for converting classes to JSON and has a lot of features for this purpose.
A text format like JSON is an expensive feature. Encoding the byte[] thumbnails as base64 takes
24% of the total time and decoding them another 23%, so almost half of the run is spent on the fact that JSON has no
binary type. Reflective method invocation adds another 13%.
However, Jackson also has binary backends, and switching is quite simple, for example with a CBORMapper. In the example workload,
CBOR is 2.4 times faster than JSON and produces payloads that are nearly as compact as Fory. The profiling data confirms
that the format is no longer the problem: the CBOR parser and generator together account for about a quarter of the
time, while the reflection-based data binding layer now makes up about 40%. The fact that it still has a data binding layer
makes it about 3.4 times slower than Fory.
Choosing a Framework
- For pure speed, Fory wins this comparison by a wide margin. It also has implementations for many other languages and a type-compatible mode that tolerates schema changes, which makes it a good fit for polyglot systems and for data that is stored for a long time.
- Kryo is still a pragmatic choice for payloads like cache entries or RPC between trusted services. It is mature and has a minimal dependency footprint, but in our example workload it is 2.5 times slower than Fory.
- For anything that humans or other tools need to read, Jackson with JSON is the pragmatic default. If you control both ends of a communication pipeline, you can switch to the CBOR backend with a one-line change.
- Java serialization is only for compatibility with existing systems.
How This Was Profiled
Everything in this post was produced from the command line. The snapshots were recorded by the JProfiler Gradle plugin in offline mode, with one task per framework:
tasks.create<com.jprofiler.gradle.TestProfile>("profileFory") {
    useJUnitPlatform()
    filter { includeTestsMatching("com.example.serialization.ForySerializationTest") }
    offline = true
    callTreeMode = CallTreeMode.SAMPLING
    profile = listOf("com.", "org.", "java.", "javax.", "jdk.", "sun.")
    recording = listOf("cpu") // or listOf("allocation")
    snapshotFile = file("build/snapshots-cpu/fory.jps")
}
One important note: It is not a good idea to measure CPU and allocation data at the same time. Allocation recording samples every tenth object, so the absolute allocation values are understated by that factor, while the ratios between frameworks are unaffected. However, even with this sampling ratio, allocation recolrding is still expensive and distorts measured CPU times.
The analysis itself was performed by a coding agent that drove the JProfiler MCP server.
Try It Yourself
The full project is on GitHub.
To look at the snapshots yourself, download JProfiler and open the .jps files
from build/snapshots-cpu and build/snapshots-allocation.