

JProfiler 16.2: Profiling From the Command Line
JProfiler 16.2 makes offline profiling a lot more convenient. "Offline profiling" is the mode where you profile without the JProfiler GUI. It is useful for CI servers, containers and production systems. In previous JProfiler versions, profiling settings had to be communicated to the agent on the command line with a config file that was exported from the JProfiler GUI. Recording commands then needed to be executed via the Controller API, the JProfiler MBean or the "jpcontroller" command line utility.
For many cases, this workflow is needlessly complicated. We now introduce a pragmatic approach, where the
most common profiling settings and a simple automated recording sequence can be set directly on the command line:
in the -agentpath VM parameter, in the jpenable attach tool, and in the Gradle and Ant
profiling tasks. This is not only a great simplification for automation tasks, it also hugely benefits the newest
inhabitants of the command line: the AI agents.
One VM Parameter
Until now, starting offline profiling looked like this:
-agentpath:...=offline,id=<ID>,config=/path/to/jprofiler_config.xml
The config file is an XML document written by the JProfiler GUI. You have to export it on your machine, copy it to the target machine, and keep it in sync when you change settings. In a container image, that file also needs to be mounted.
With a plan like "record CPU for ten minutes, then save a snapshot", you either have to configure a trigger in the
GUI, use the controller API programmatically, or manually perform the recording with the jpcontroller command
line utility. While this way of offline profiling will continue to be supported, it is now only needed for advanced profiling settings
and triggers.
In 16.2, the above profiling plan can be configured directly in the VM parameter:
-agentpath:...=offline,callTreeMode=sampling,profile=com.mycorp.,\
   snapshot=/tmp/snapshot.jps,recording=cpu,duration=10m
This starts the JVM with sampling, restricts profiling to your own packages, records CPU data for ten minutes, and then saves a snapshot.
The available profiling settings parameters are
-
call tree mode (
sampling,instrumentationorasync) -
the
profile,compactandignorepackage filters -
the
lineNumbersoption
The automated recording options are
-
recordingacceptscpu,allocationand probe names such asjdbcorhttp_server -
durationwhich takes values like30s,10mor1h. If you leave out this parameter, recording runs until the JVM exits, and the snapshot is saved at shutdown. -
delaywith the same time value format so you can let the application warm up first
This greatly improves how profiling can be done in deployments. A container image no longer needs an additional config file and
the profiling settings are simply part of the startup command, or contained in JAVA_OPTS or a similar environment variable.
To change what gets recorded you now simply edit a deployment descriptor instead of syncing a config file.
Attaching to a Running JVM
The new simplified offline profiling flow is not limited to the startup VM parameter, it also works when profiling already
running JVMs with the jpenable command line utility.
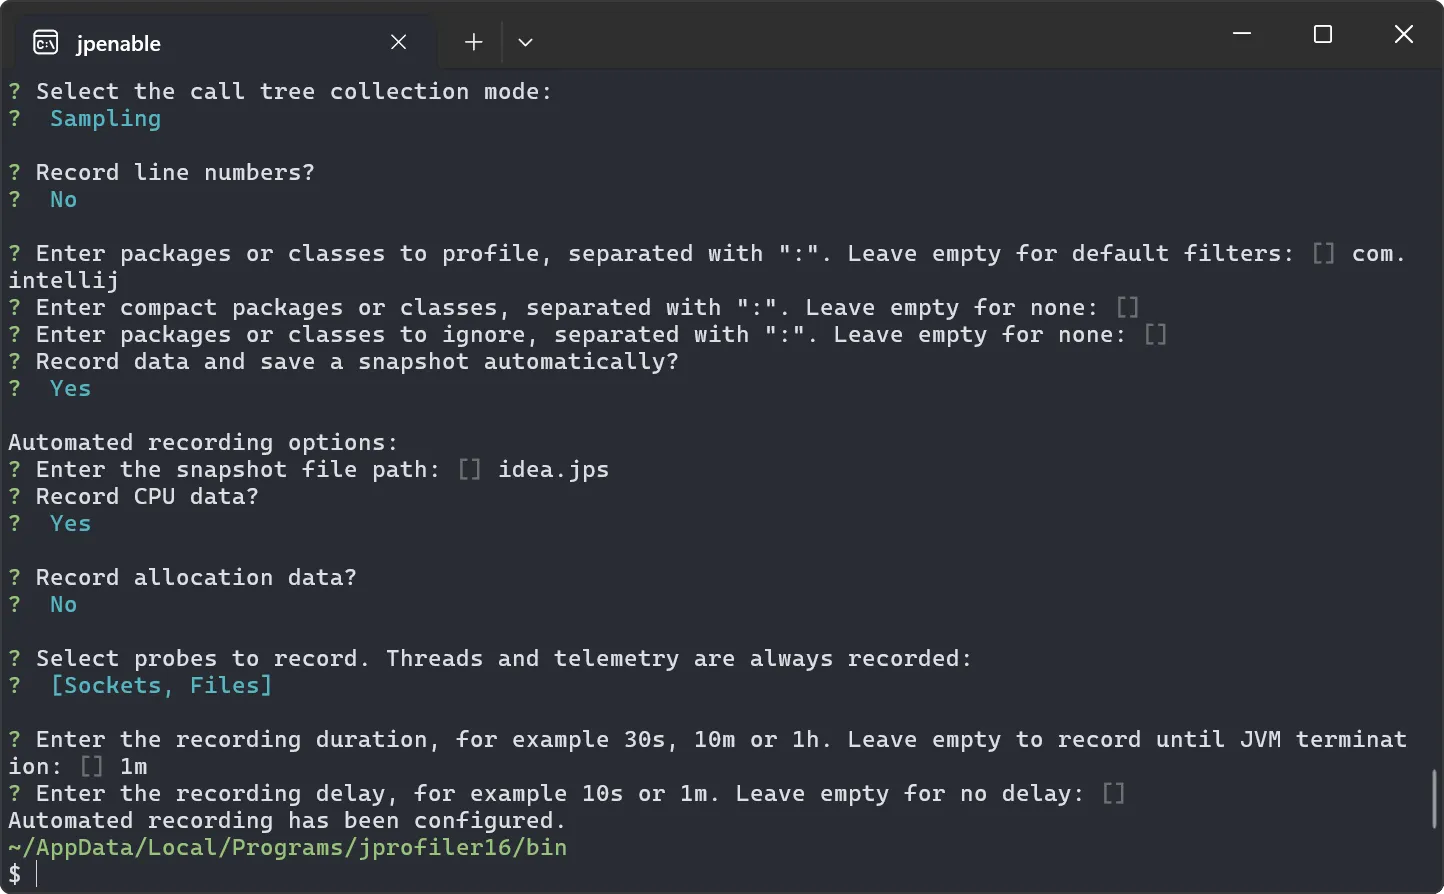
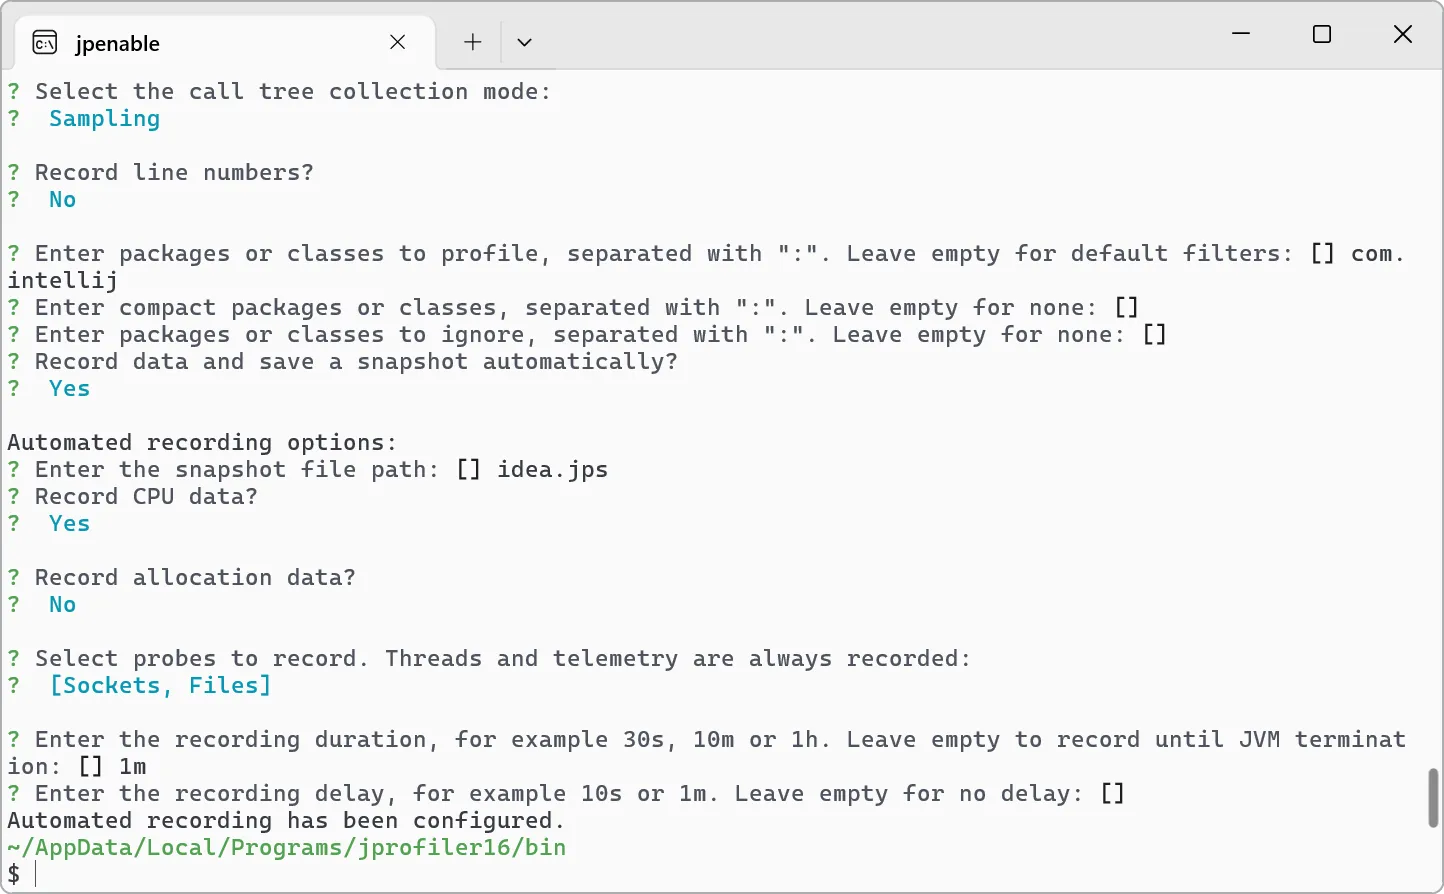
When you start it interactively, its rich console walks you through the offline profiling settings and the automated recording sequence:
For non-interactive use, all settings are available as command line options, for example:
jpenable --offline --call-tree-mode=sampling --profile=com.mycorp. \
   --snapshot=/tmp/snapshot.jps --recording=cpu:jdbc --duration=5m
Profiling in Build Systems
The Gradle and Ant profiling tasks expose the same capability through task attributes:
task run(type: com.jprofiler.gradle.JavaProfile) {
    mainClass = 'com.mycorp.MyMainClass'
    classpath sourceSets.main.runtimeClasspath
    offline = true
    callTreeMode = 'sampling'
    profile = ['com.mycorp.']
    snapshotFile = file('build/snapshots/run.jps')
    recording = ['cpu', 'allocation']
    duration = '10m'
}
This makes it easy for a CI job to create a profiling snapshot as a build artifact with a configuration that is contained directly in the build script.
AI Agents
AI coding agents work on the command line. They run builds, execute tests and read log output, but they cannot click through a wizard or export a config file from a GUI. Starting with 16.2, agents can perform the entire profiling session on the command line with a single command: they add a VM parameter to a test invocation, letting the JVM save a snapshot when it finishes and then analyze the result.
Combined with the JProfiler
MCP server from 16.1, which loads the snapshot and guides the agent from hotspots to root causes, the entire
loop of measuring, fixing and verifying now runs without anyone opening the JProfiler UI. A human can still look at the
same snapshot in the GUI by opening the .jps snapshot file.
Getting Started
JProfiler 16.2 is available on the download page. The complete reference of the inline settings is in the offline profiling documentation.