

Introducing jvmguard: Automatic Production Profiling
There is a new open source tool from the team behind JProfiler: jvmguard helps your company to profile JVMs in production.
Profiling in production is risky, but often it is the only way to understand a problem. With jvmguard, profiling captures are authorized and audited, and can be started by a human, by an automatic trigger, or by an AI agent.
jvmguard works with JProfiler, but it is not limited to that integration. It also records JFR snapshots, HPROF heap dumps, and thread dumps and you can analyze them with other tools. The basic idea in jvmguard is that lightweight signals are always on, while deep captures only happen under certain conditions.
The Problem with Profiling in Production
When something is slow in production, the data you need is on the machine where the problem happens.
In most organizations, developers do not have SSH access to production hosts, so even a simple
heap dump with jcmd is not something a developer can do by themselves. Attaching a full profiler is usually not an
option at all, because it loads a native profiling agent that could add uncontrolled overhead.
APM tools and continuous profilers do not help with this problem. They record broad monitoring data: dashboards, traces, and alerts for all JVMs. However, they cannot record profiling snapshots for deep analysis.
Lightweight Signals, Deep Captures
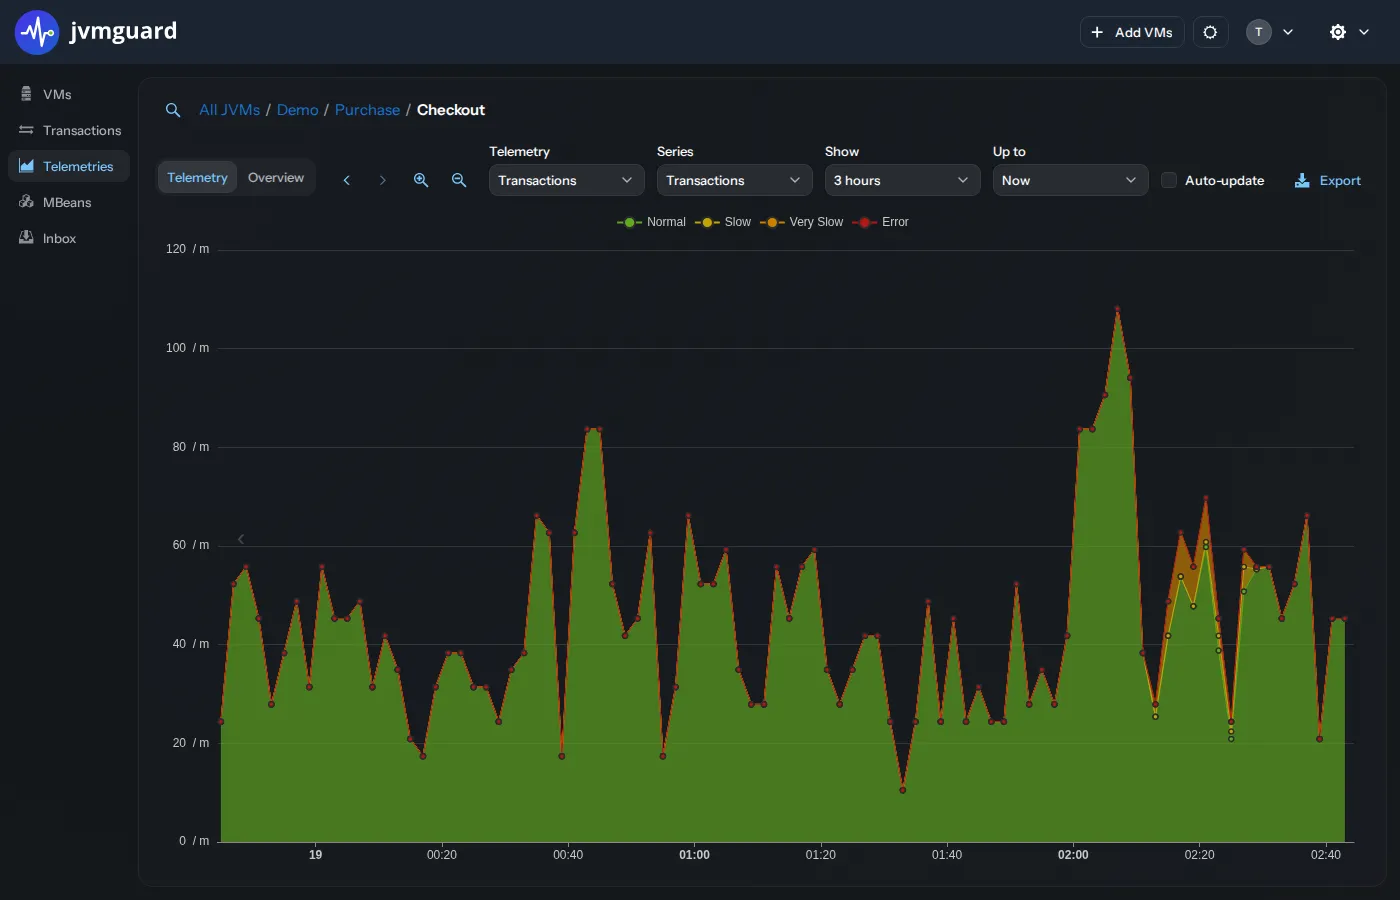
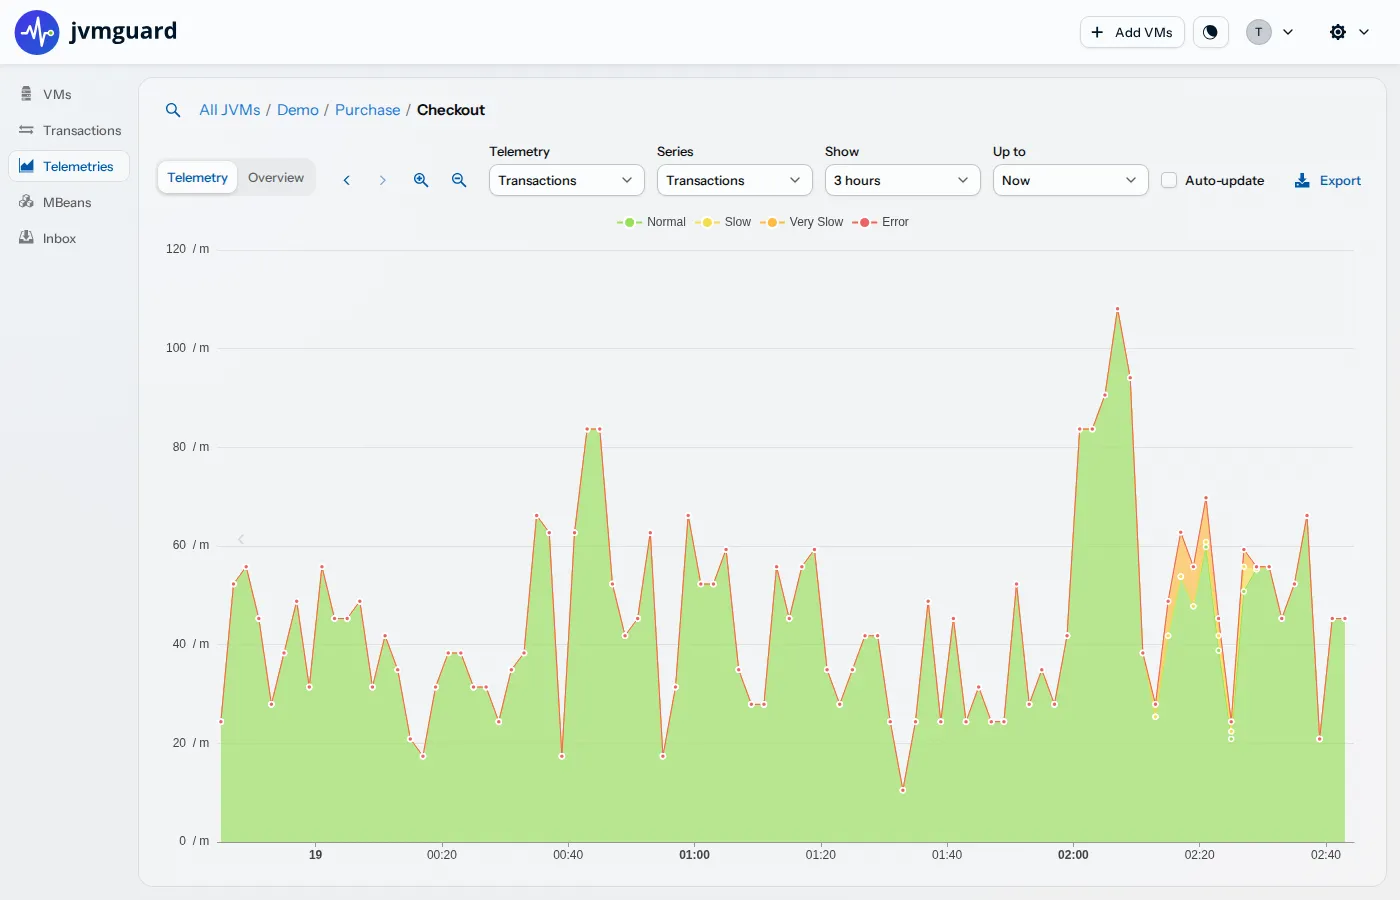
jvmguard consists of a server with a web UI and a Java agent that runs inside each monitored JVM. The agent is pure Java, works on Java 8 and later, and only instruments the methods that you have explicitly defined as transactions. During standard operations, it collects only lightweight data:
- built-in telemetries like heap, CPU, threads, and GC
- telemetries from selected MBeans or from your own annotated methods
- the transactions that you have configured
Deep captures are not recorded by default. There are four kinds, and they only run on demand:
- a JFR recording with a limited duration
- a heap dump in HPROF format
- a thread dump
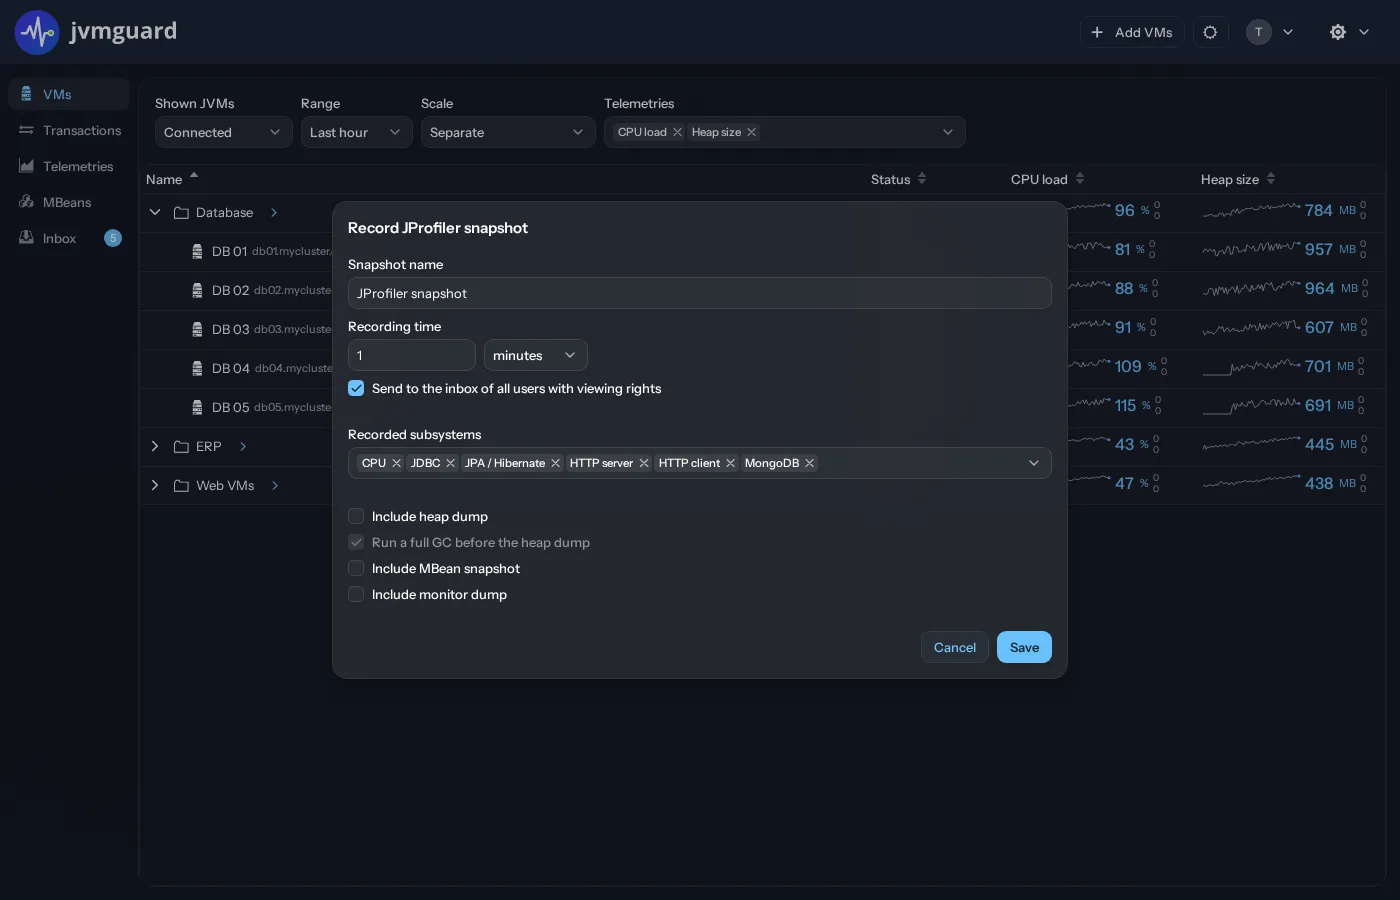
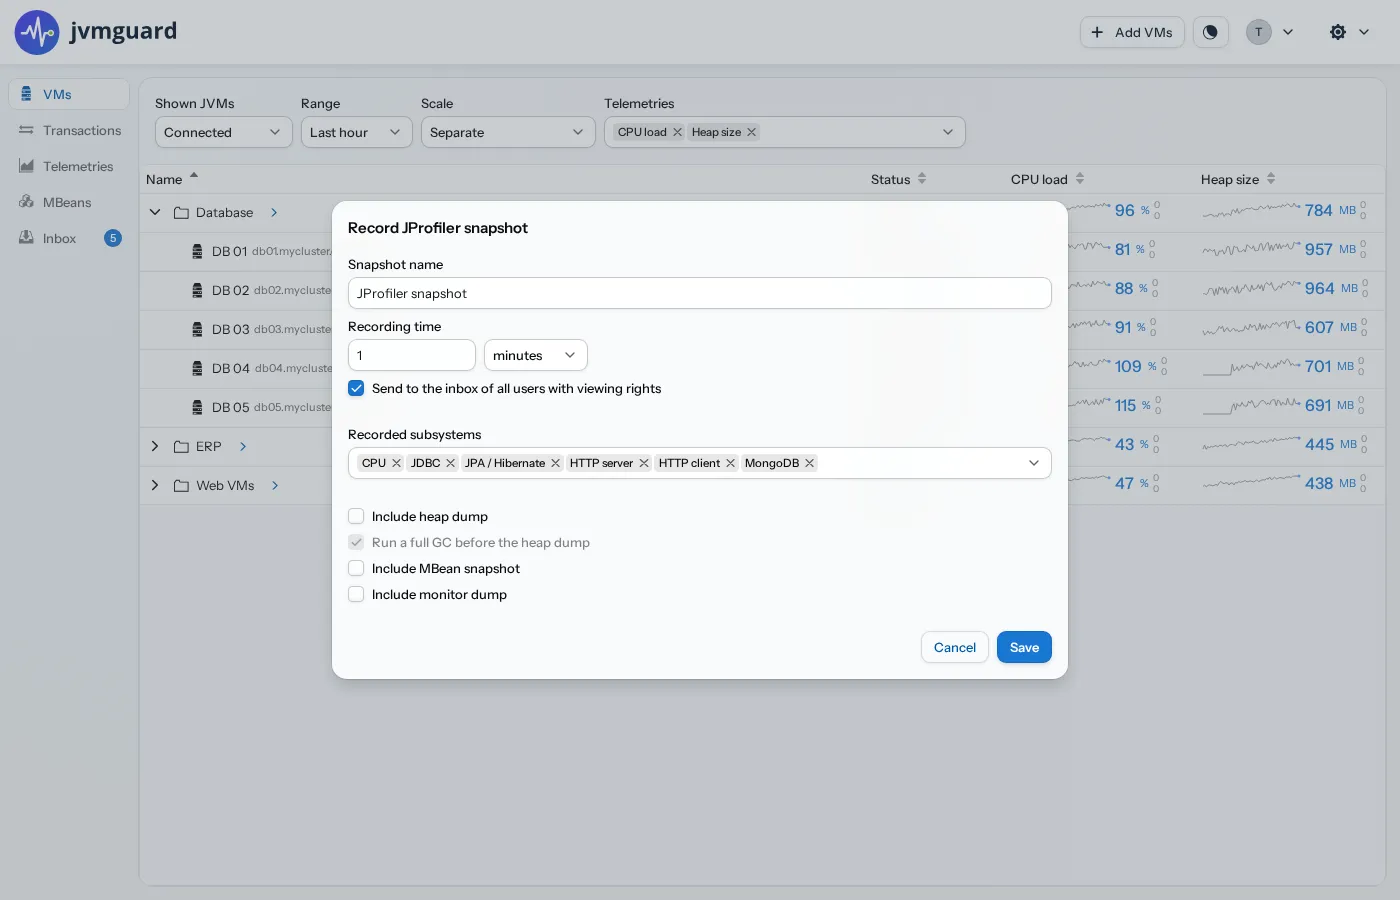
- a JProfiler snapshot
A capture can be started manually from the web UI for any connected JVM. The result is saved to the jvmguard inbox, where authorized users can download it.
Capturing Automatically with Triggers
Triggers are configured on VM groups and react to rates of events. There are three kinds of triggers:
- threshold triggers fire when a telemetry crosses its bound too often
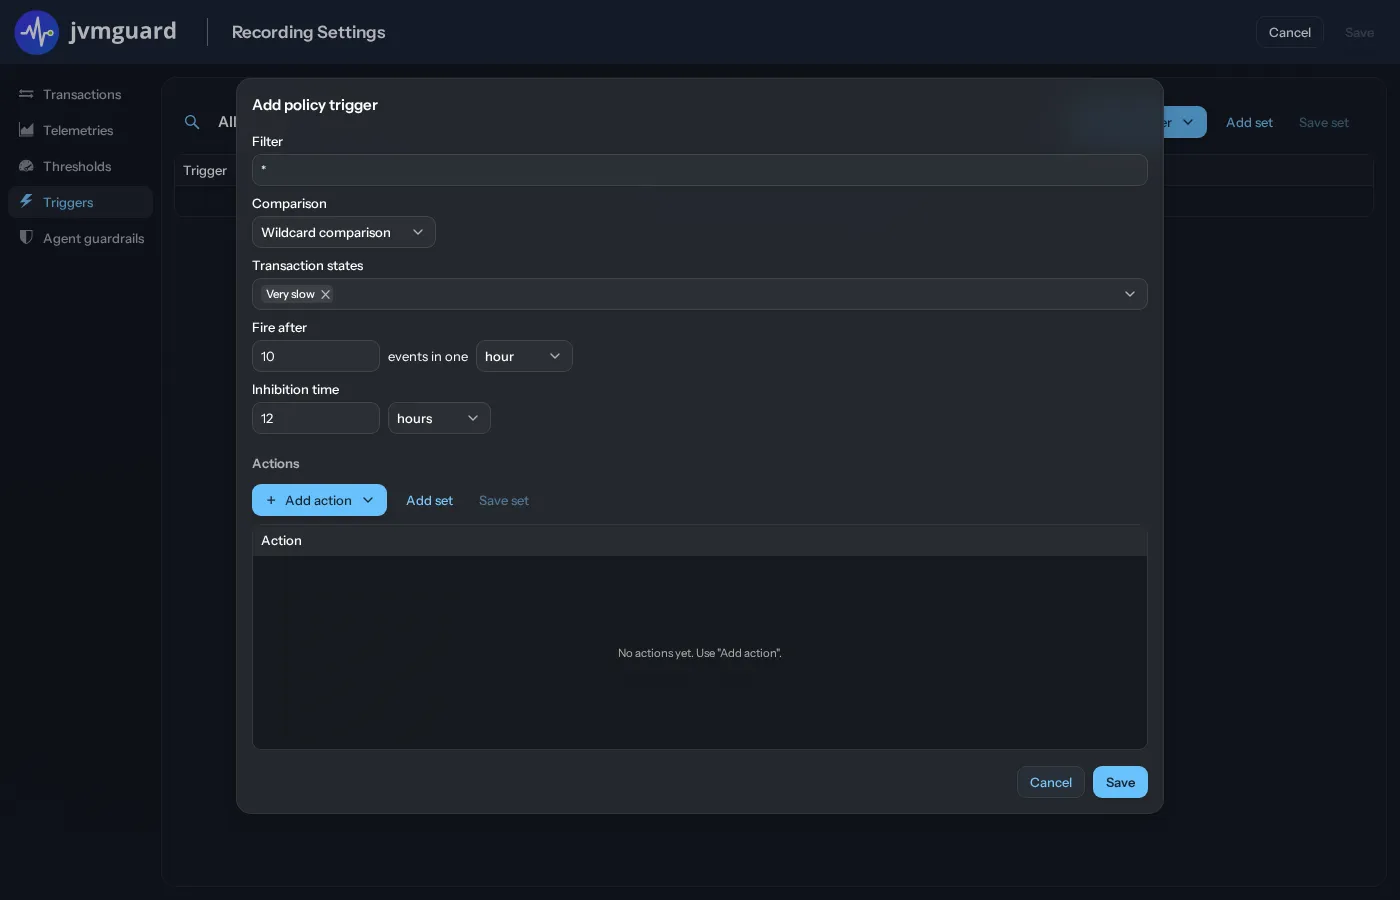
- policy triggers fire when too many transactions are slow, very slow, overdue, or end with an error
- connection triggers fire when the number of connected JVMs drops below a minimum
When a trigger fires, jvmguard runs a configurable list of actions. Data collection actions record a JFR or a JProfiler snapshot, or take a heap dump or a thread dump from the affected JVM. Notification actions write to the jvmguard inbox, send an email, or call a webhook.
A typical setup would be a policy trigger that fires when there are too many slow transactions, and records a JFR snapshot.
Integration with JProfiler
The deepest analysis comes from the JProfiler snapshot. For this, the server downloads the matching JProfiler agent package from our download site, and transfers it to the agent. This is the only connection that the server makes to the outside on its own initiative, and on an air-gapped server you can pre-copy the package into its cache directory yourself.
The JProfiler agent is loaded into the running JVM on demand and records CPU data with sampling, which keeps the overhead low for production. In the JProfiler recording action, you can select the subsystems that you need, for example JDBC, JPA, HTTP, gRPC, Kafka, or LLM invocations. Once the JVMTI agent is loaded, it cannot be unloaded until the JVM is restarted, but its idle overhead is below 1%.
AI Agents
jvmguard includes an MCP server. A coding agent can do the same things that a human can do in the web UI: discover the available JVMs, read telemetries and transactions, capture profiling snapshots, and retrieve the result.
Giving an AI agent access to production JVMs requires hard limits. jvmguard provides a server-wide read-only mode, per-group guardrails that control which capture types are allowed, rate limits and cooldowns, and a SIEM-compatible audit record of every agent operation.
The jvmguard MCP server and the JProfiler MCP server form a loop: jvmguard captures the snapshot in production, and the AI agent analyzes it with JProfiler.
Safe in Production
To make profiling safe in production, jvmguard provides a number of features:
- Controlled, ultra-low overhead during default operation.
- Three access levels, Admin, Profiler, and Viewer, partition one server for different teams. Users authenticate with local accounts, LDAP, or SSO, and two-factor authentication is on by default.
- Agent connections can be encrypted and mutually authenticated with TLS.
- A full audit log records every profiling action: who, when, and what.
- No phoning home. The agents connect to your server, and all recorded data stays inside your network. The collector, the embedded H2 database, and the web UI run in a single process that also works in air-gapped environments.
Getting Started
This is the first release of jvmguard. Installers for Windows, macOS, and Linux are available on the download page, the documentation is available on the website.
After the installation, use the "Add VMs" button in the header to generate the -javaagent option that you add to the startup command of
each JVM.
The source code is on GitHub. If jvmguard seems useful to you, a star on GitHub helps others find the project.