Introducing perfino
2014-06-03
Posted by Ingo Kegel
Today we're releasing a major new product: perfino
is a JVM monitoring tool for in-production use. Over the years, we have lost count of the number of times that our
customers have asked us on how to best deploy JProfiler in production. While our standard response was to recommend a
monitoring tool, our customers were not so easily dissuaded. They wanted the power of JProfiler to solve their
particular problems.
Out of this dilemma, the idea for perfino was born. Would it be possible to develop a monitoring tool that could be used
in production, yet provide a way to escalate from monitoring to profiling if necessary? We are firmly convinced that
perfino succeeds with respect to this original goal and provides you with a layered defence in depth. When a problem
becomes more difficult to solve with monitoring techniques, perfino offers low-risk, low-overhead native JVMTI sampling
to get a picture of the entire JVM. If even that is not enough, perfino offers an easy way to attach JProfiler to a
problematic JVM. At that point, you have the full arsenal of a Java profiler at your disposal.
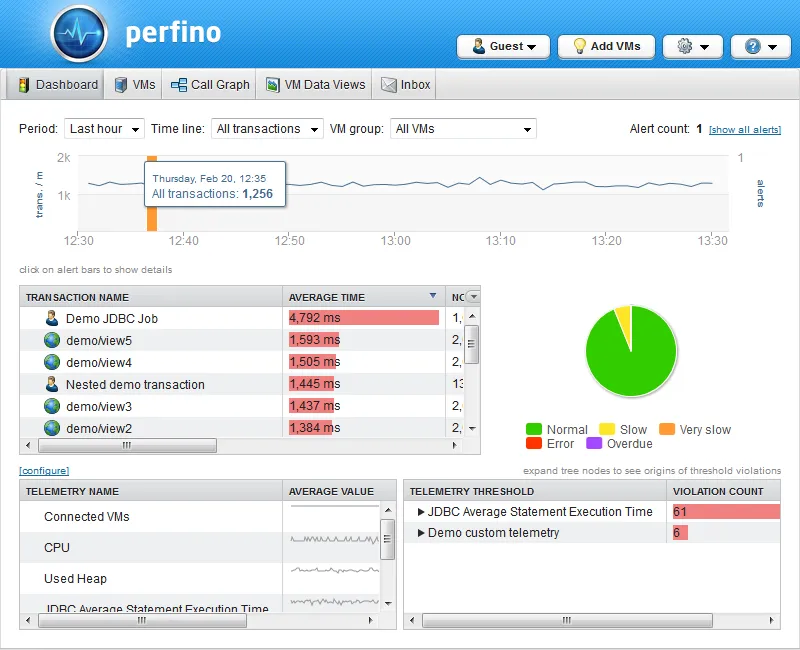
However, the much larger part of perfino is not its emergency handling, but its monitoring capabilities. Here, we wanted
to make a difference as well. perfino uses a Java agent with ultra-low overhead and measures what is called "business
transactions" in the APM space. Business transactions capture important method calls with specially constructed names
that help you to interpret what is going on in your application.
For business transactions, we brought in successful concepts from the profiling space and integrated them into perfino.
For example, transactions are shown in a call tree and you can see hot spots of transactions. With perfino, it is
possible to define many transactions that are nested. This gives you more informational depth and correspondingly more
insight than just the list of top-level business transactions that is common for APM tools.
The amount of useful information in an APM tool is directly related to the amount and quality of the recorded business
transactions. This is why we expended a lot of energy on the business transaction engine and the configuration of
business transactions in the perfino UI. Also, we wanted to make it really easy to define business transactions directly
in your code. The DevOps annotations offered by perfino are a great way to achieve this. Rather than thinking about
monitoring as external to the application, you just annotate methods of interest.
The features mentioned above rotate around measuring method calls. Of course, a monitoring tool needs to do a lot more
and we’ve strived to make perfino great in all these aspects: Telemetries, policies, triggers, alerts, end user
experience monitoring and lots more. Take a look at the feature list
or - even better - try it out in our live demo
or on your own machines. Tell us what you think and what you would like to see in future versions.
perfino is a powerful APM solution today, but our vision for perfino is not done yet. There are many more things to come
and we hope you’ll bear with us.
Archive
April/3
2025/20
How I Doubled jclasslib's Performance with JProfiler MCPThe Hotspot Claude Would Never Have Found by Reading the CodeJProfiler 16.1: AI Agents Can Now Profile Your Java Applications
March/2
Breaking the LLM Black Box: Custom Categorization in JProfilerProfiling AI: LangChain4j and Spring AI
February/1
October/1
August/1
July/2
2024/5
2023/7
The power of async tracking in JVM profilingWebsite refresh: Visual updates, dark mode, and semantic search for docs
June/4
All our artifacts are now published on Maven CentralJEP 493 follow-up: install4j 11.0.4 is ready for separate JMOD bundles in Eclipse Temurin 24.0.2JProfiler tips roundup May 2025JVM performance watch roundup May 2025
May/3
JProfiler tips roundup April 2025JVM performance watch roundup April 2025Heap Walker scripting for snapshot analysis
April/8
Capturing and comparing MBean states with JProfilerAdvanced SSH remote profiling with JProfilerProfiling Java applications in VS Code with JProfilerAdvanced Kafka probe configuration in JProfilerProfiling Kafka #1 – Message Flow & Hot SpotsBringing JProfiler to VS Code with Kotlin Multi-PlatformCaching auto-provisioned install4j distributions in CI pipelinesCross-platform JRE bundle creation under threat from JEP 493
January/1
September/5
2022/10
Garbage collector analysis in JProfilerRecording JFR snapshots with JProfilerEnhanced JFR snapshot analysis with JProfilerWorking with probe events in JProfilerCustomizing telemetries in JProfiler
March/1
January/1
December/2
November/3
2021/2
2020/1
2019/1
2018/3
2017/5
2016/1
2015/10
Using sunburst diagrams for understanding Java memory consumptionUsing flame graphs when profiling Java applicationsProfiling a Netty server
October/1
September/1
August/2
July/1
November/5
2014/3
2013/3
2012/5
2011/13
Analyzing specific parts of the call treeAnalyzing incoming and outgoing calls of a methodCollapsing recursions in the call treeRemote profiling through an SSH tunnelFinding JDBC connection leaks
June/5
December/1
October/2
September/5
2010/8
2009/14
Using the "Run interceptor script" trigger actionCreating a custom probeInspections in the heap walkerHeap walker graph: Finding paths between selected instancesFiltering in the reference view of the heap walker
August/4
Request trackingAnalyzing long-running AWT events with JProfilerProbes overviewCPU profiling: Sampling and instrumentation
February/1