The data perspective
The data perspective is divided into several tabs. The tabs are ordered from more general information on the left to more specific information on the right.
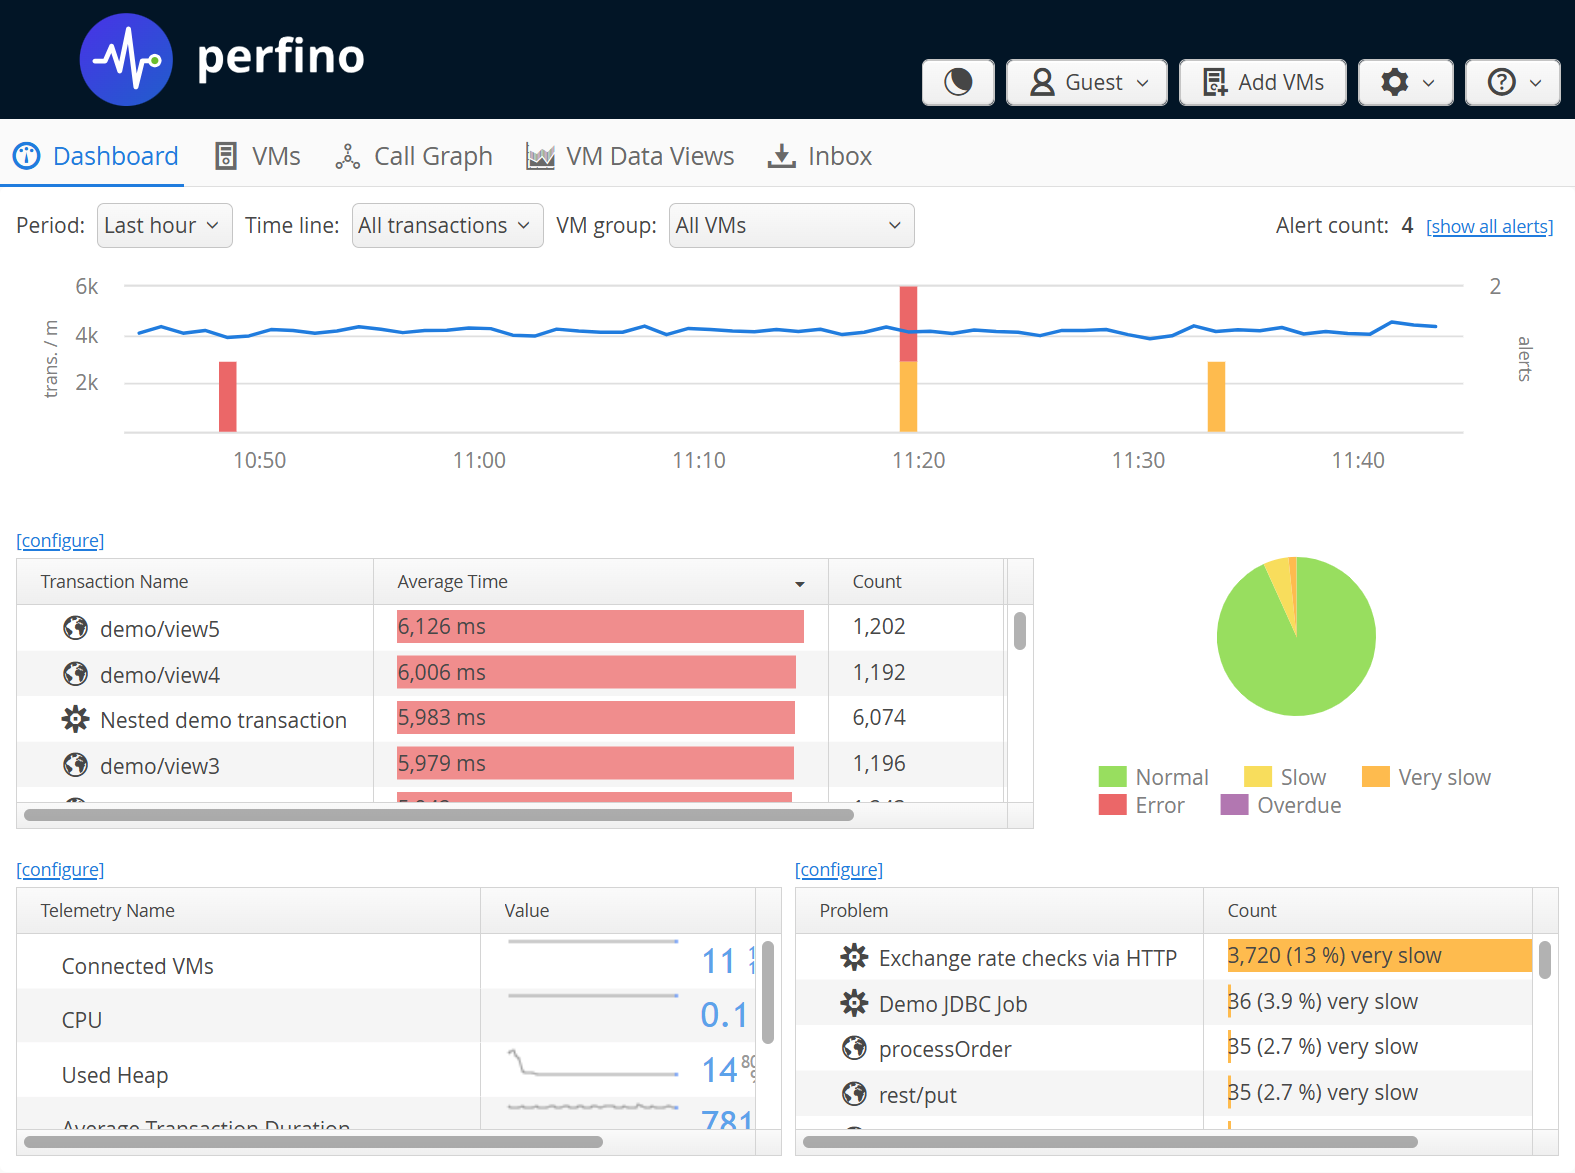
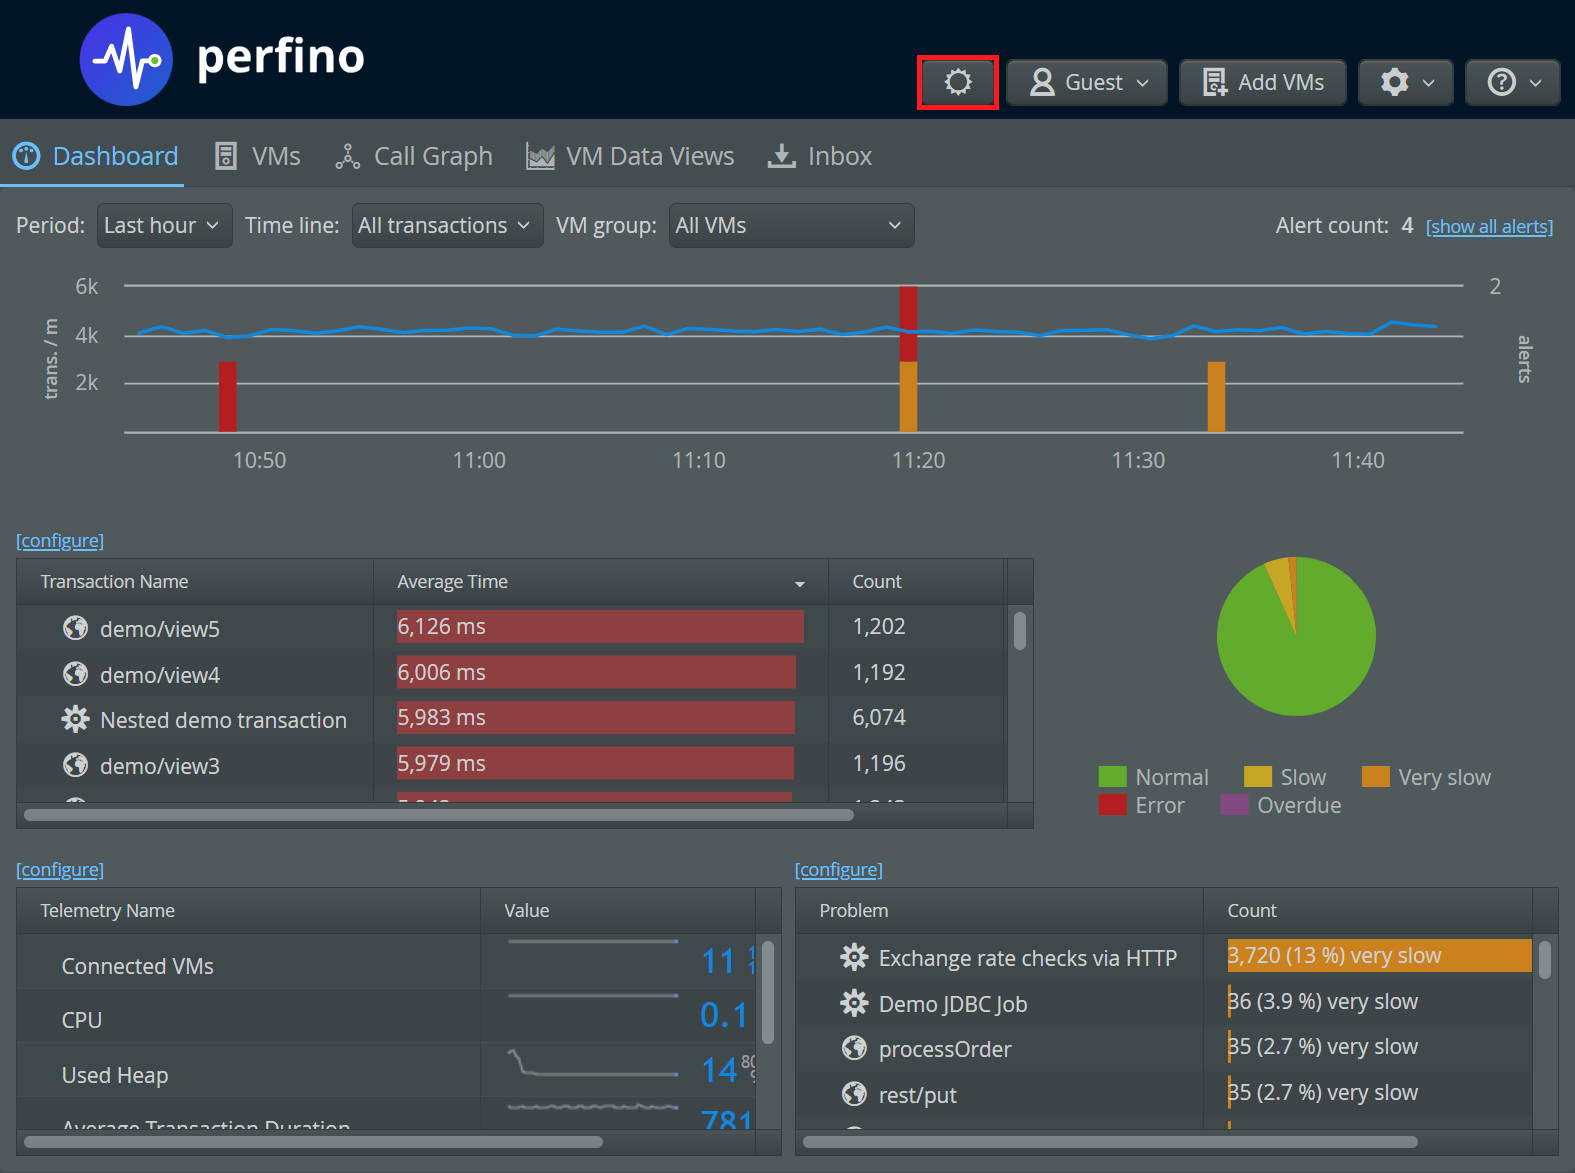
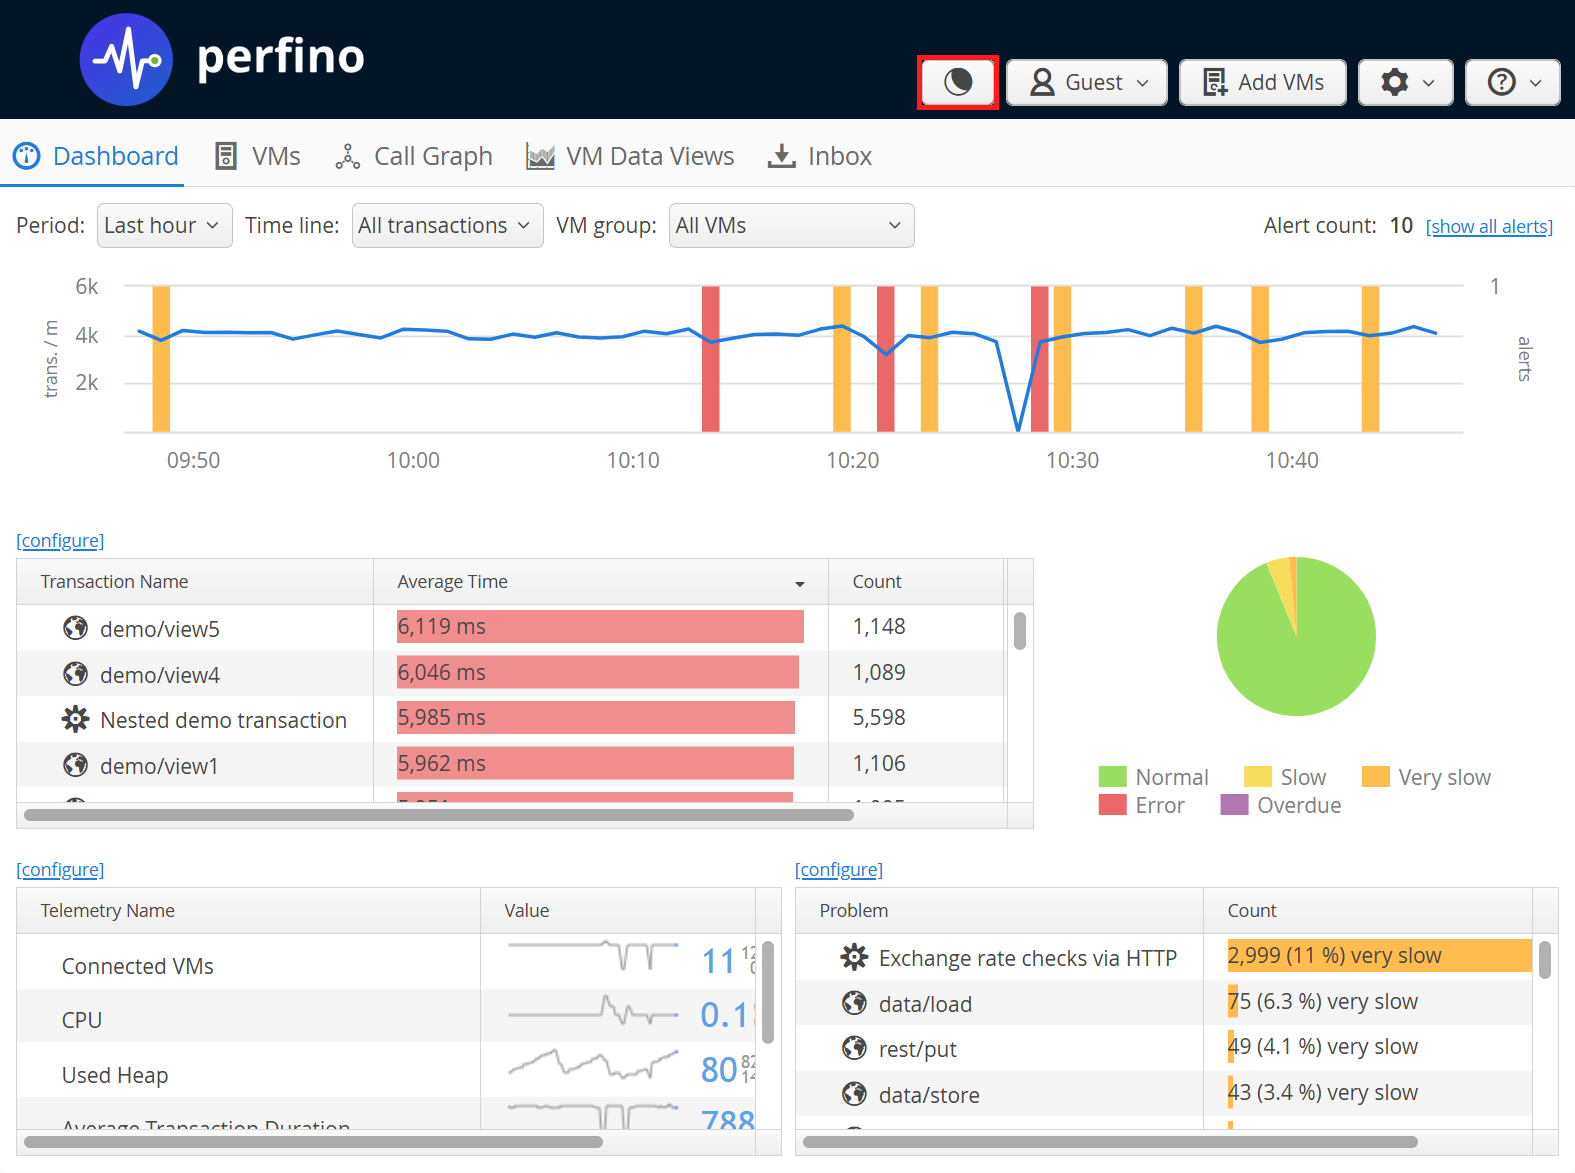
After logging in, you see the dashboard where important information about the activity and the health of the monitored VMs is presented on a single screen. From the dashboard, you can drill down into the more detailed "VM data views" by clicking on the items of interest, including transaction names, problems, sparklines and slices of the policy violation pie chart.
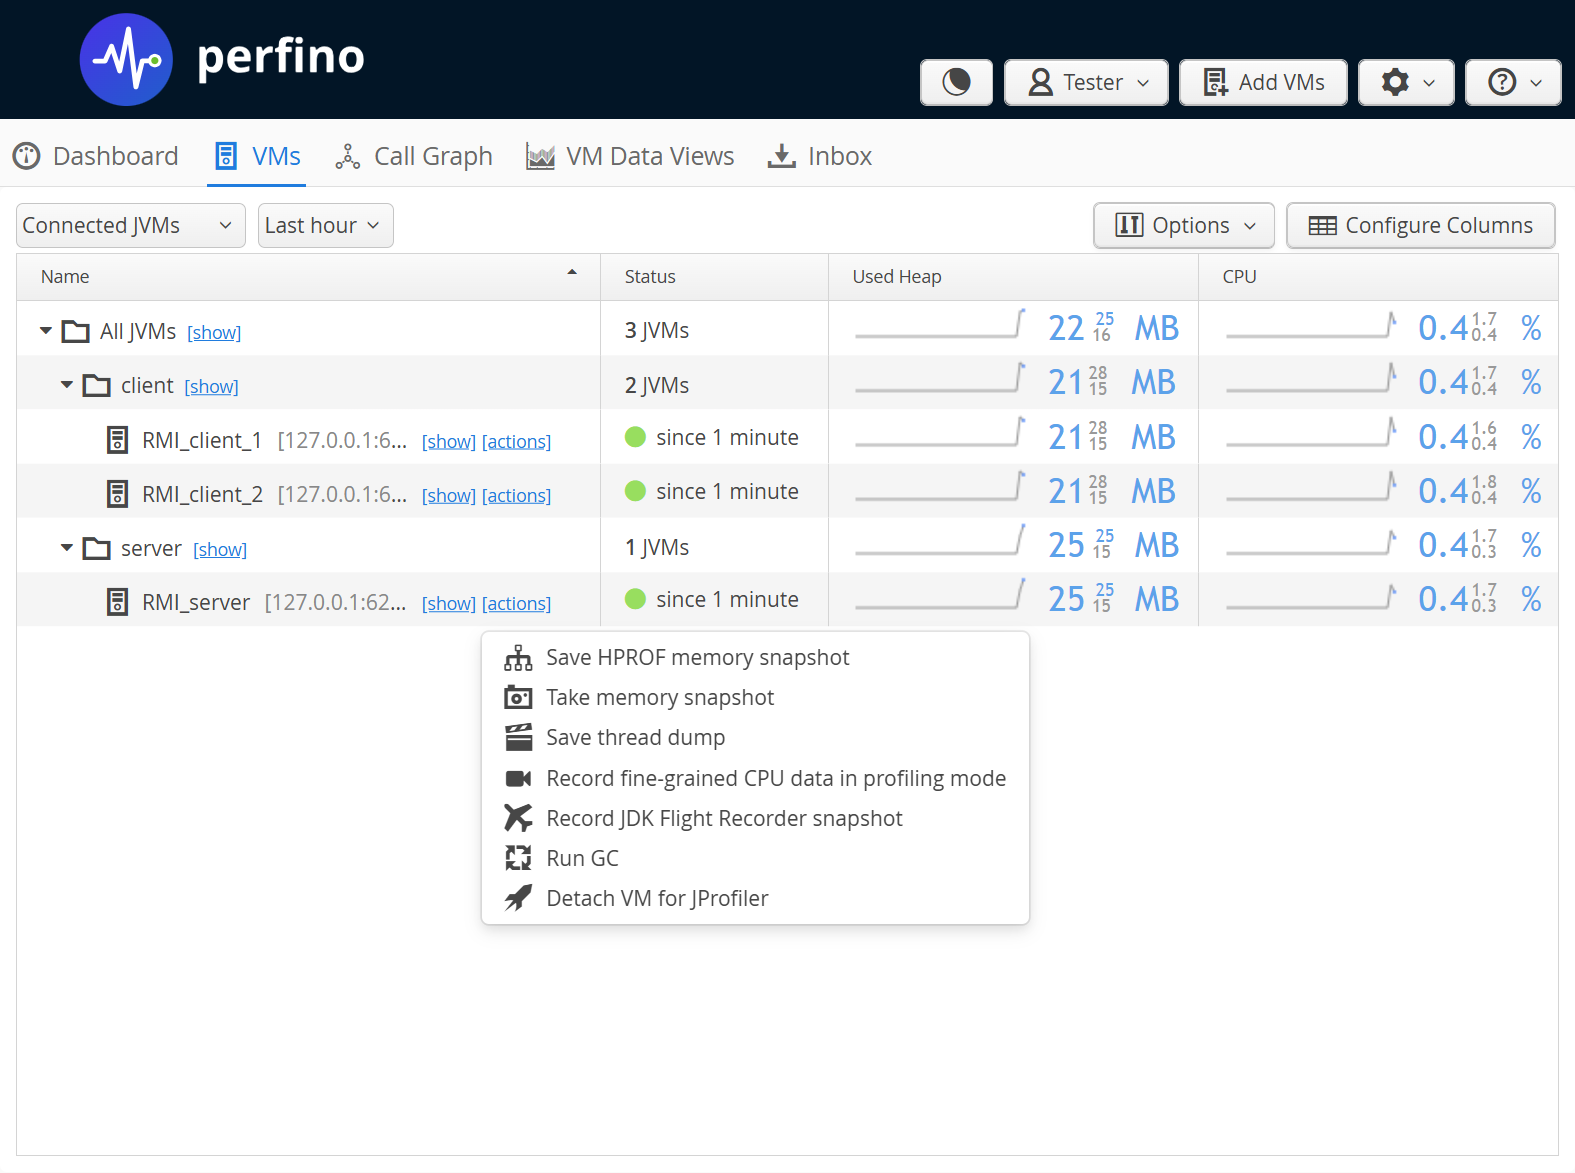
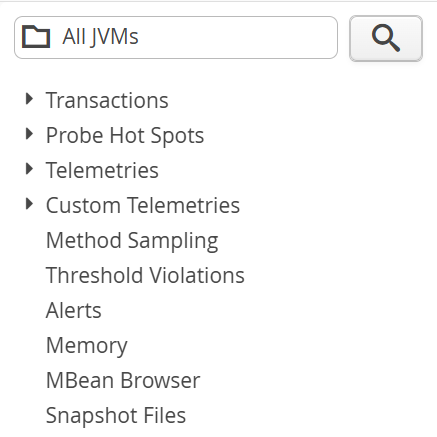
The VMs view shows you the hierarchy of all connected VMs, together with selected information in the form of sparklines.
The "show" context action takes you to the "VM data views" for the selected group or VM and provides quick access to all recorded data that is available for your selection. Like in the dashboard, clicking on the sparklines takes you to the full telemetry views in the "VM data views".
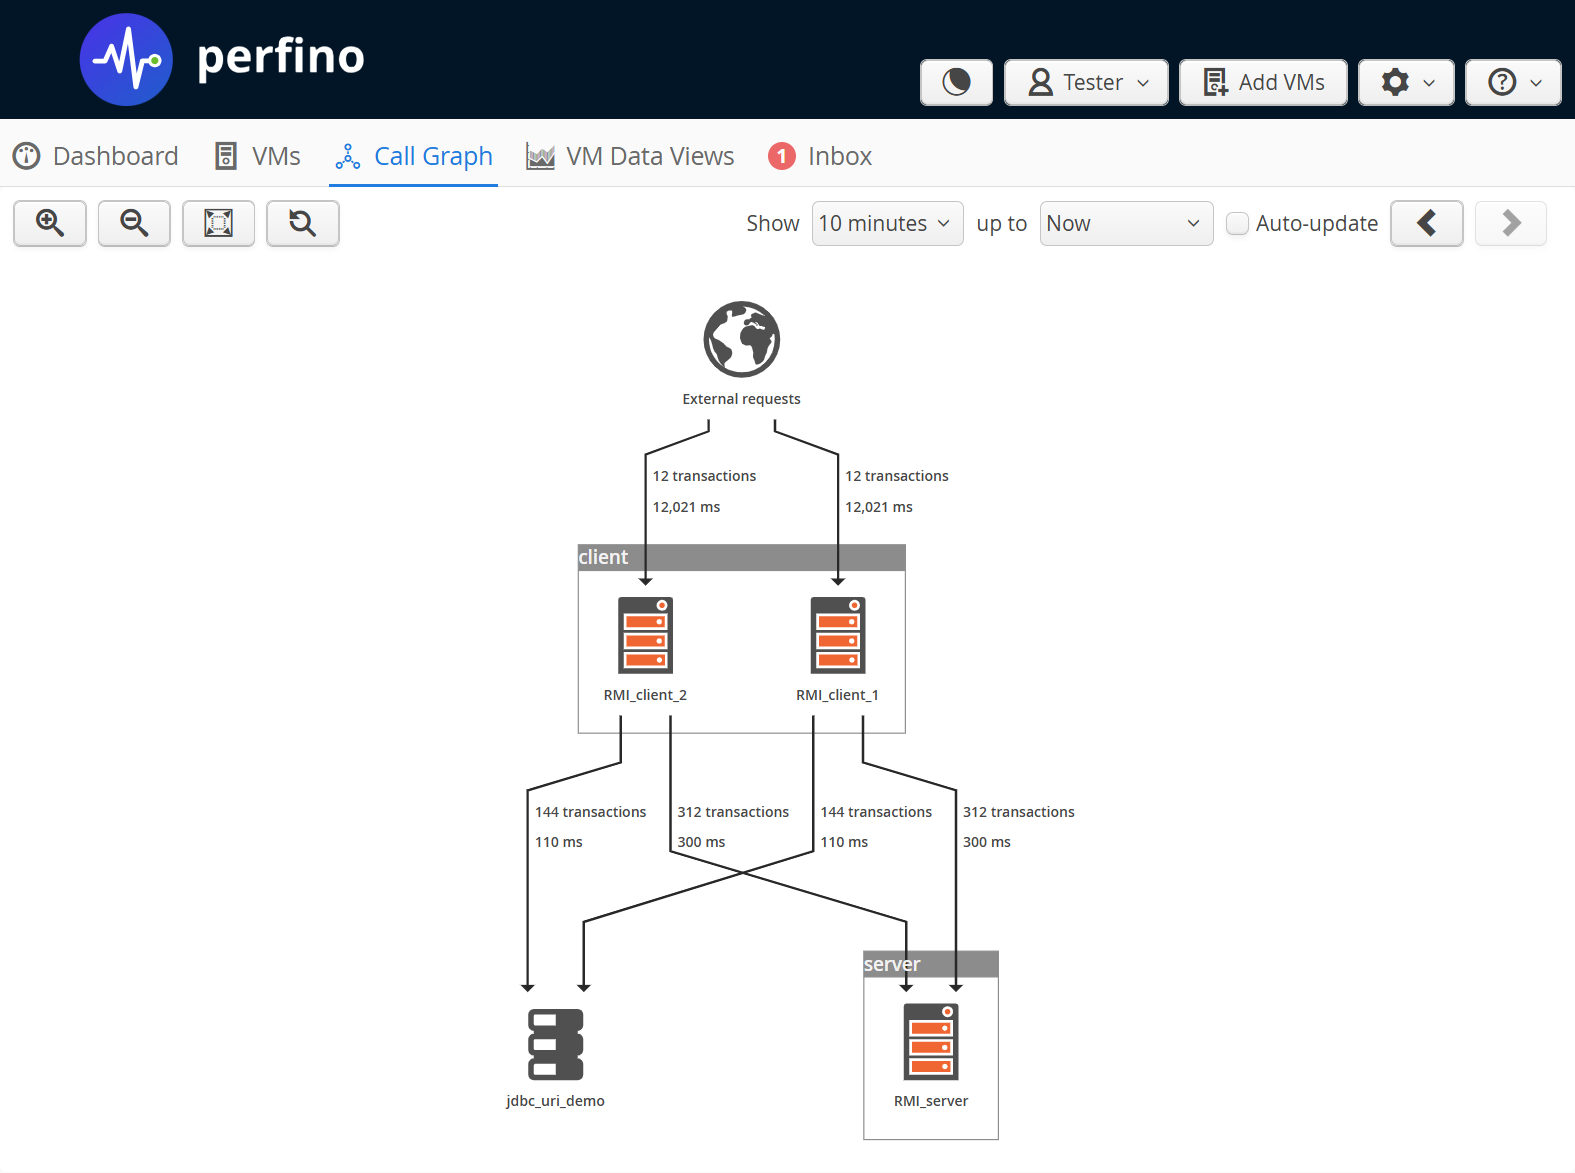
The call graph focuses on remote calls between monitored VMs. Each VM is a node and remote calls like EJB, RMI and web service invocations are edges in the graph. Clicking on nodes and edges shows further information.
The VM data views tab holds all views that show data for a single selected VM or a group of VMs. The actual VM selection and the desired view can be adjusted in the view selector.
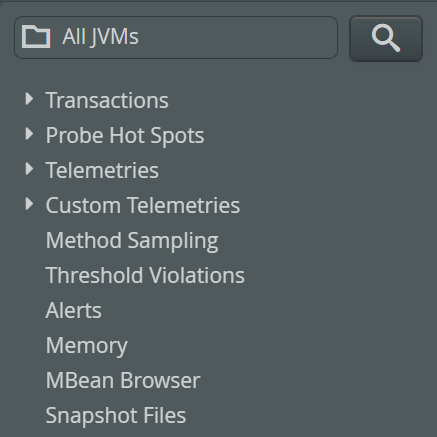
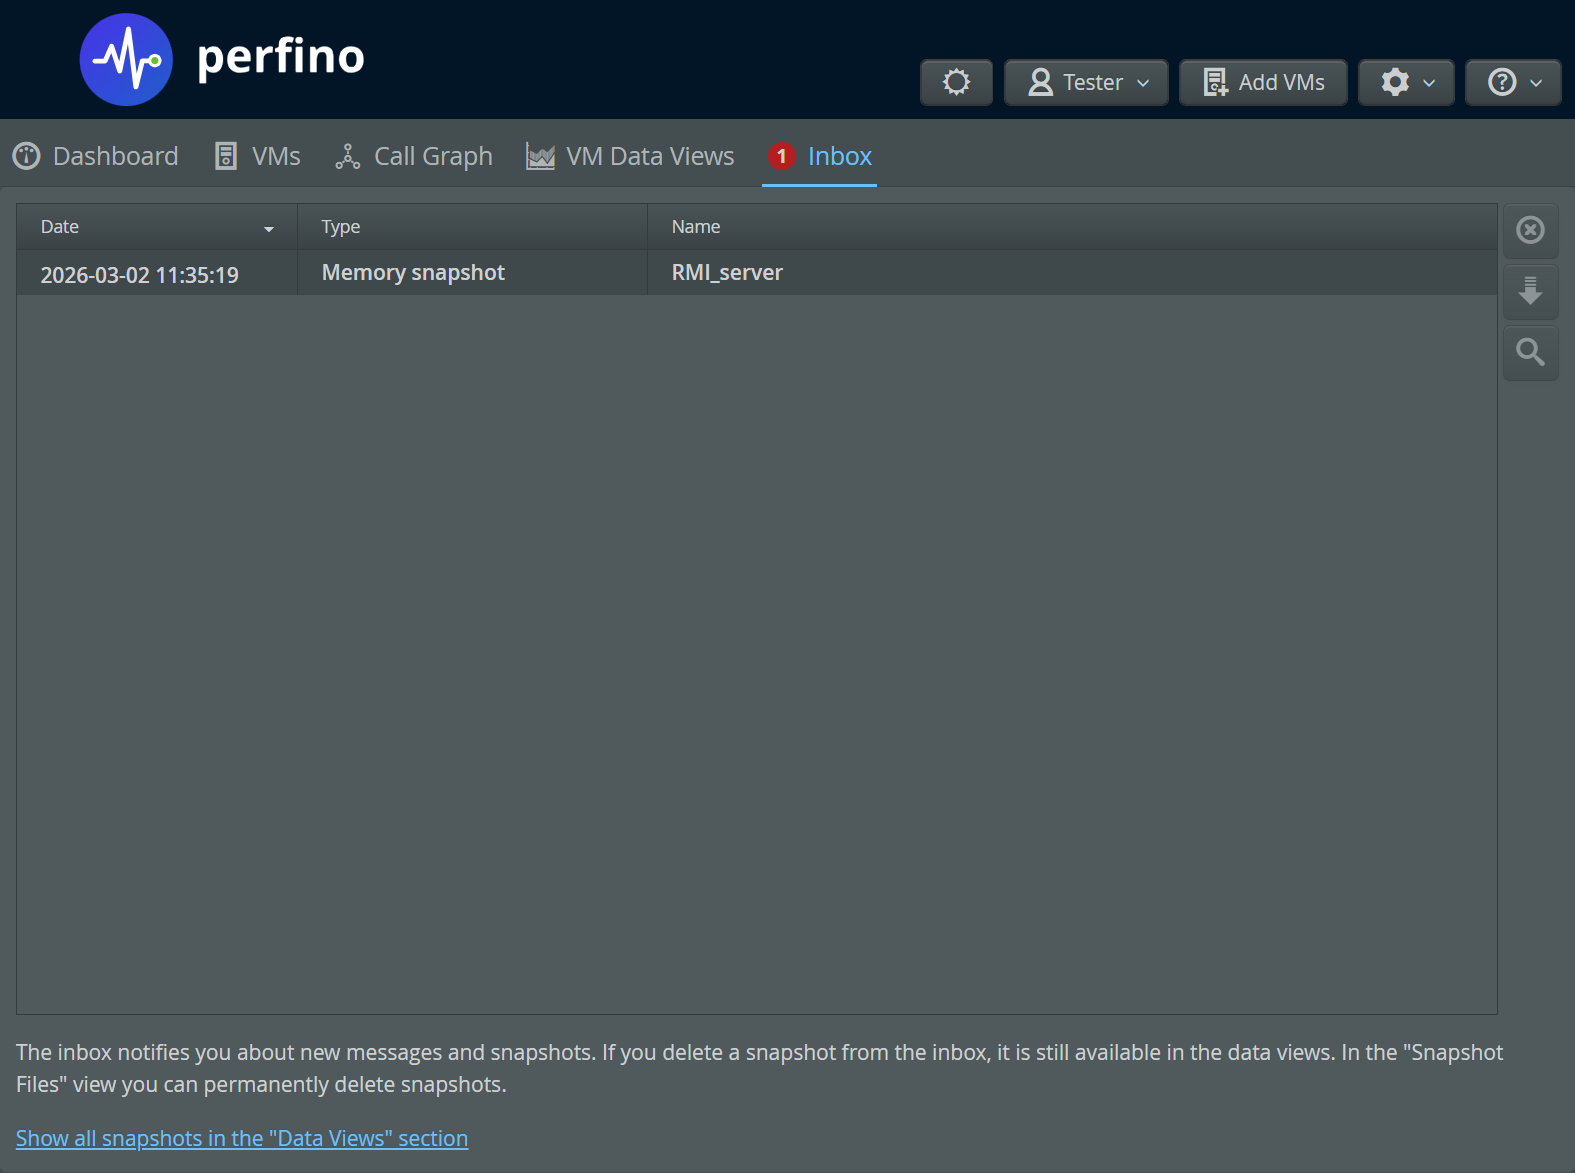
The inbox view shows all messages that have been sent to you. For example, if you start full-VM sampling on a particular VM, a notice will be sent to your inbox once the snapshot is ready for downloading.
If there are unread messages in your inbox, you will see a red notification in the tab area.
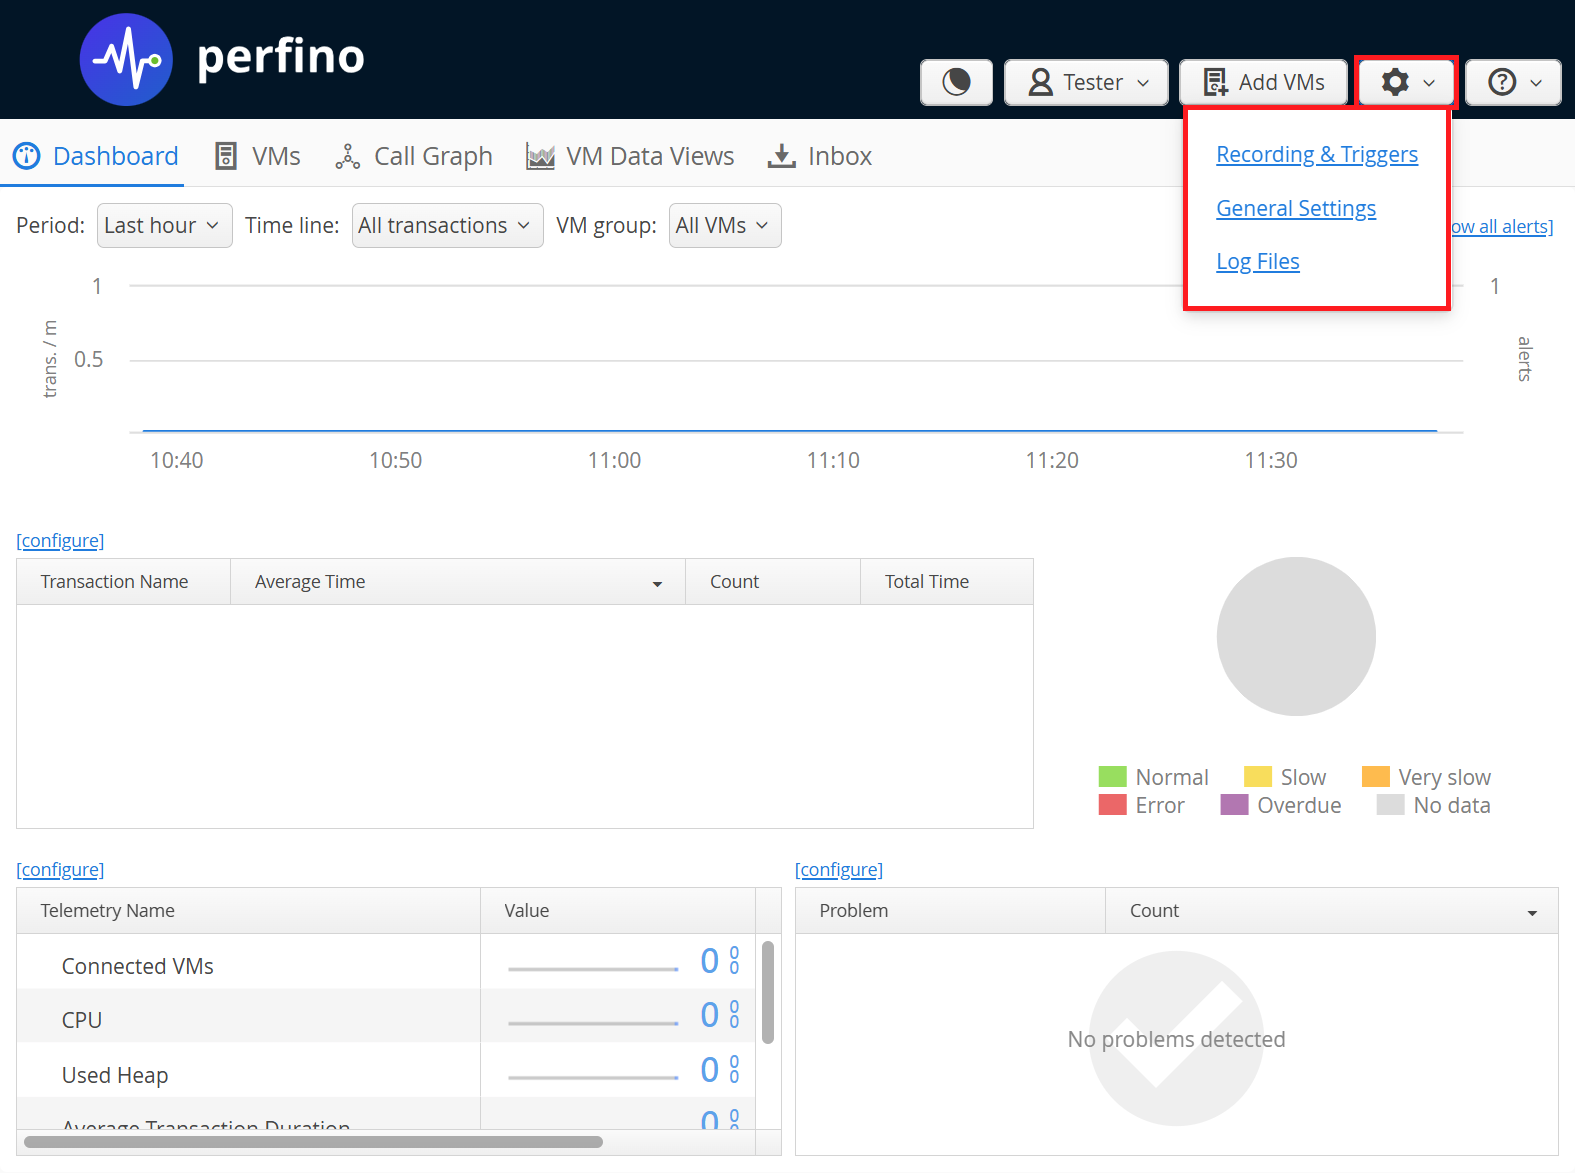
Configuration
Configuration is divided into two parts: general settings and recording options. If you want to view and edit general settings, you have to be an administrator. Recording options can also be edited by the "profiler", but not by the "viewer" access level.
Both general settings, as well as recording options are modal panels. If you did not change anything, you have to click on the "Go Back" button to return to the data perspective.
If you made a change, the "Go Back" button is replaced by Apply Changes and Discard Changes buttons. No changes to the configuration have any effect before this confirmation.
General Settings
In the general settings you administrate the perfino server. This includes
- the users and their access levels
- the license keys
- data consolidation options
- SMTP access
In addition, you can export and import the entire server configuration.
Recording & triggers
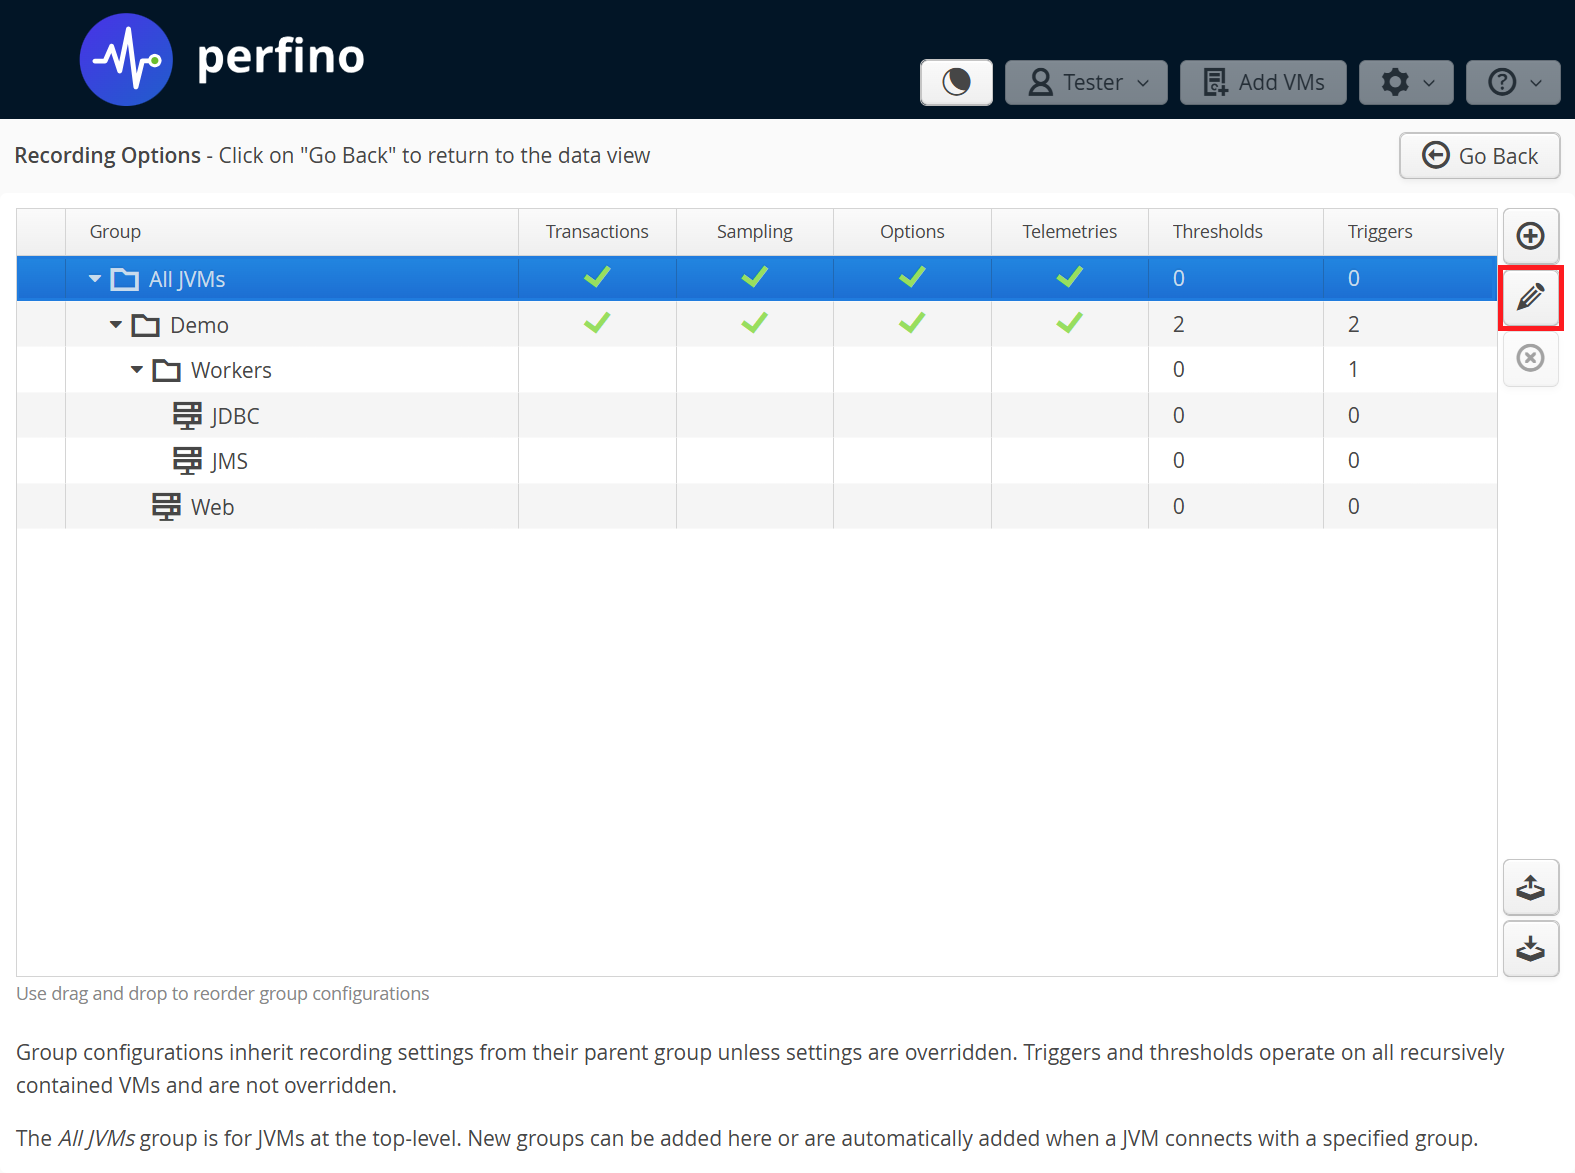
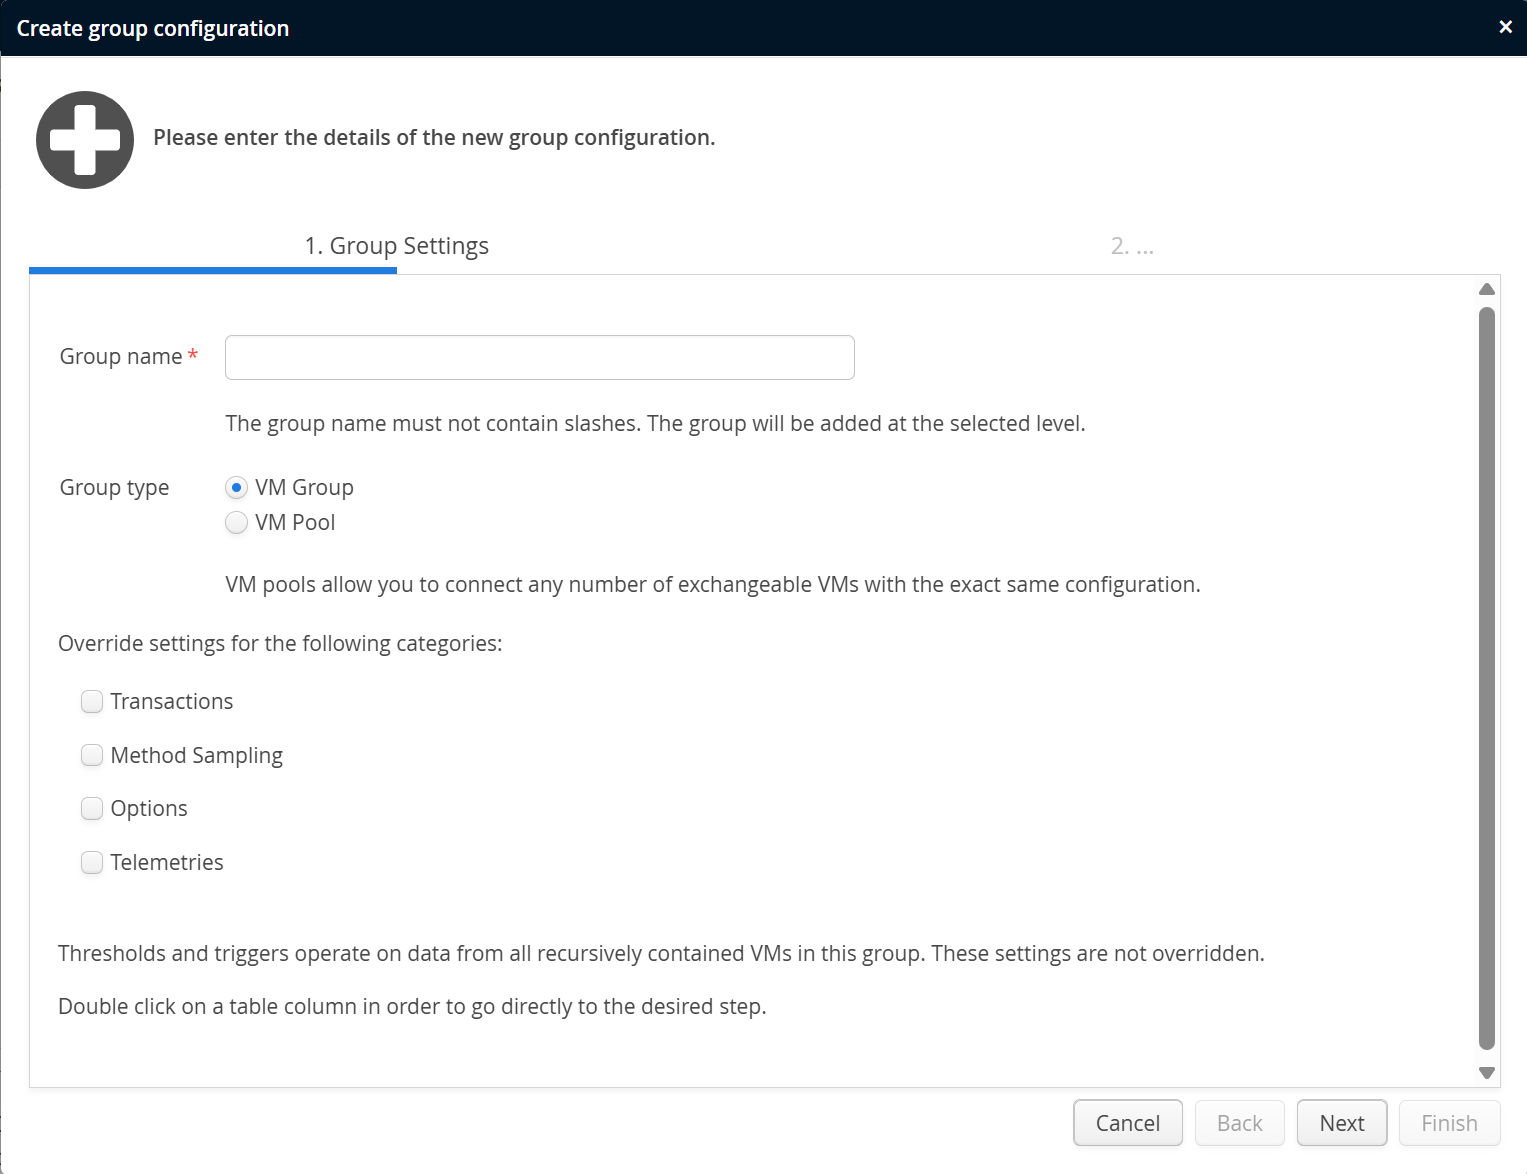
Recording options and triggers are configured for each VM group. You can click the edit button or double-click on any column to jump directly to the desired step.
The configuration contains recording options as well as threshold and trigger settings. Recording options are sent to the monitoring agents in each connected VM. They are inherited to nested VM groups and nested VM groups can override settings in their parent groups.
Thresholds and triggers, on the other hand, are handled in the perfino server and are processed for the VM group for which they have been defined. They operate on all VMs that are contained recursively in their VM group. If you need additional thresholds or triggers that operate only on a nested VM group, you can define them on that group.
User settings
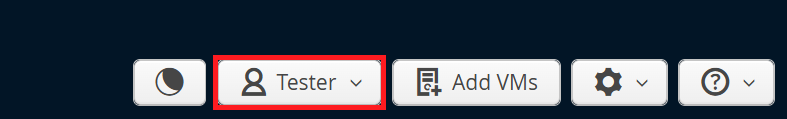
The user drop-down in the header shows selected information about your account and the current session and contains the Logout button that terminates your perfino session.
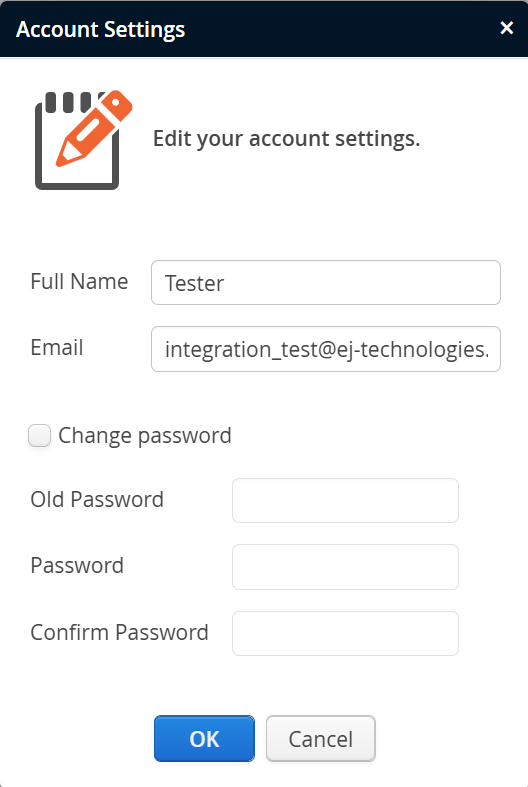
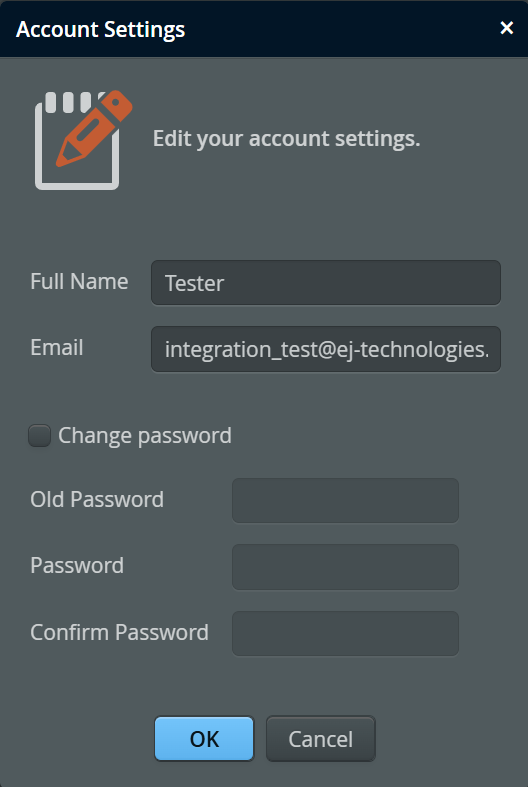
User settings, like your name and password can be adjusted by following the "Account Settings" link. If your access level is "profiler", this is where you can see the VM groups that you are allowed to modify.
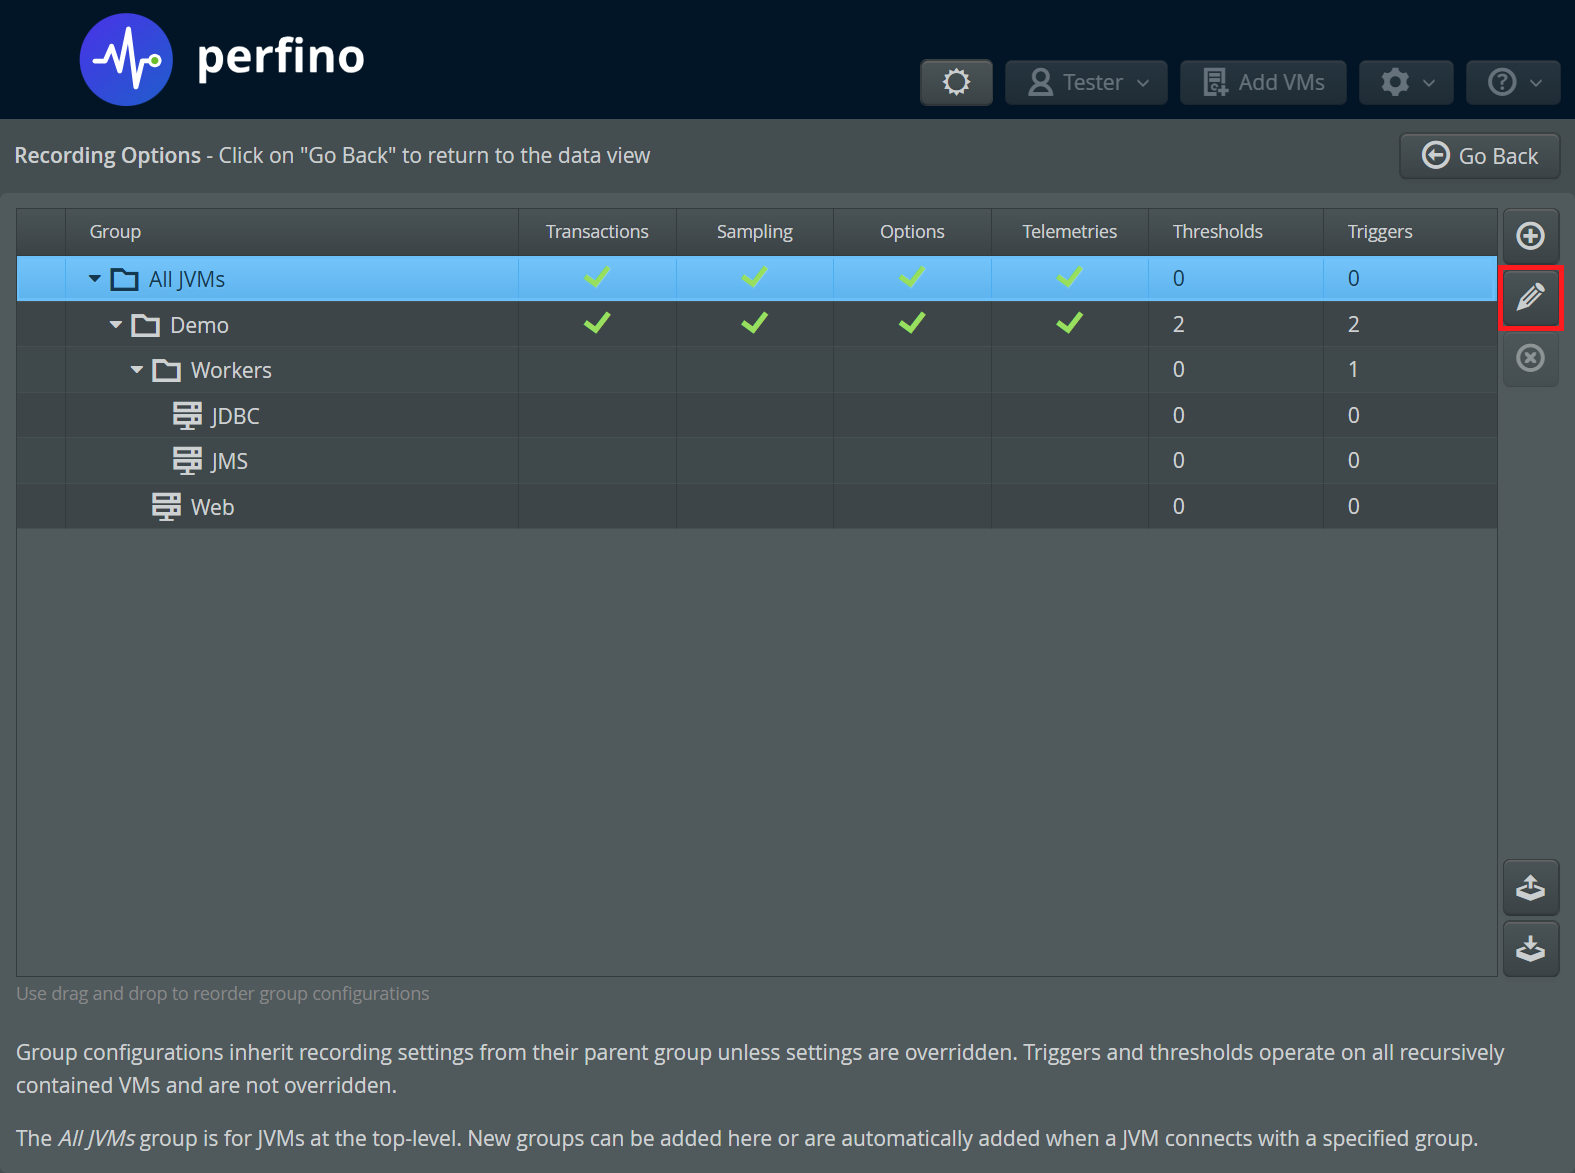
Dark mode
If you prefer a dark UI, use the theme switcher in the header. The setting is persistent for the current browser.