Alerts communicate anomalous conditions to you and other users of the perfino UI server. By default, perfino does not create any alerts since the conditions that are noteworthy on such a level are highly individual.
Configuration
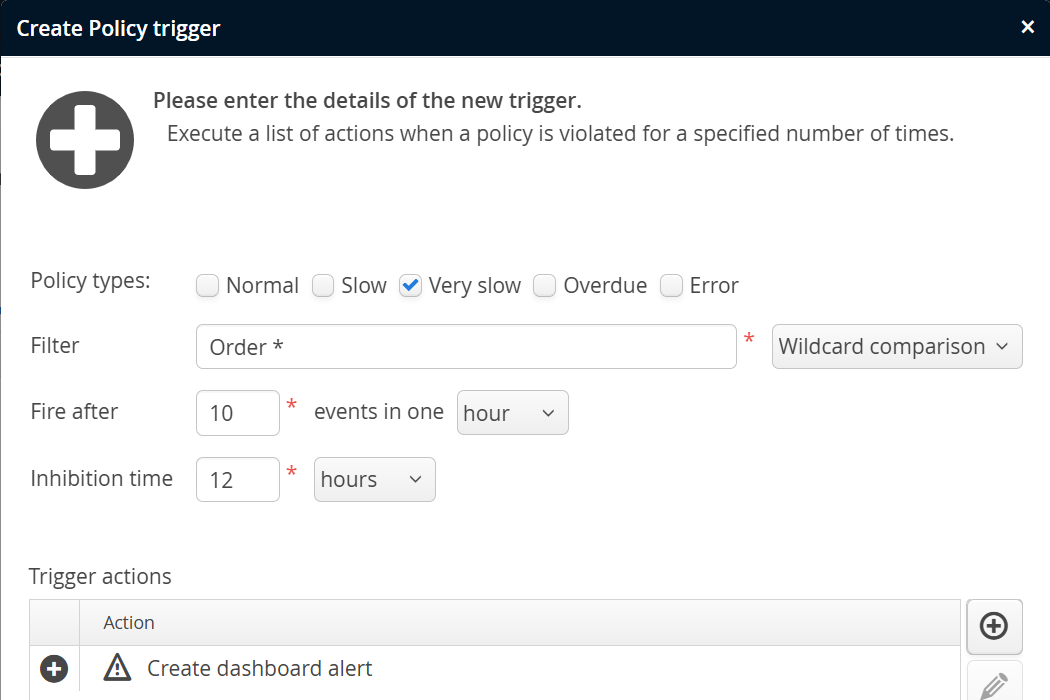
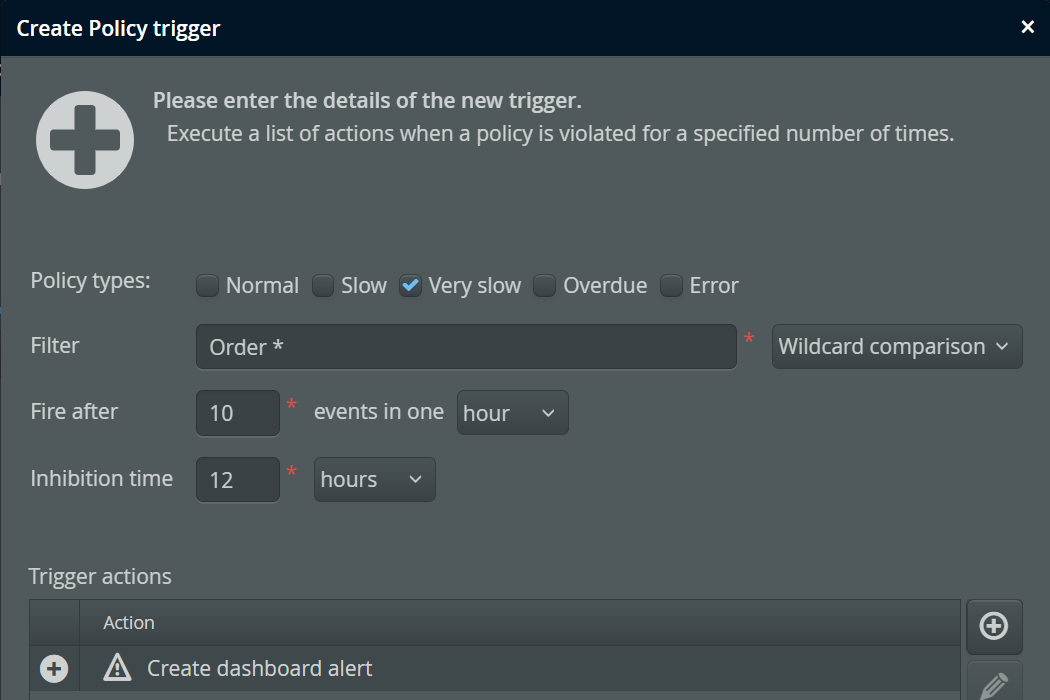
To create alerts, you have to add a trigger that fires for a specified policy or threshold violation. In the list of actions, add a "Create dashboard alert" action.
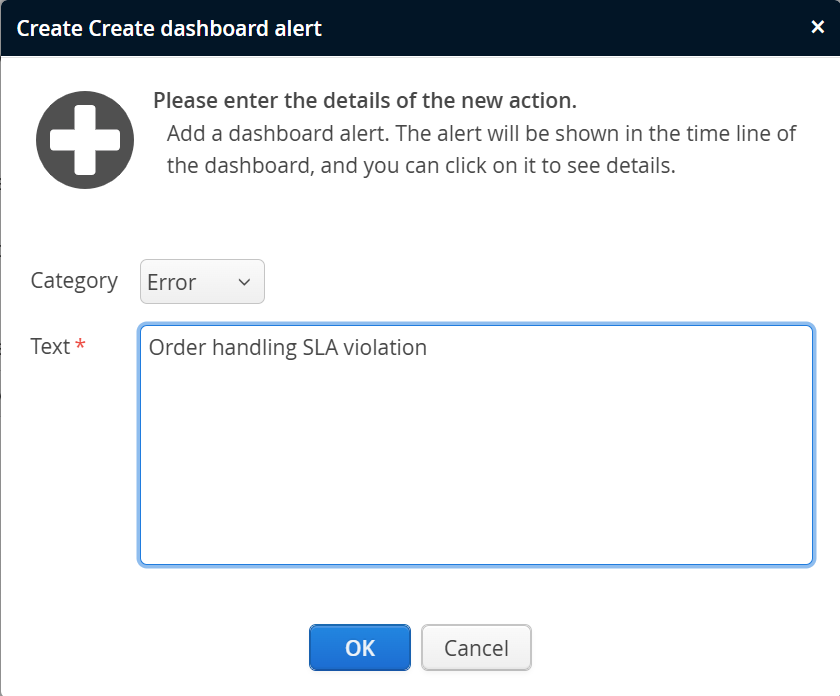
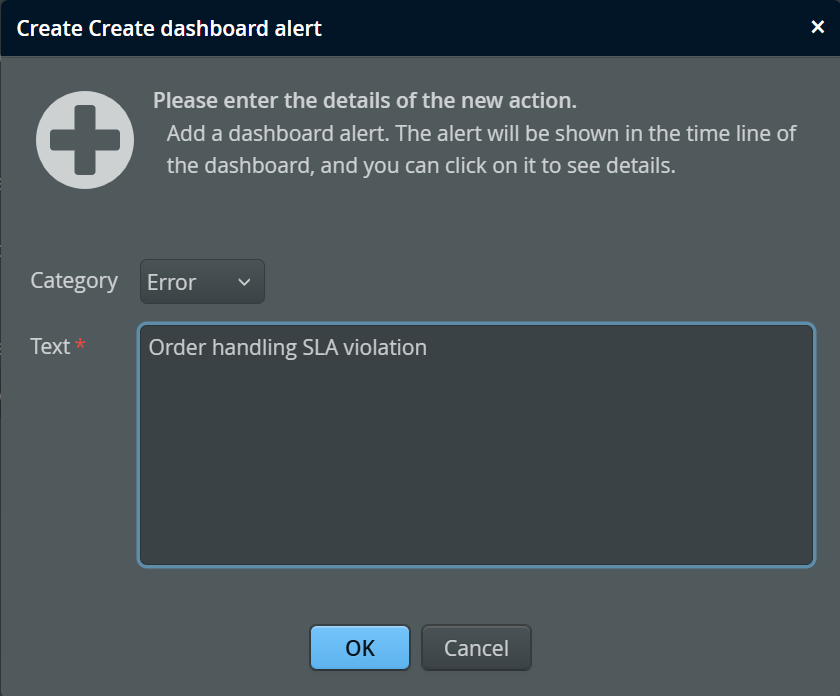
When configuring the "Create dashboard alert" action you can specify a category. This selection determines the color of the alert bars in the dashboard:
-
Error
Red alert bars -
Warning
Orange alert bars -
Info
Green alert bars
With the configured text message, you will be able to identify the origin of the alert in the data views.
Data
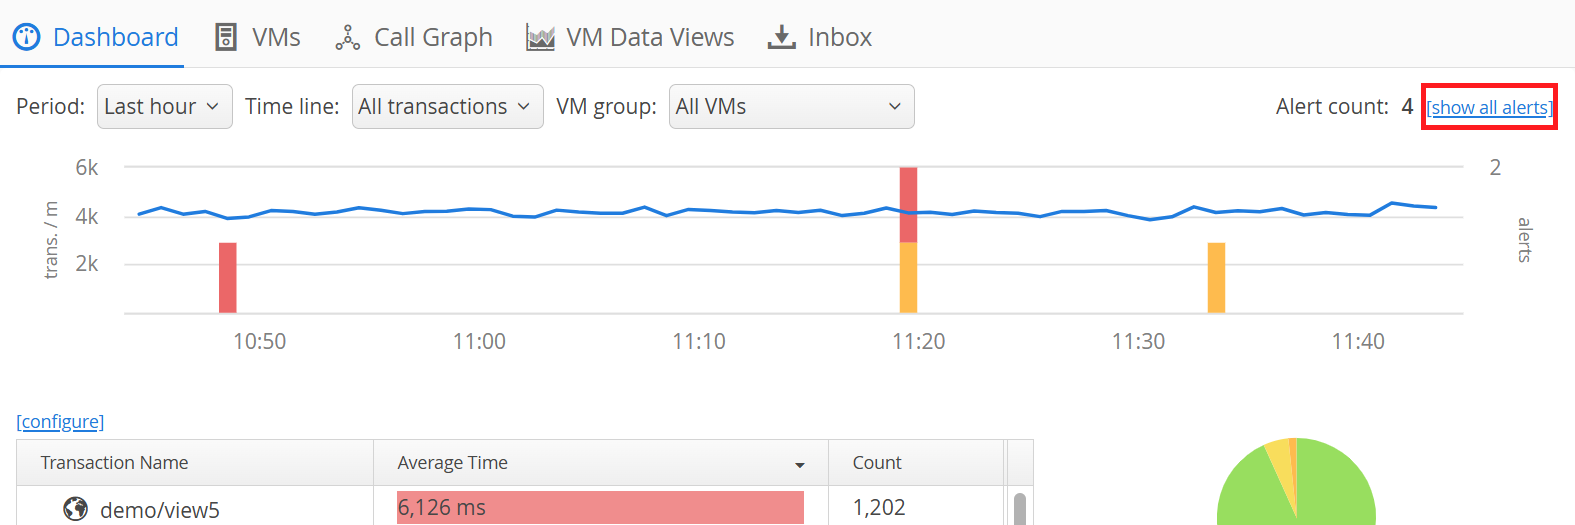
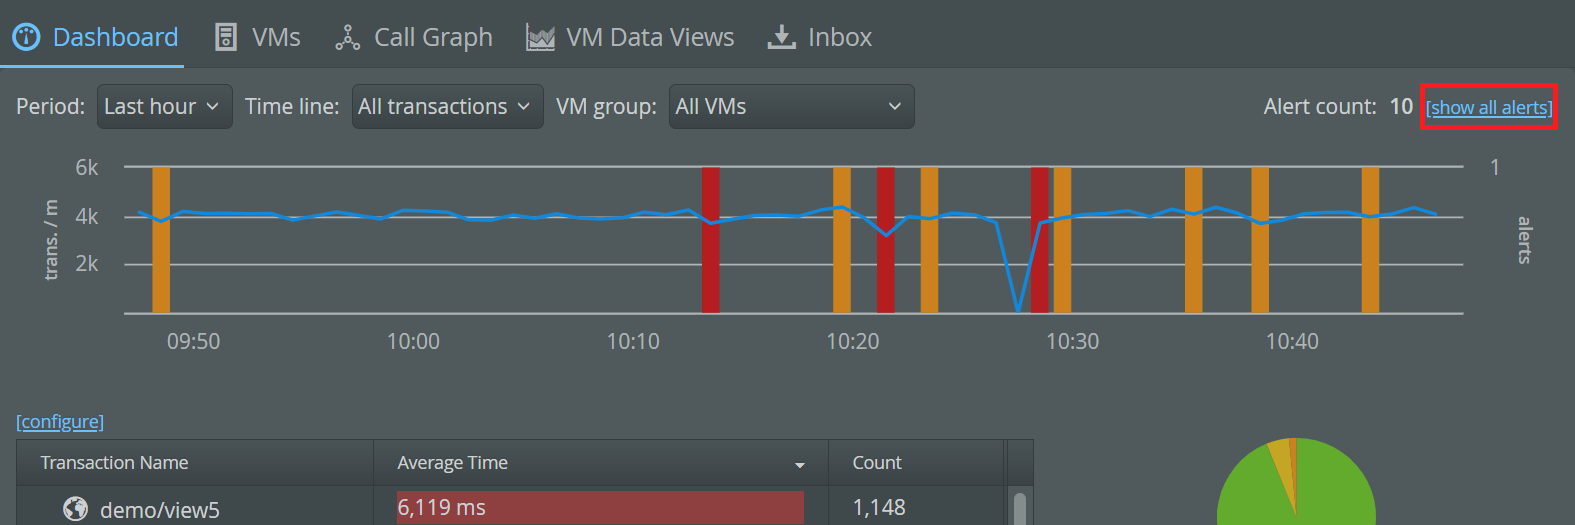
Alerts are displayed in the dashboard. They are drawn as alert bars over the transaction timeline. In this way, you can quickly correlate an alert with an increase in the general activity of your application.
If there is more than one alert in the same time slot, just one alert bar is shown with a height proportional to the number of contained alerts. If those alerts are from different categories, the associated colors are shown stacked on top of each other. The tool tip shows the number of alerts in each category.
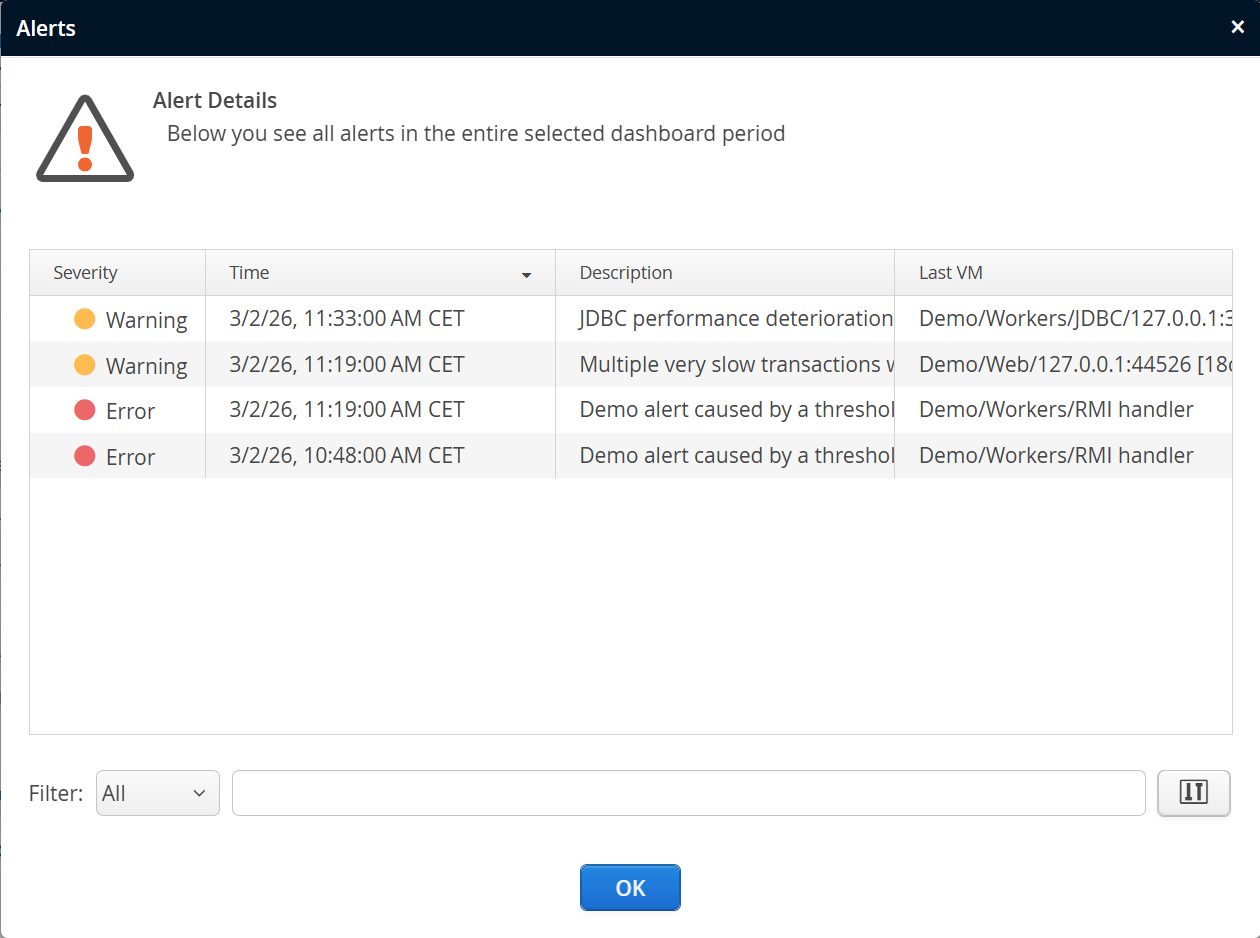
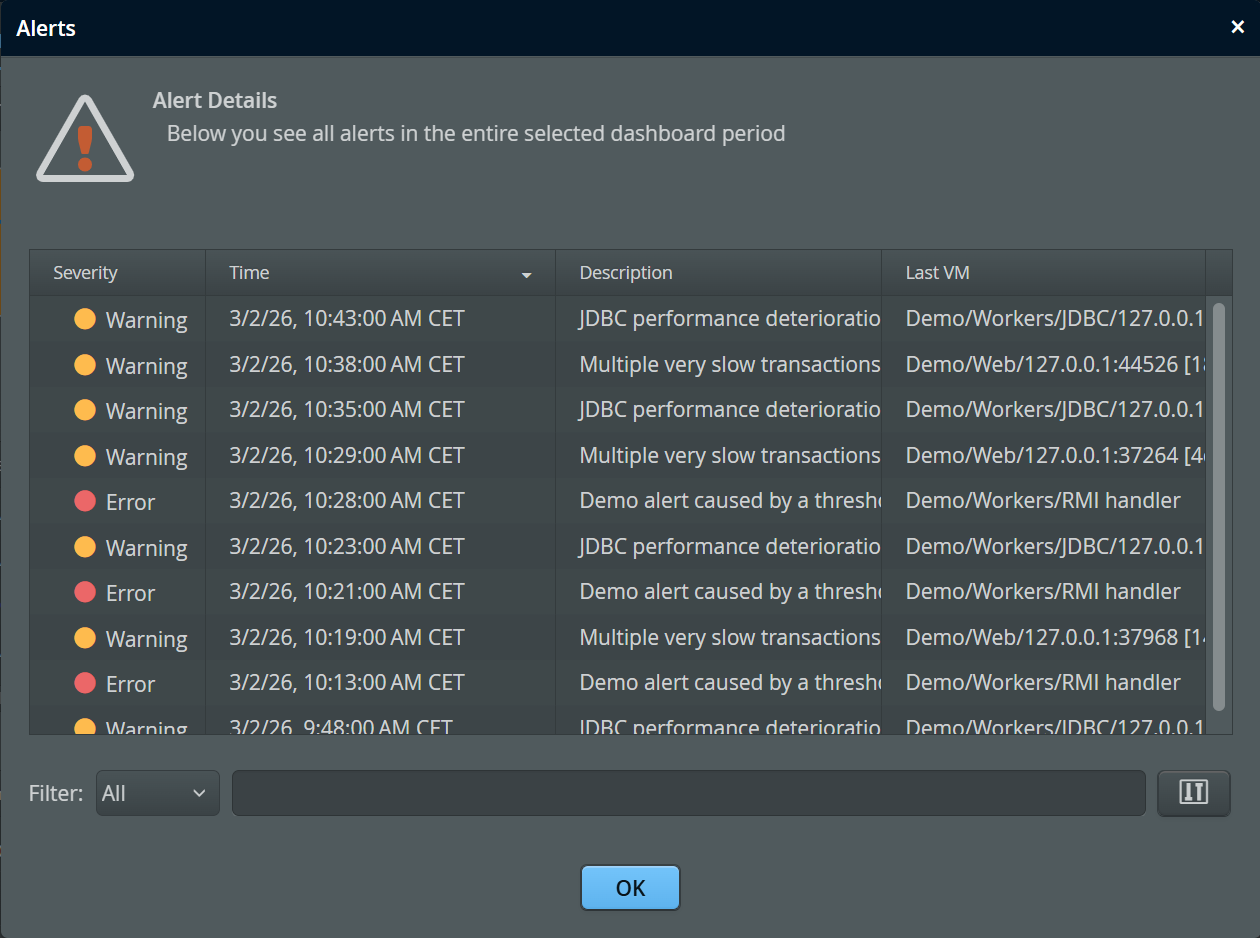
Clicking on the alert bar brings up the alert detail dialog where you can see exact times, categories and the text messages that were configured in the trigger action. To view all alerts in the time range that is currently displayed by the transaction time line, click on the "show all alerts" link in the top-right corner.
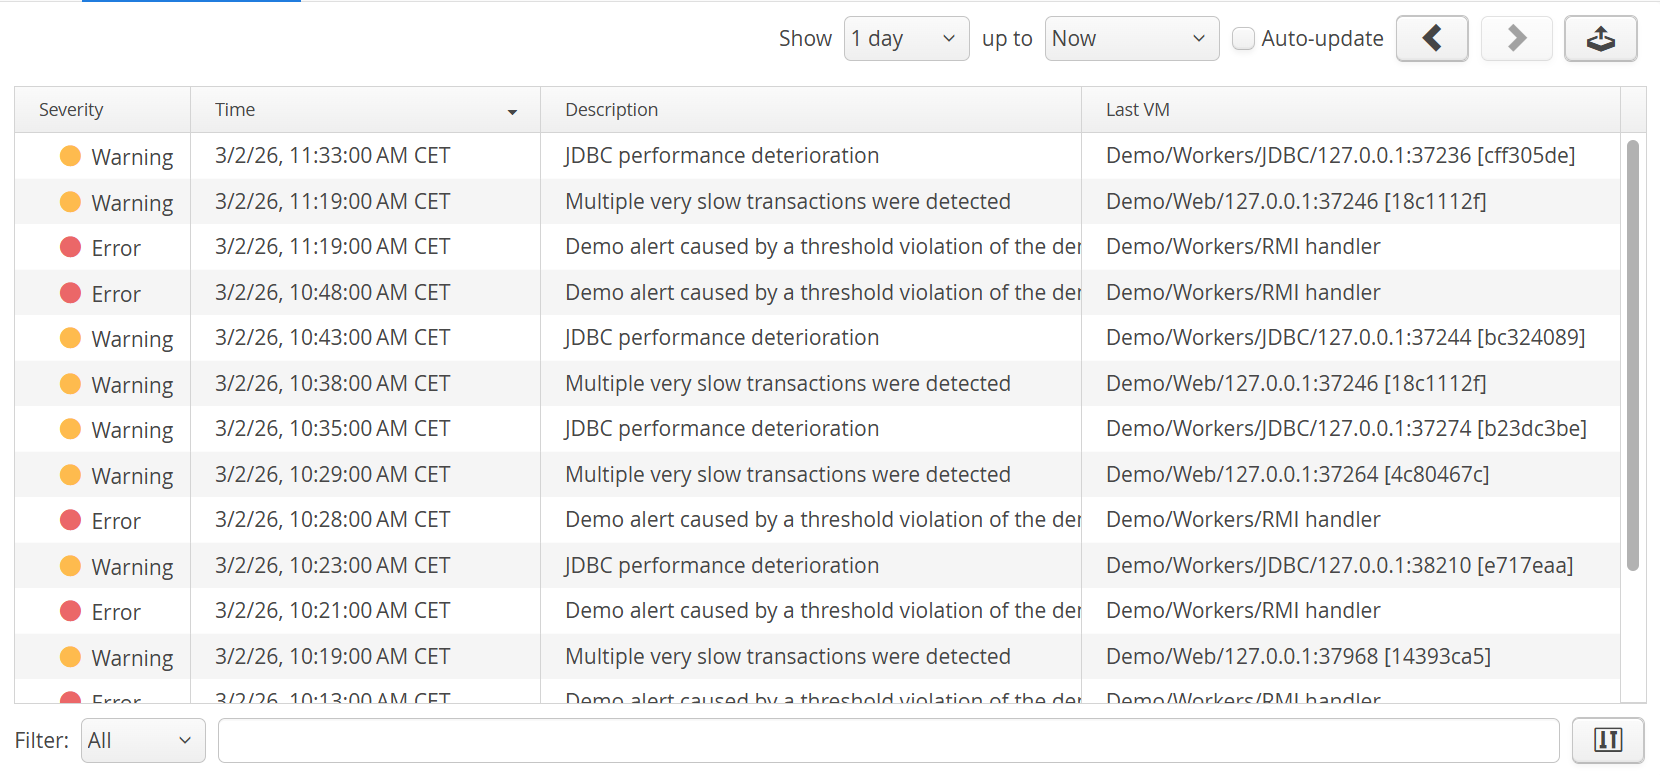
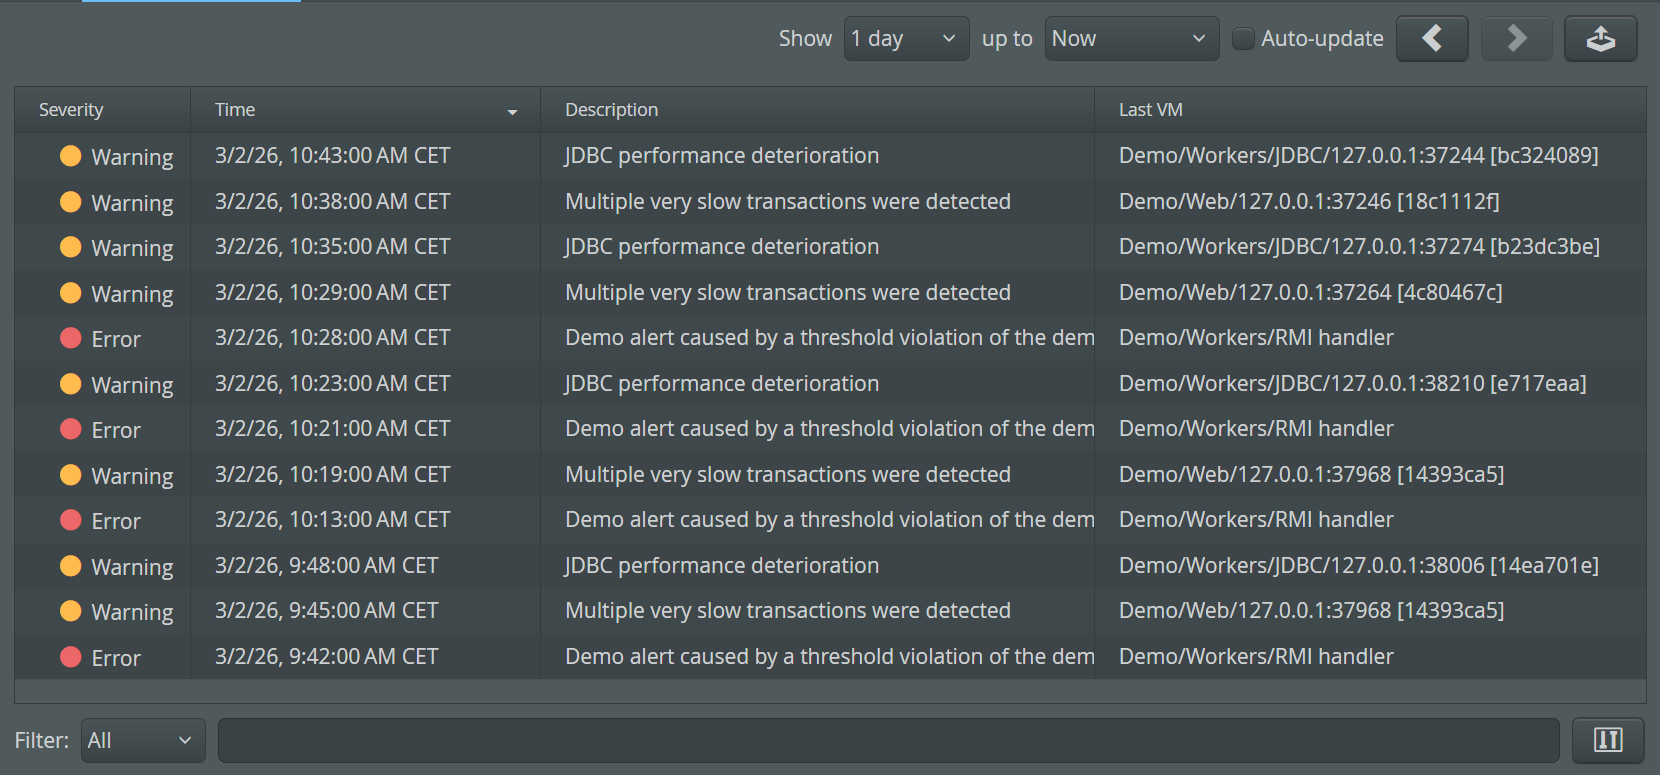
The "Last VM" column in the detail dialog shows the VM that was responsible for triggering the alert. Note that triggers always react to policy and threshold violations of entire VM groups, so multiple VMs may contribute to the condition that creates a single alert.
The dashboard only shows alerts from the selected period and from VMs that are recursively contained in the selected VM group. By changing the period or the VM group selection, you can limit the displayed alerts to your focus of interest.
To analyze alerts in a historical context, go to the alerts view in the "VM data views". Here you can see alerts from previous days, weeks or months. If the "Auto-update" check box is selected, alerts are displayed as soon as they are generated by perfino. Also, you can inspect alerts from a single VM only, which is not possible in the dashboard.