What is method sampling?
Policies in perfino help you to identify slow transactions, but the cause of the slowness is often not clear, since it usually originates in a subsystem that is not monitored separately. In that case, you need more information on the method level.
The way perfino gets this information is by periodically inspecting the thread that executes a transaction and by recording its stack trace. By comparing subsequent "samples", perfino can build an approximate call tree. It has no information on invocation counts, since it is not possible to tell if a method is still being called since the last sample was taken - or if it has exited in the meantime and is being called again. The more time is spent in a method, the better the information in the sampling call tree is. As such, sampling is a great tool to find hot spots in the monitored VM.
Automatic sampling
perfino can perform automatic sampling for transactions in two ways:
-
Periodic sampling
With periodic sampling, perfino takes one transaction from a particular transaction definition every couple of minutes and samples it from start to finish. Alternatively, perfino can take every n-th transaction and sample it. The latter may be preferable for rarely executed transactions. -
Sampling for slow transactions
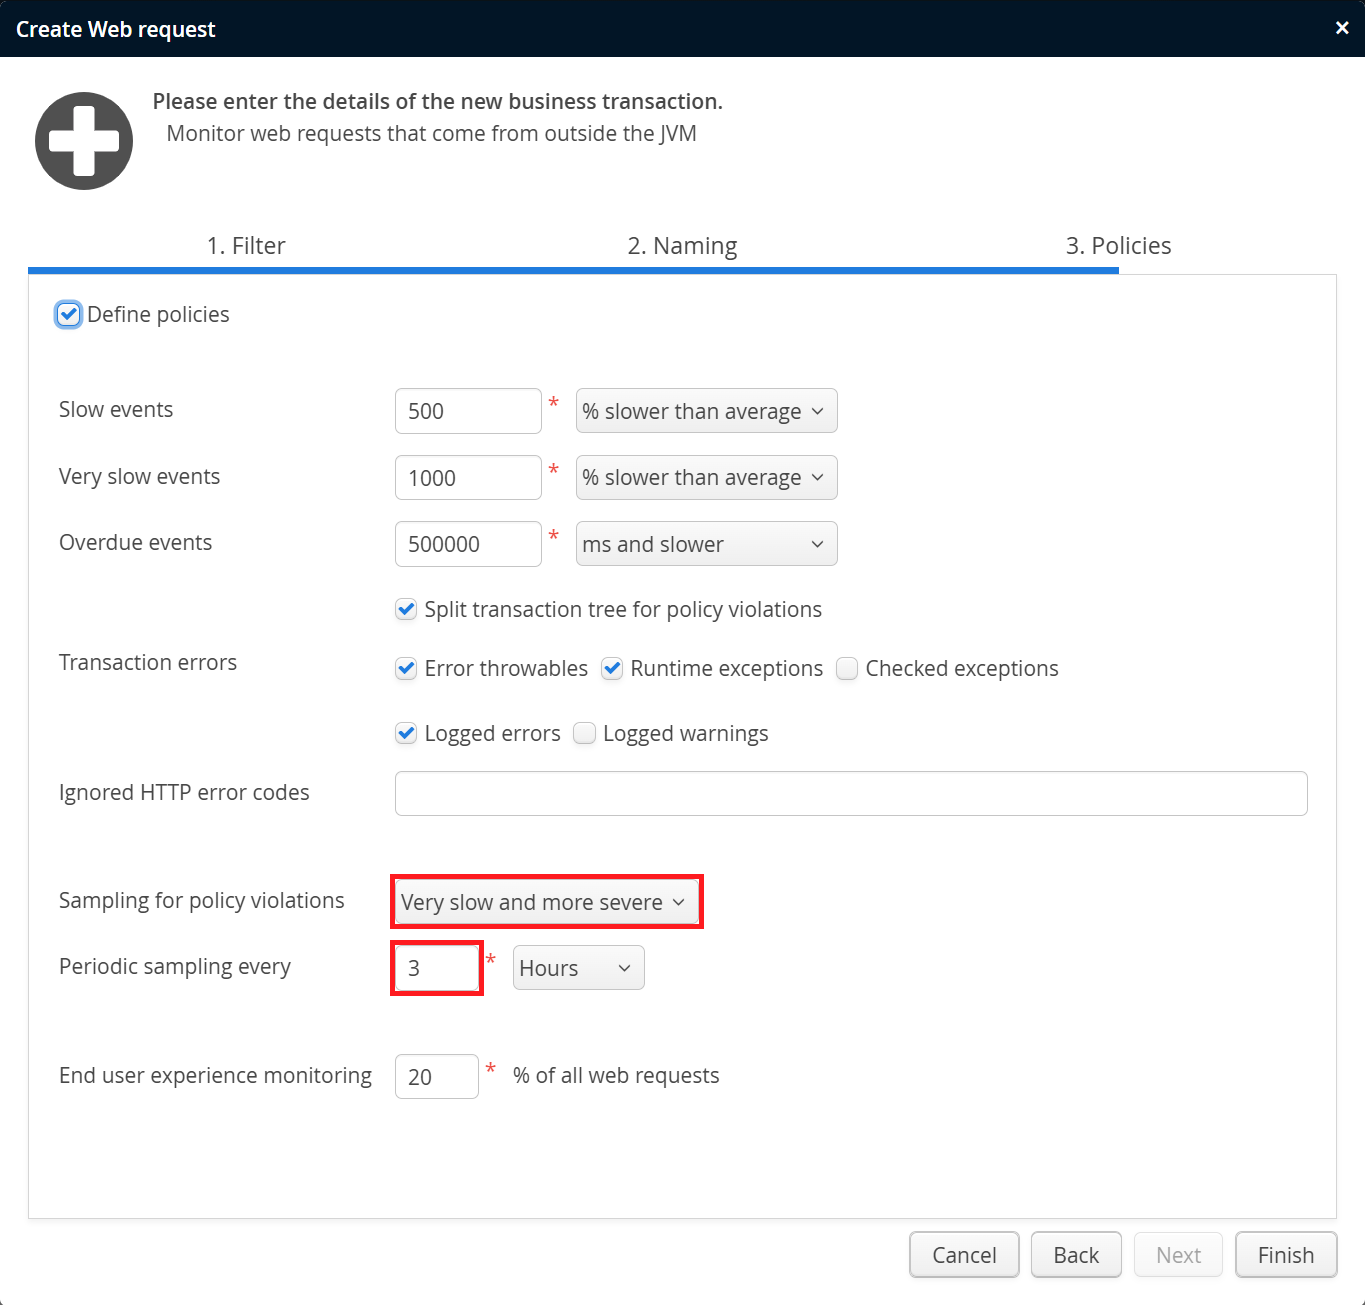
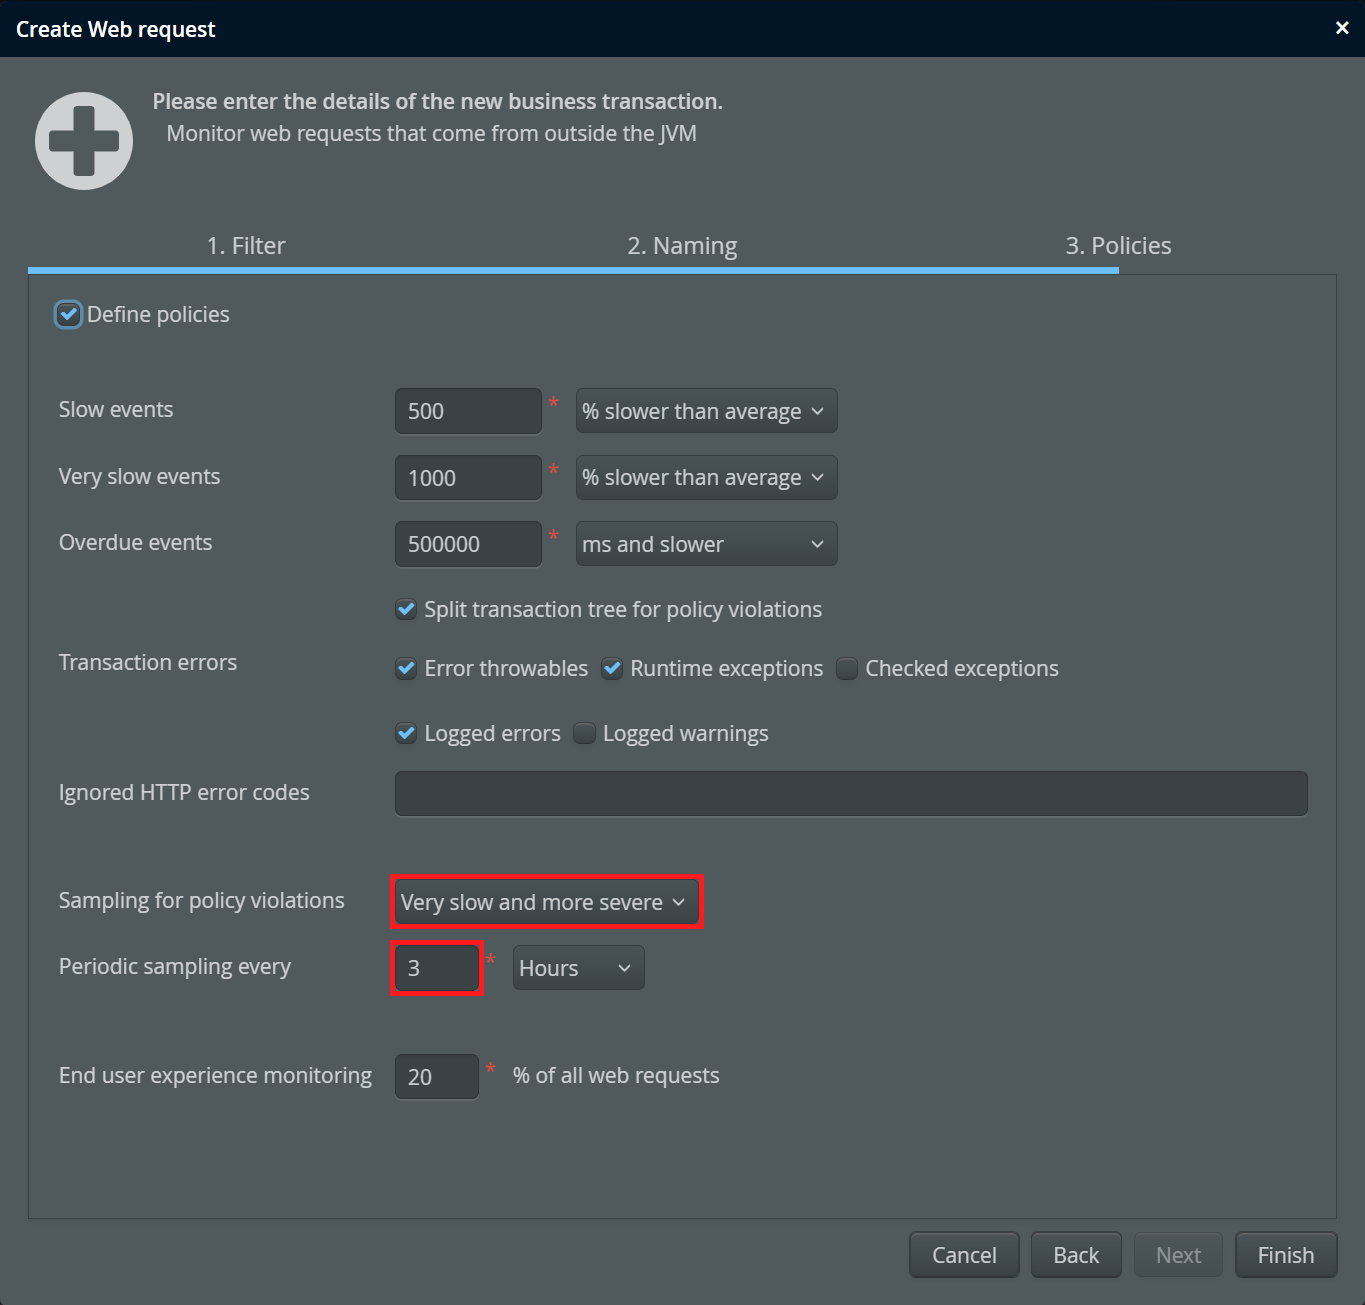
The most interesting samples are for slow transactions, because they let you investigate why a transaction is slow. perfino can be configured to sample slow transactions automatically. When a transaction passes the threshold of a policy violation like "slow" or "very slow", perfino then starts sampling until the end of the transaction. The period of time from the beginning of the transaction until the policy violation was reached is not sampled.
Both automatic sampling modes are configured in the "policies" step of a transaction definition.
Filters
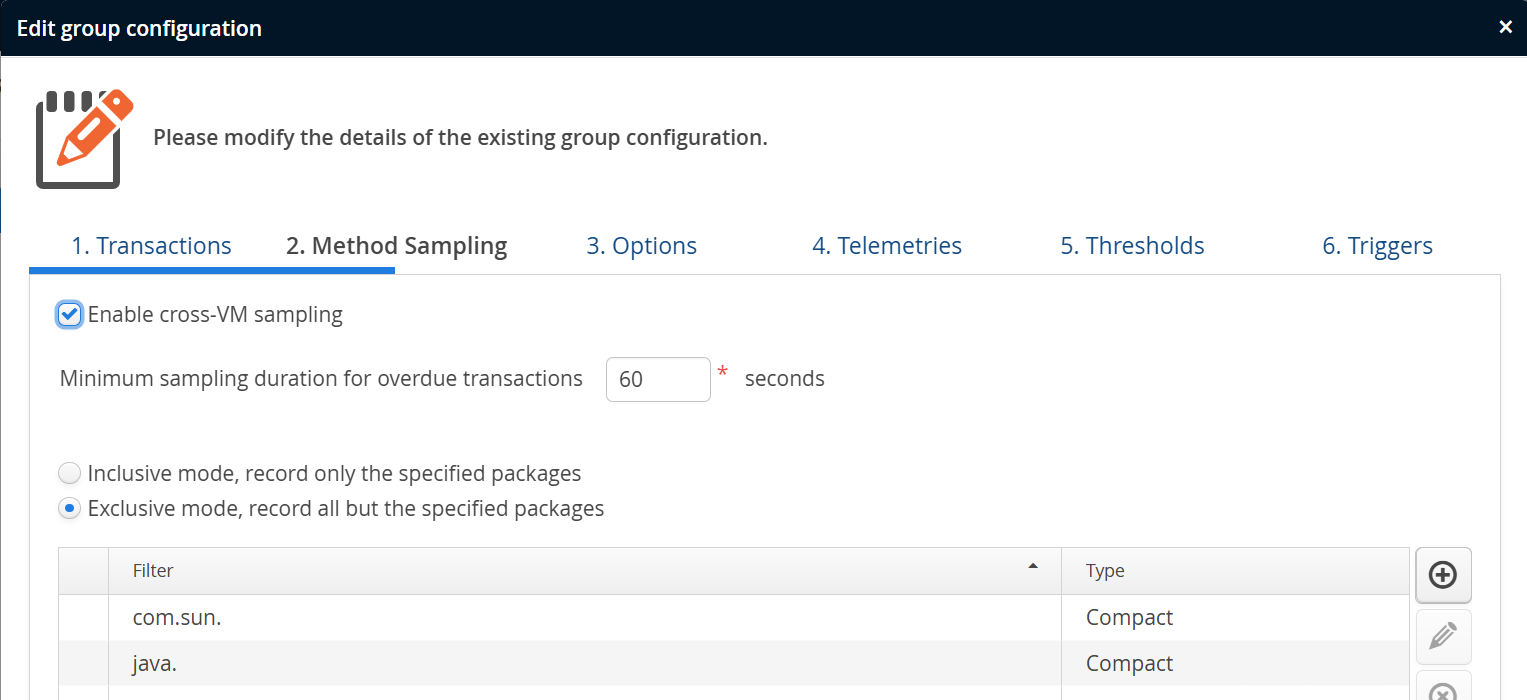
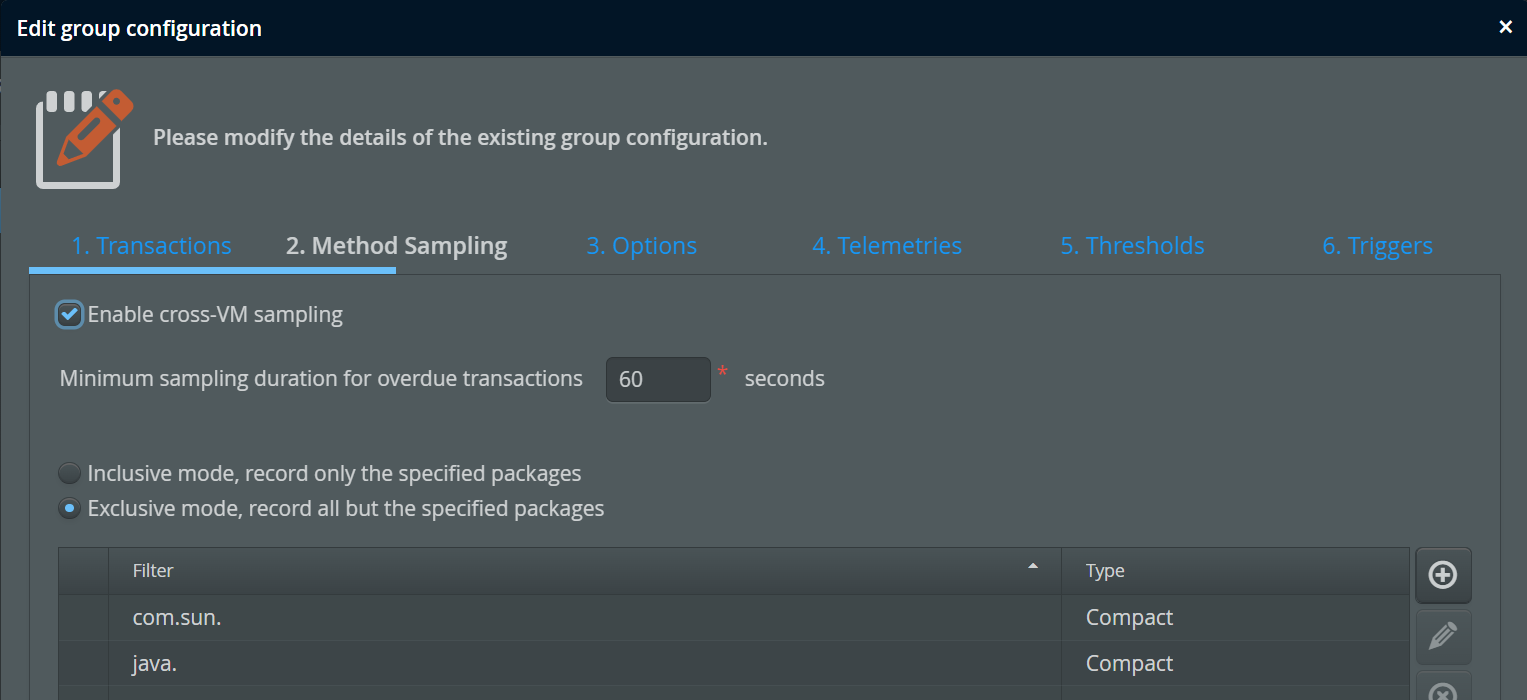
Method-level call stacks can become very deep. Too much detail is usually distracting, like the internal call structure of external libraries and the JRE. For each VM group, you can define the recording scope, either by specifying a list of packages that should be recorded (inclusive mode) or by listing packages that should not be recorded (exclusive mode). In both cases, the package filters are recursive.
For the exclusive mode, there are two types of filters:
-
Compact
"Compact" means that internal calls will be excluded from the sampling call tree. If a filtered class is called as an entry point (likejava.lang.Thread.run()) or from an unfiltered class, it will be displayed, but further calls within filtered classes will be hidden. This allows you to focus on the important methods that are in your code and where you are able to change something. However, you are still able to see calls into third-party code. -
Ignored
"Ignored" means that filtered classes will be completely removed from the tree.
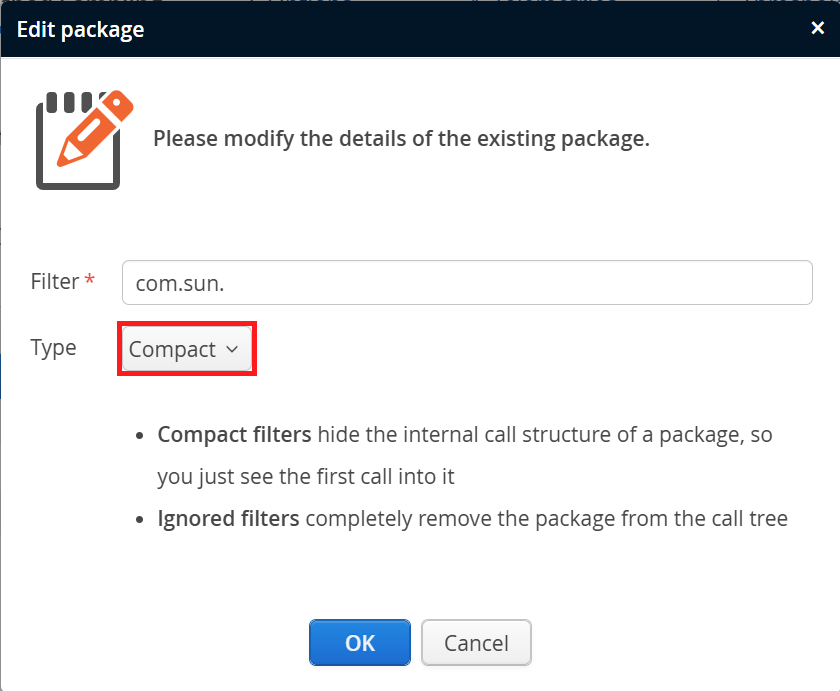
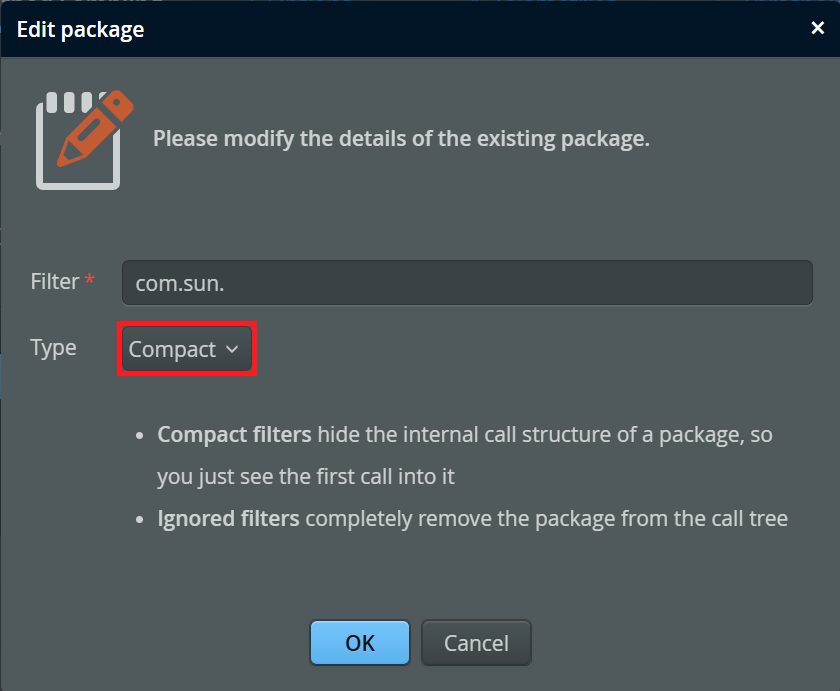
When you add a filter by browsing in archives or connected VMs, it is compact by default. To change its type to "ignored", edit the filter and change the drop-down in the edit dialog.
Method sampling view
To see samples in the method perfino UI, you first have to select a transaction and a policy type. While you can do that with the Choose transaction button, it is usually easier to click the "show methods samples" link next to a transaction in the call tree or hot spots views.
When choosing a transaction manually, changing the selected policy type to something other than "All types" shows the transactions for which a corresponding policy violation has actually recorded at least one sample in the selected period. In the "All types" setting, all transactions in the selected period are shown regardless of whether a sample has been recorded. In that way you can select any transaction and tell perfino to record a sample.
The selected transaction and policy type are shown in the header, and the navigation buttons move between different matching samples. You can use the date chooser to jump to the sample that is closest to a selected time and date.
The sampling call tree shows methods except when sampling crosses a VM boundary. In that case, a VM node is inserted. If you want to limit sampling to the current VM, you can switch off cross-VM sampling in the sampling configuration of the VM group where the transaction is executed.
Where available, the sampling call tree shows line numbers. To interpret a line number, always look at the class of the parent item. Intuitively, you would expect the line number on a method item to show the line number of that method, but that would not be very useful information. The line number cannot be placed directly on the call site, because each call site can have multiple children with different associated line numbers.
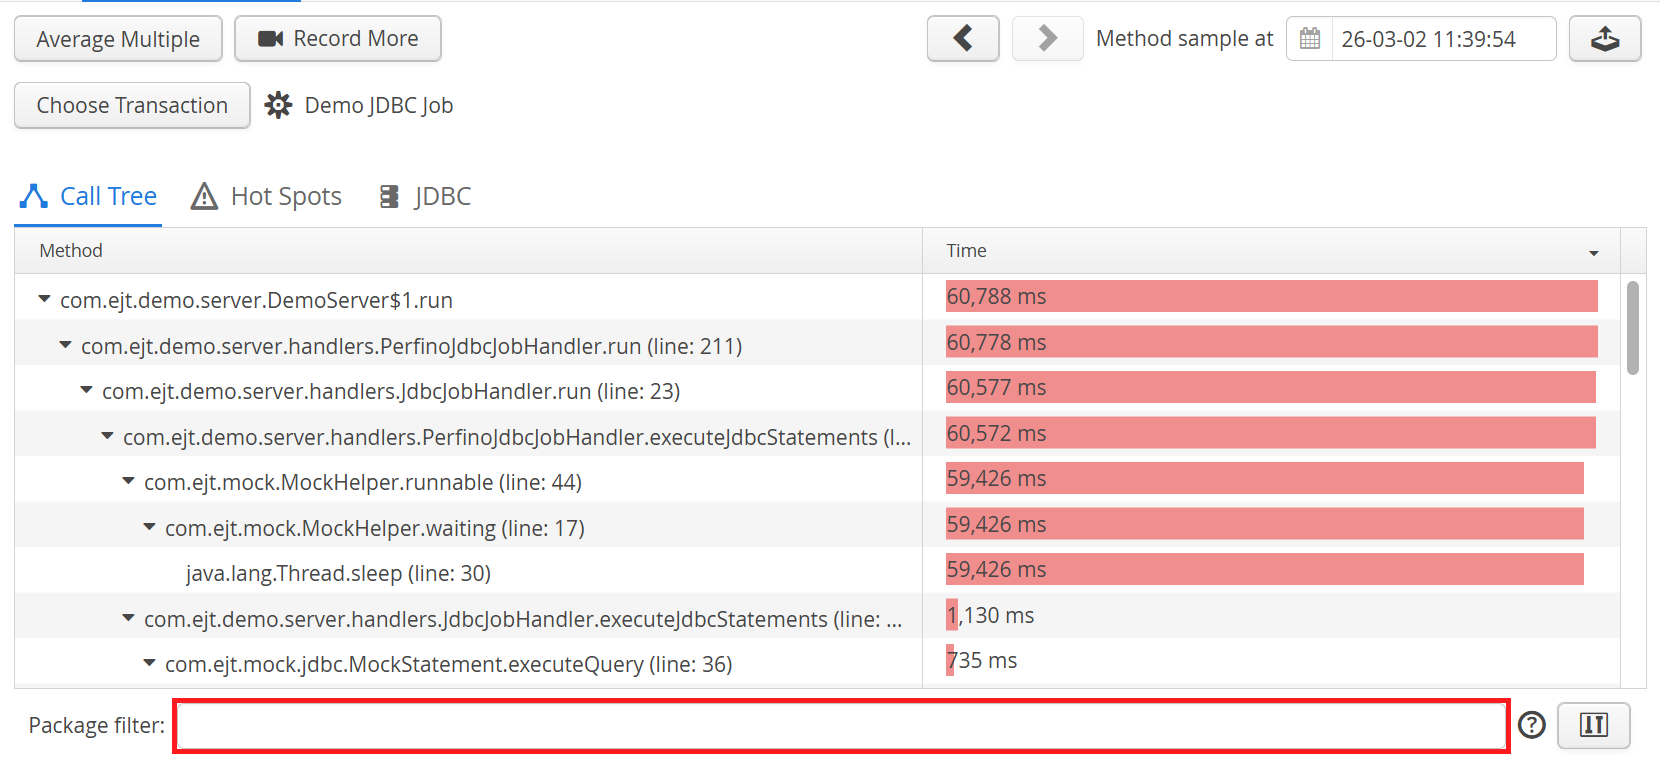
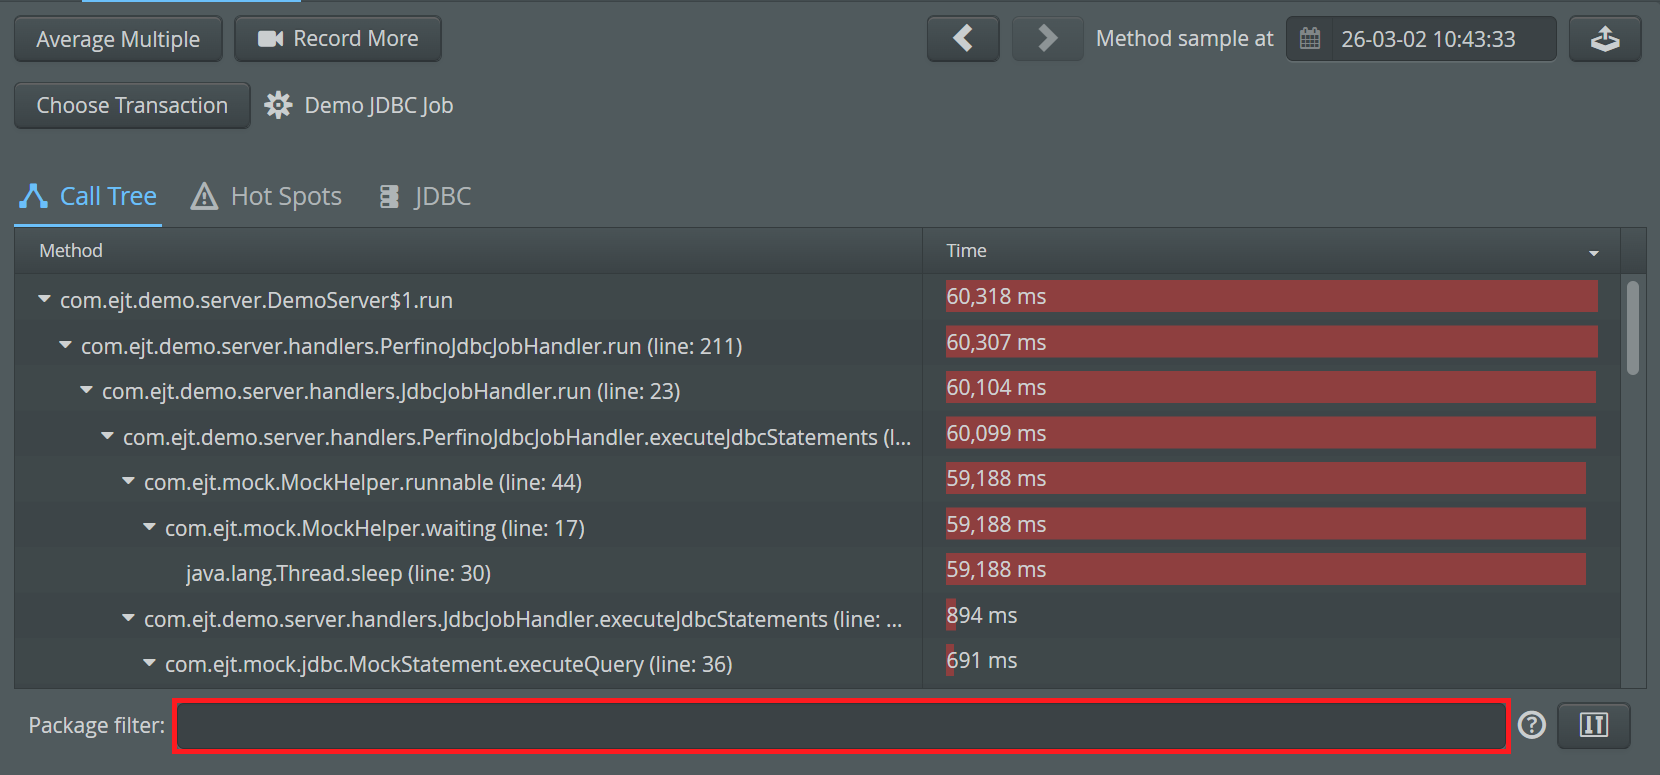
After the initial inspection of a sampling call tree, you will often want to focus on a particular package. Modifying the sampling options to exclude all unwanted packages and re-recording the sample is not a good option, since the package of interest may vary or the performance problem may not be easily repeatable. To adjust your point of view in the sampling call tree, use the package filter at the bottom of the view. You can enter a single package, or a list of packages separated by commas.
Packages are included recursively. This means that if you include com.mycorp., then packages like
com.mycorp.project are included as well. If you want to exclude a particular package,
prefix it with a minus sign. For example, if the classes in com.mycorp. are of interest, but
com.mycorp.algorithm is distracting, enter
com.mycorp.,-com.mycorp.algorithm.
into the filter bar. To better understand the call structure, the first excluded node between included nodes is always shown, so even after excluding a package you might see a few instances of it in the call tree, just not more than two consecutive method calls in such a package. This corresponds to the "Compact" mode for exclusive filters in the "Sampling" configuration step.
If the first package in the filter bar is an exclusion (with a prefixed minus sign), then all other packages will remain visible. If the first package in the filter bar is an inclusion, then all other packages will be hidden.
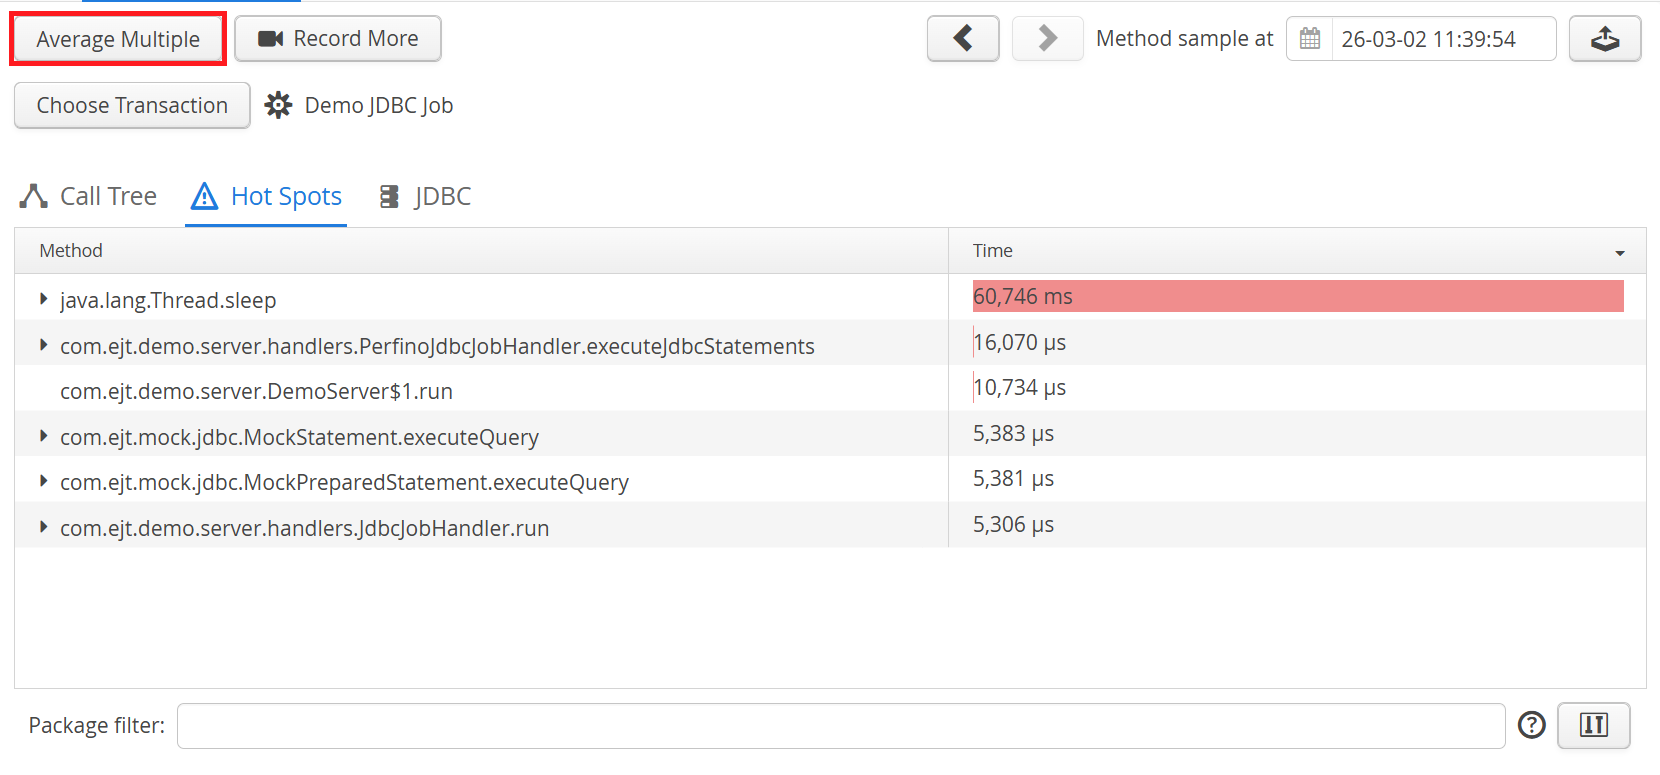
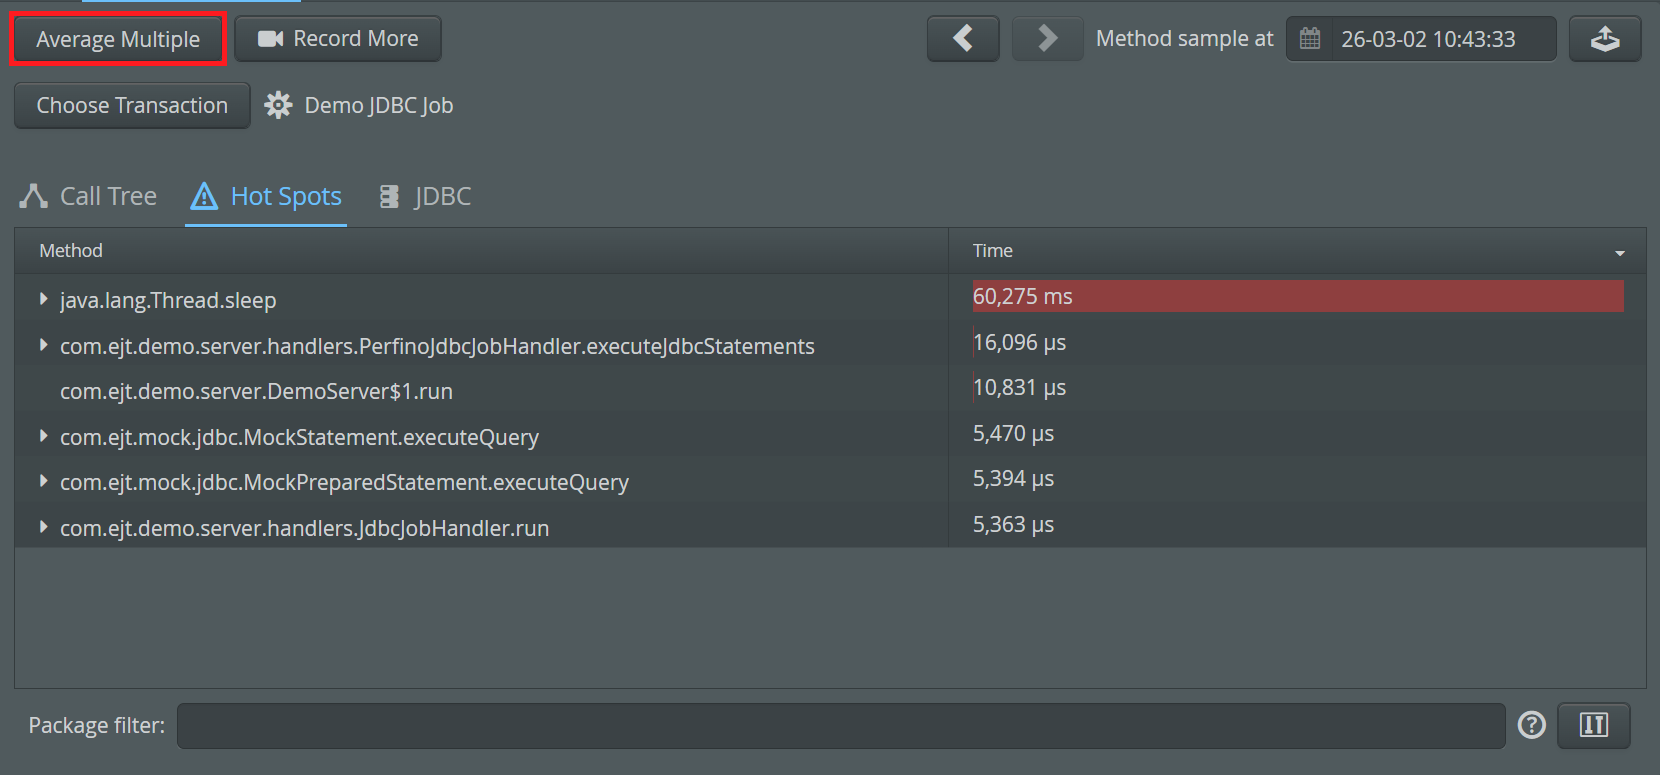
The hot spot tab shows the methods where most time is spent together with cumulated back traces. Note that the set of hot spots strongly depends on the granularity of the measurement which is governed by the defined filters. Defining different filters in the sampling options or applying different view filters may change the list of hot spots completely.
For each probe that recorded data during the sampling period, a separate tab is added that shows the probe hot spots.
Averaging multiple samples
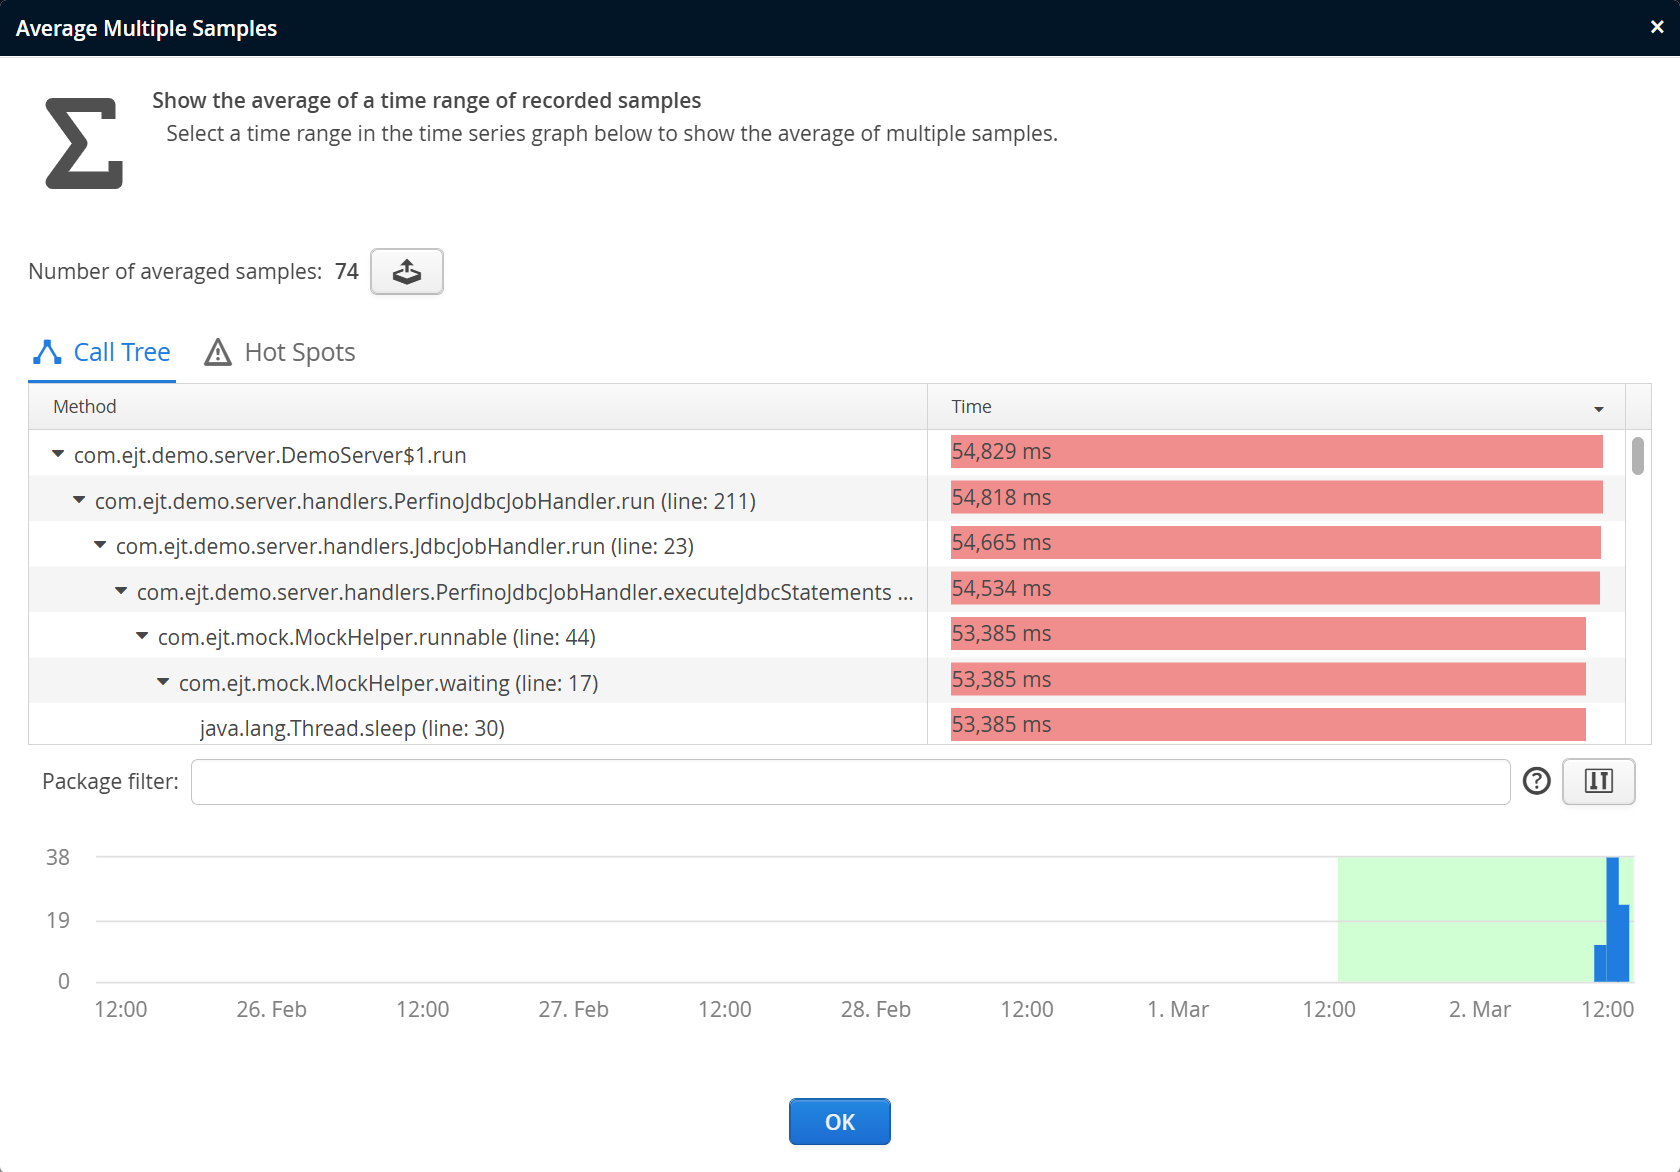
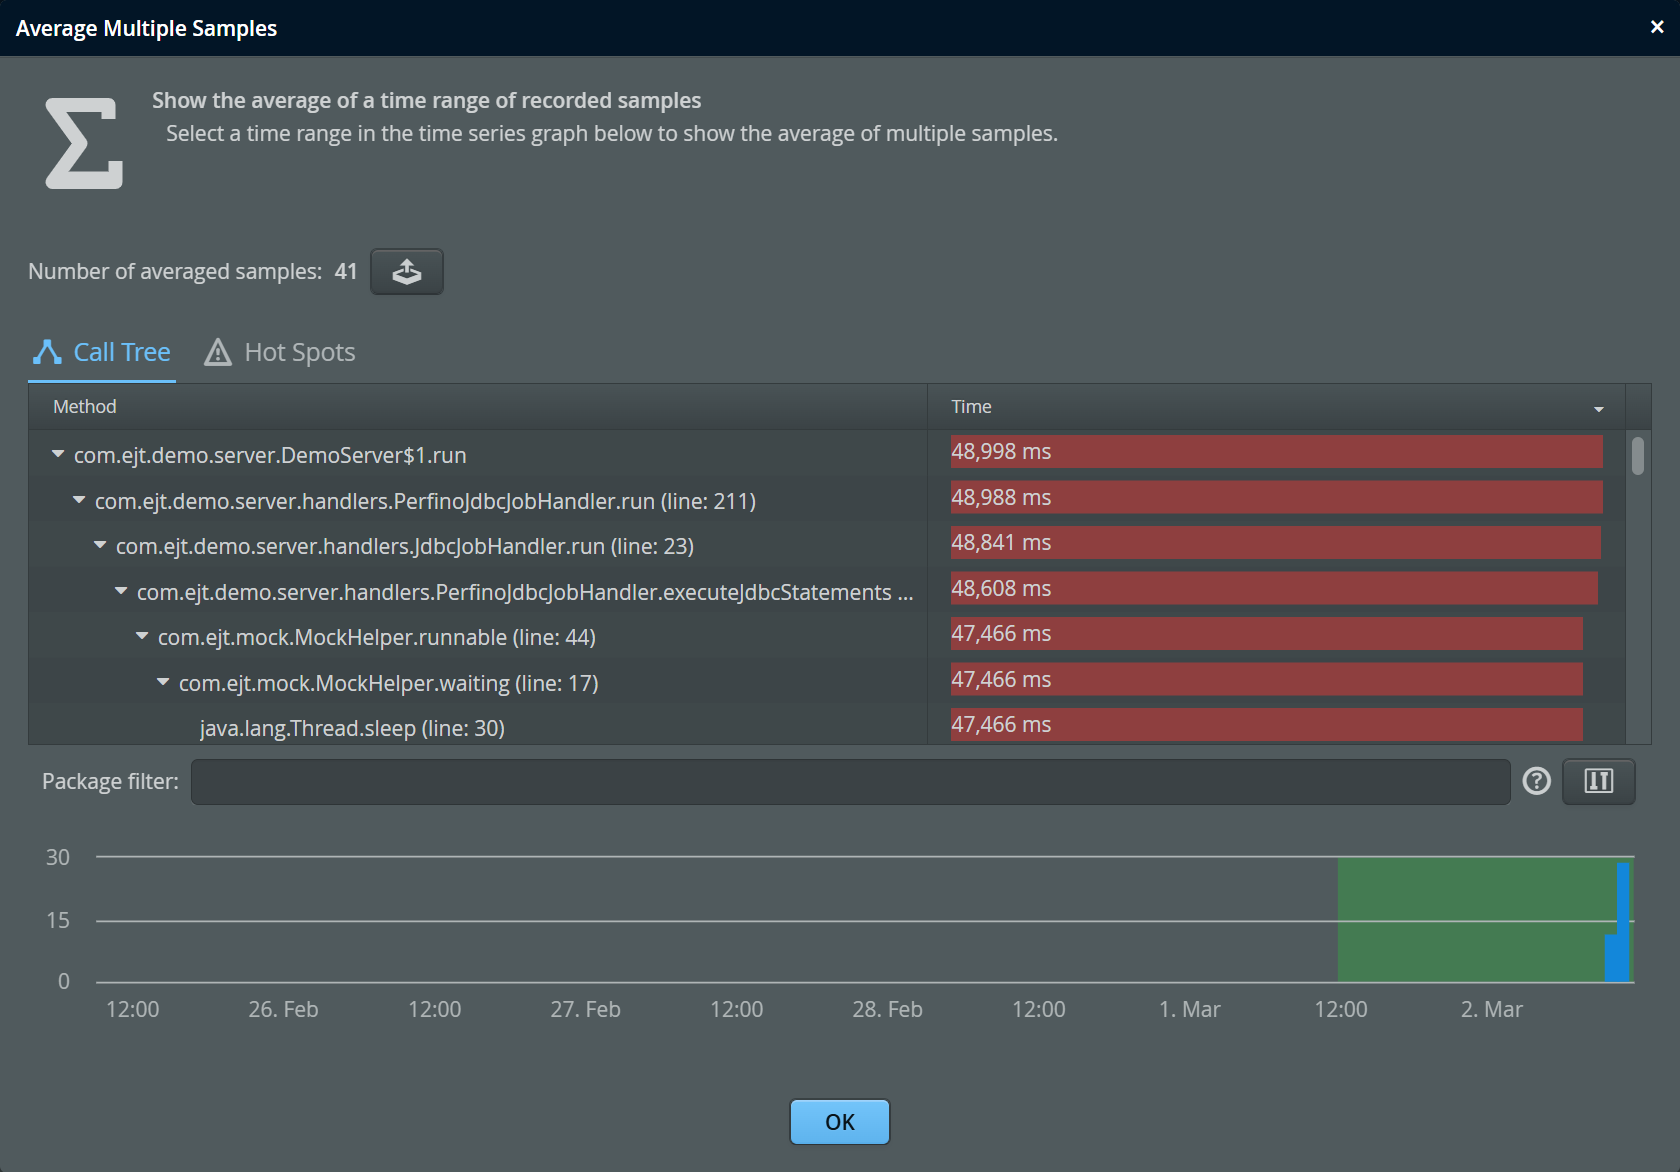
The quality of sampling increases, the longer you sample. Especially for periodic sampling, you collect a large number of comparable samples over time. perfino can average these samples to give you better statistics that come closer to the actual execution times. When you click on the Average Multiple button highlighted in the screen shot above, a modal dialog will be shown where you can select a range of samples to be averaged.
The time line at the bottom shows all available samples. Note that samples are not kept indefinitely due to their high storage space requirements. The retention threshold can be configured in the general settings. By clicking and dragging a range in the timeline, you choose the samples to be averaged. The total selected number of samples is shown at the top.
Just like for the single samples, you can switch between call tree, hot spots and available probe hots.
Manual recording of samples
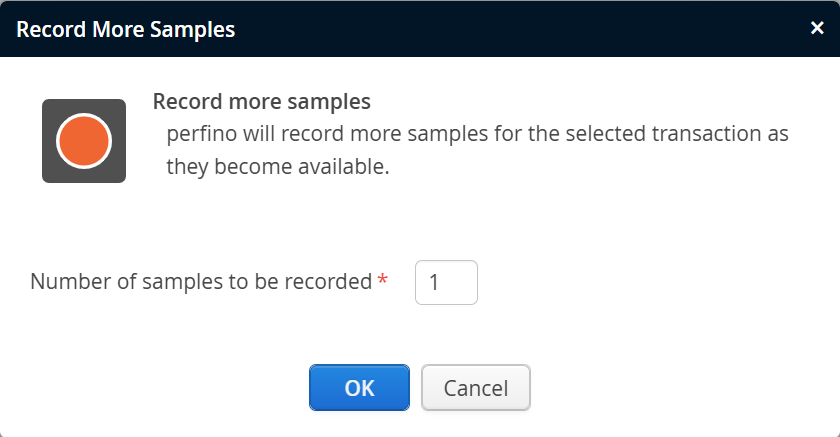
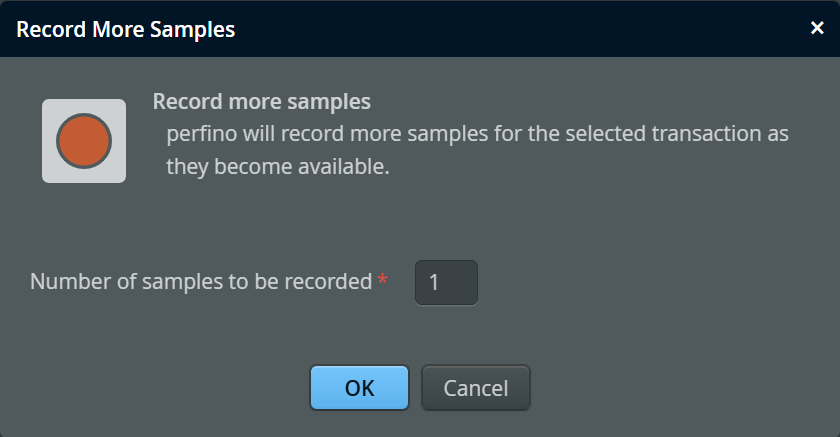
There may be cases where you require a current sample of a particular transaction, and you cannot wait for periodic sampling or a policy violation that would trigger sampling. For that purpose, you can use the Record More button in the method sampling view.
You can even request more than one sample which will allow you to average the samples after they have been recorded. For rarely executed transactions, it may take a long time to fulfil the recording request.