Transactions typically use external resources that are often the cause for performance problems. The most prominent example is JDBC. Just looking at the name of a slow transaction may not generate any insight. However, if you can see the SQL statement that is responsible for most of the time, you can often find the cause of the slowness right away.
perfino records this kind of data with probes. Probes generate payload data that is attached to the currently running transaction. If no transaction is running, the data is discarded.
Configuration
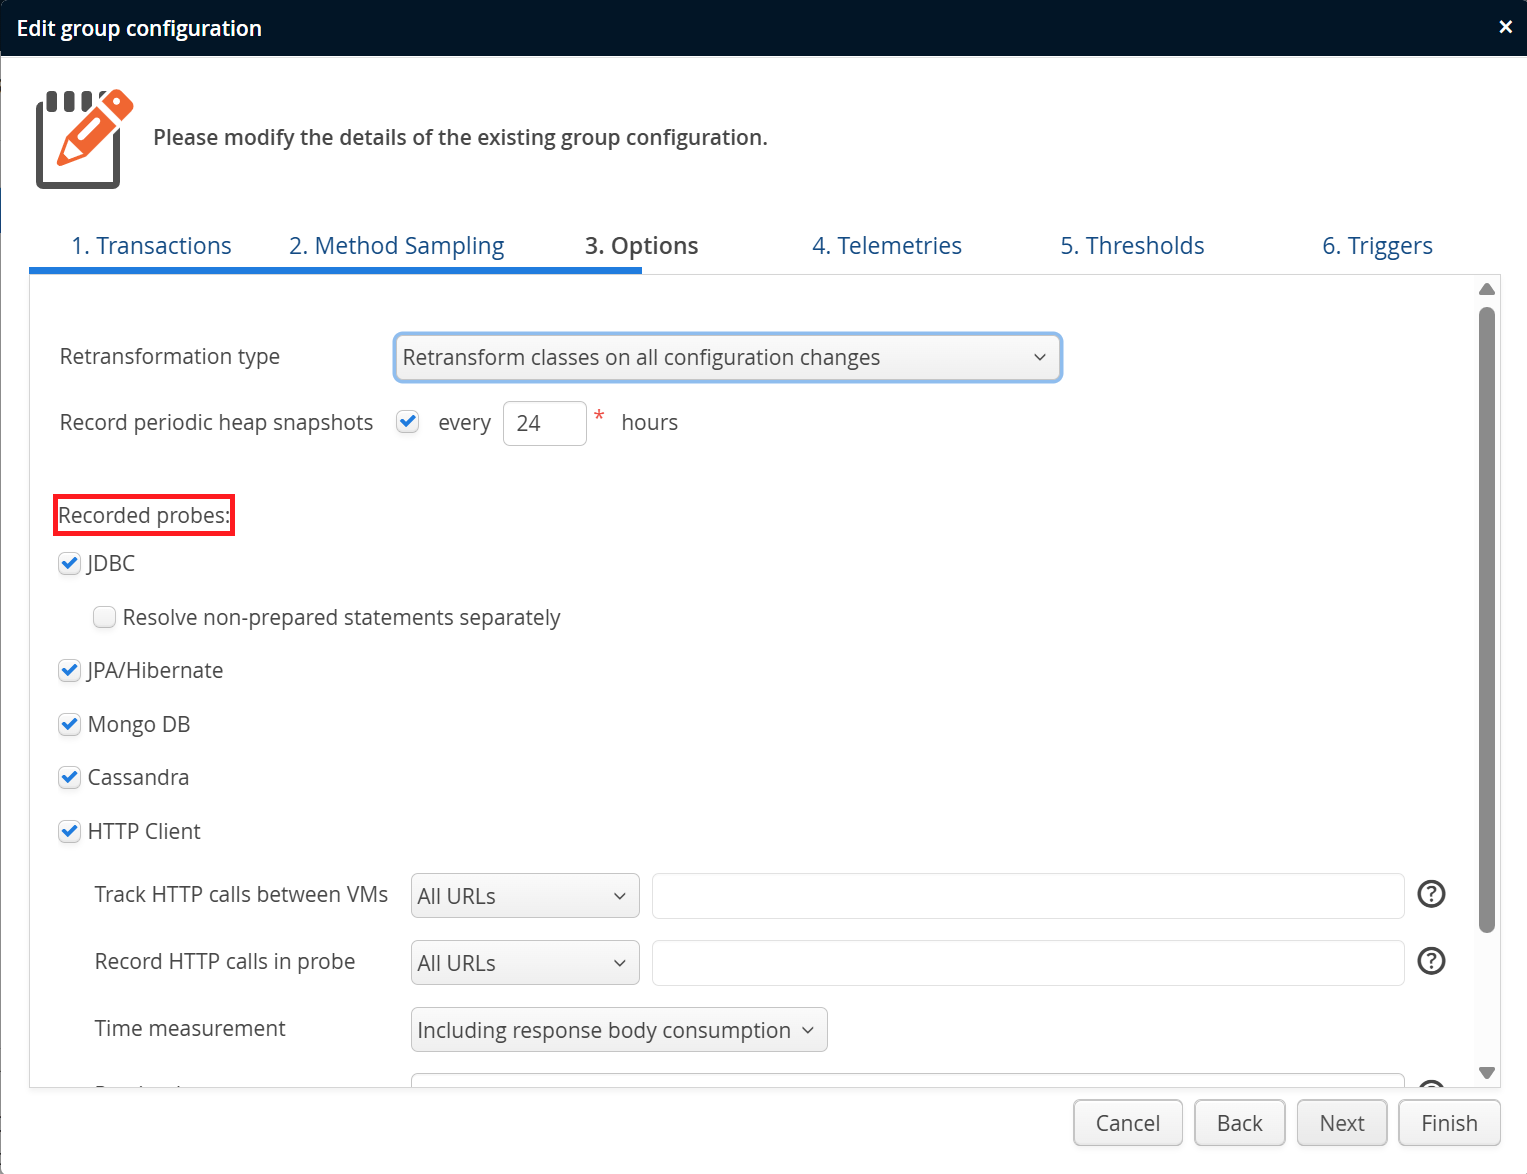
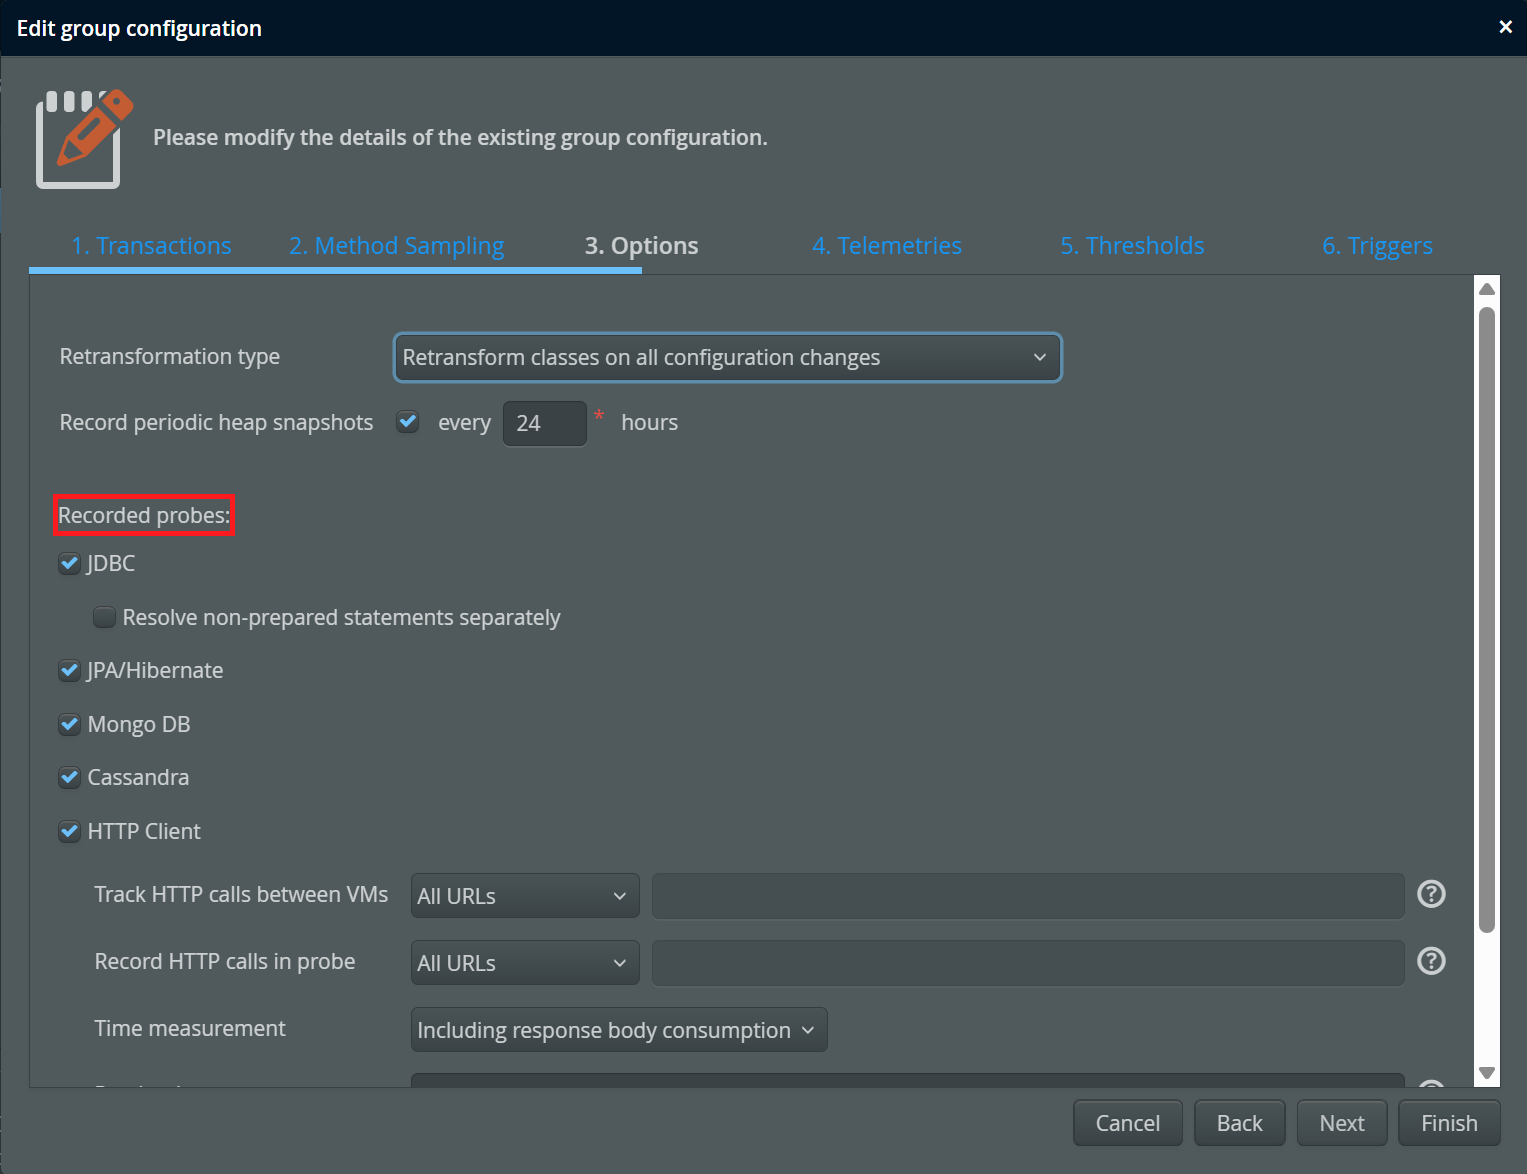
To see the list of available probes, you can edit the recording settings of a VM group and go to the "Options" step. Most of the probes are for databases or messaging systems. You can switch off subsystems that you are not interested in. For example, if you use JPA, but do not want the overhead of measuring the duration of JPA calls, you can deselect the "JPA/Hibernate" check box.
Probes in the call tree
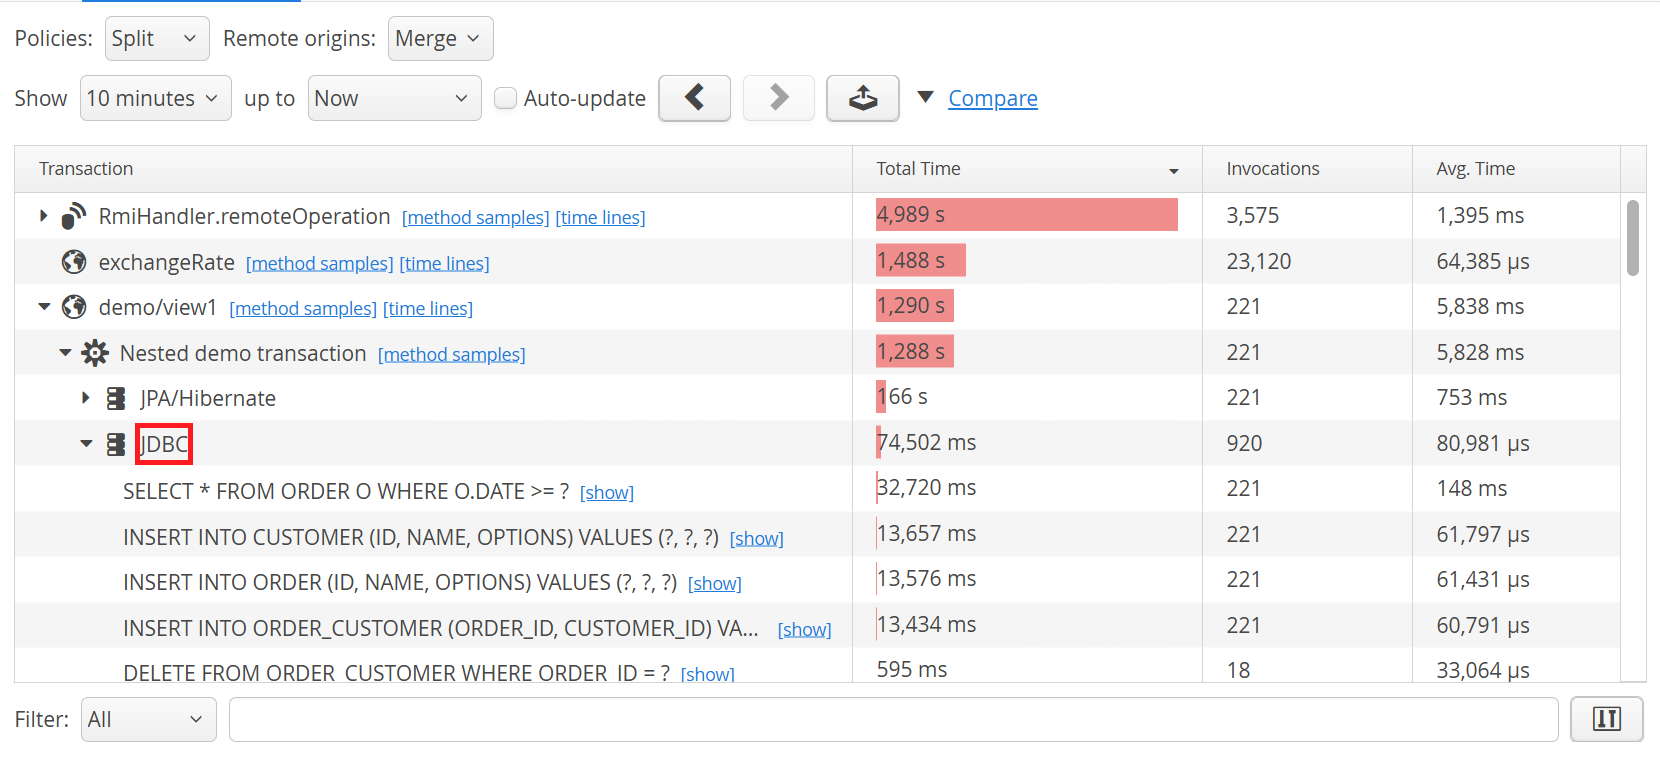
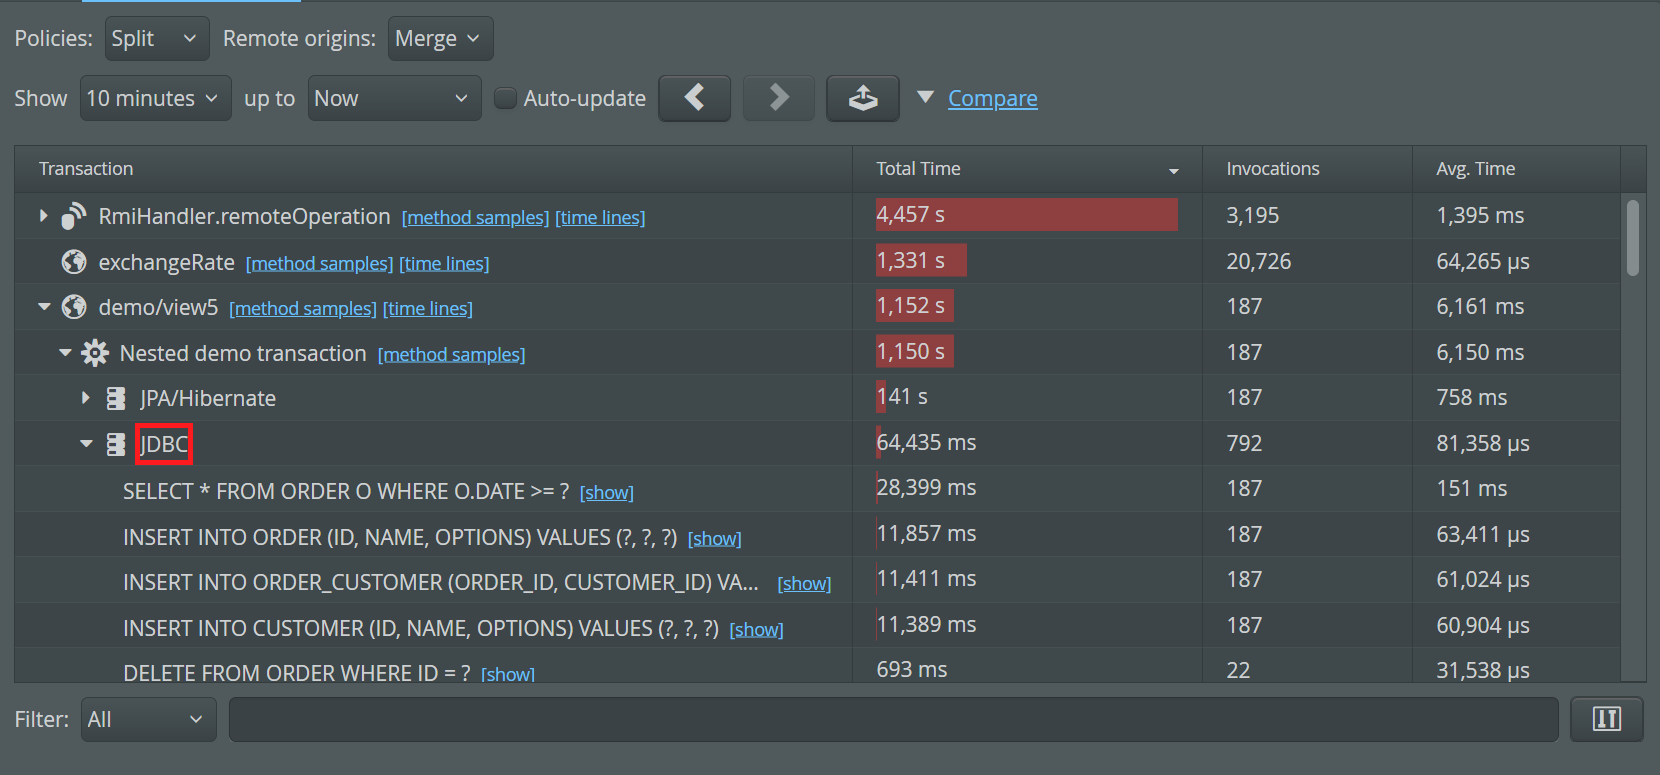
Every transaction that performs an operation measured by a probe shows this information as child nodes in the call tree. Each probe type has a separate grouping node with the name of the probe.
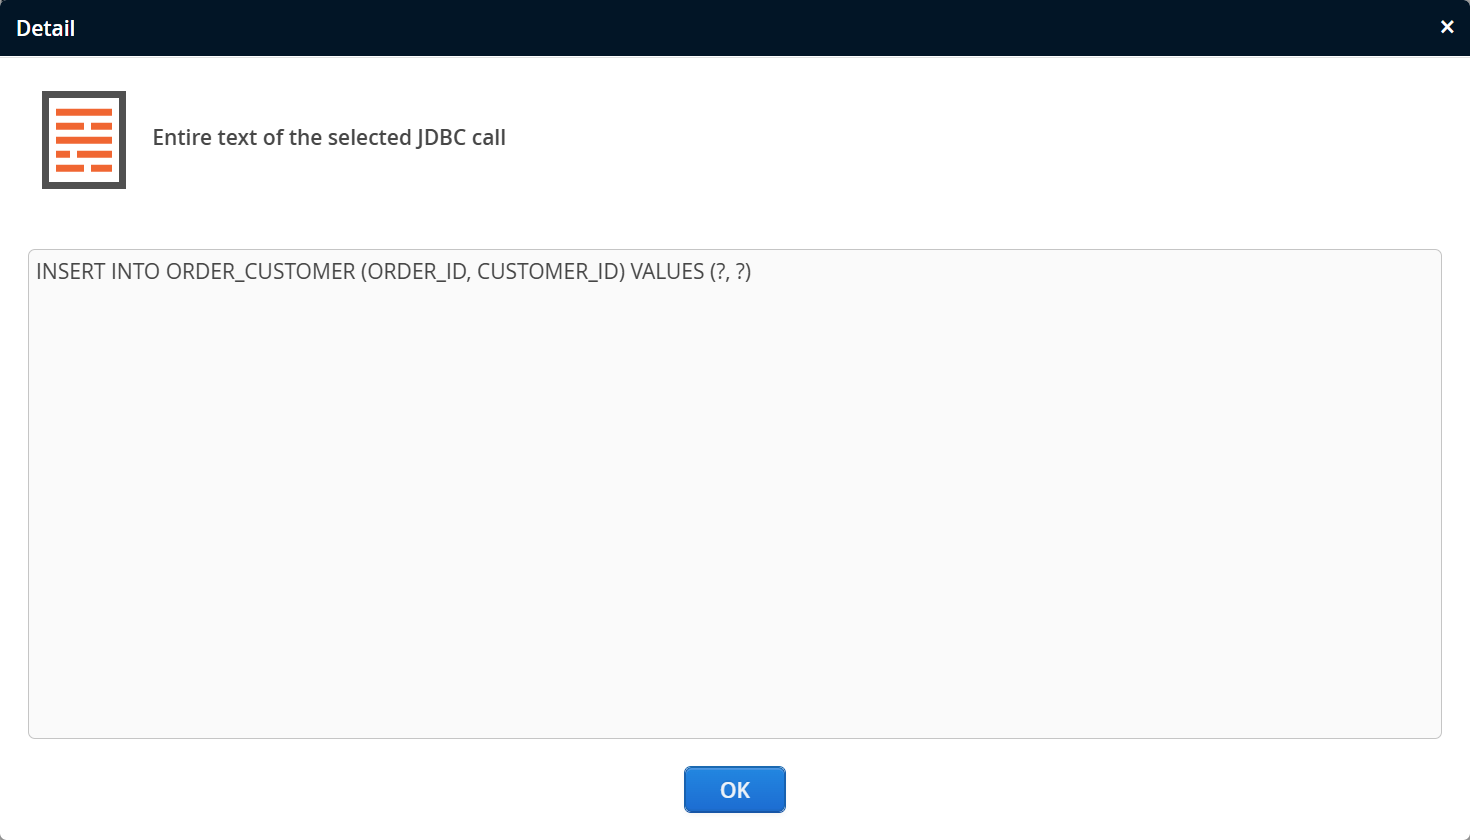
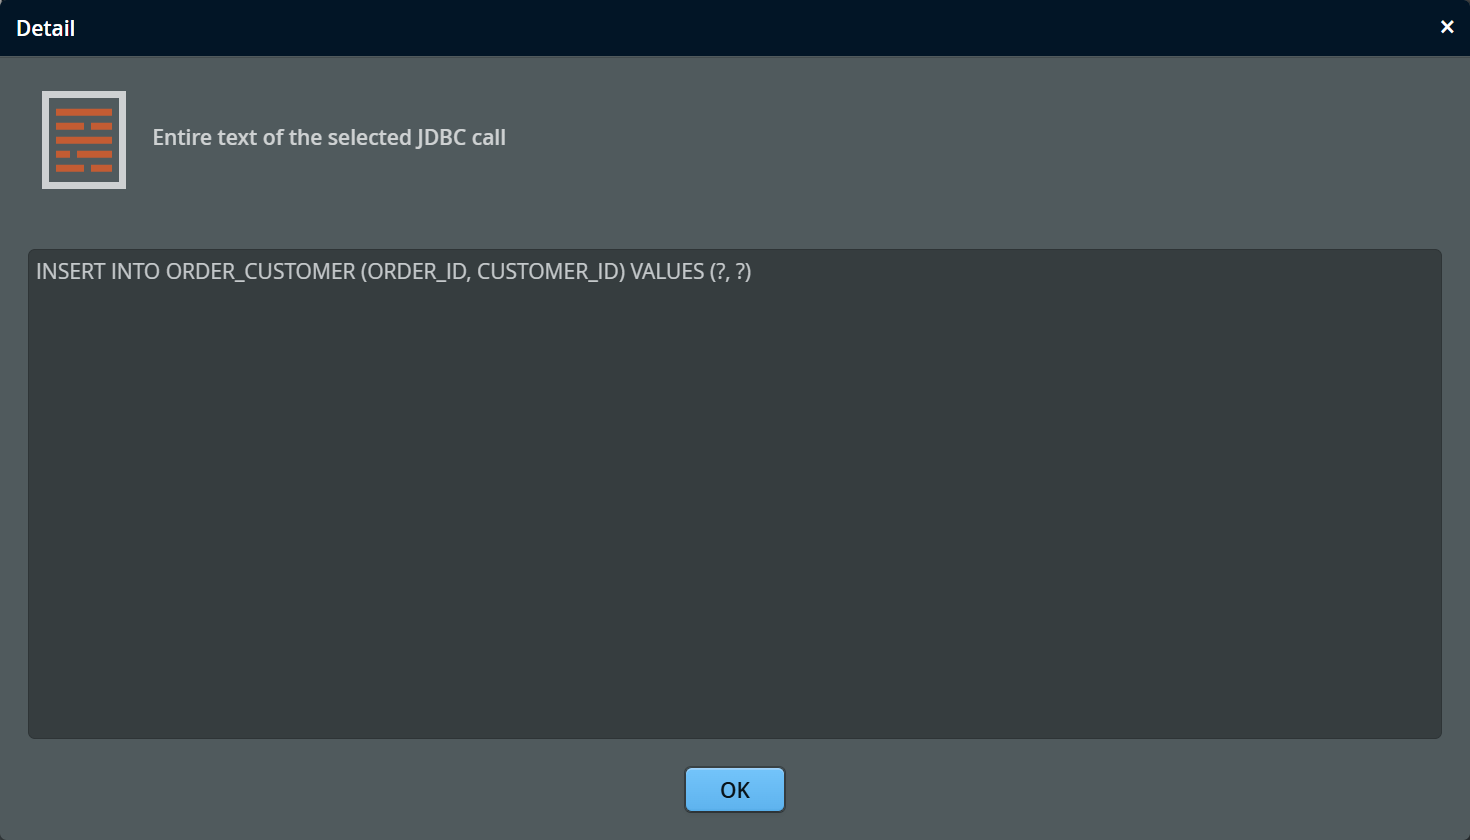
Often, the description of the operation is very long, like a complex SQL statement with many output fields, joins and conditions, and the finite length of the table column prevents further inspection. In this case, click the "show" link in the same table tell. A dialog will be shown, where you can scroll through the payload data and copy it to the clipboard.
Probe hot spots
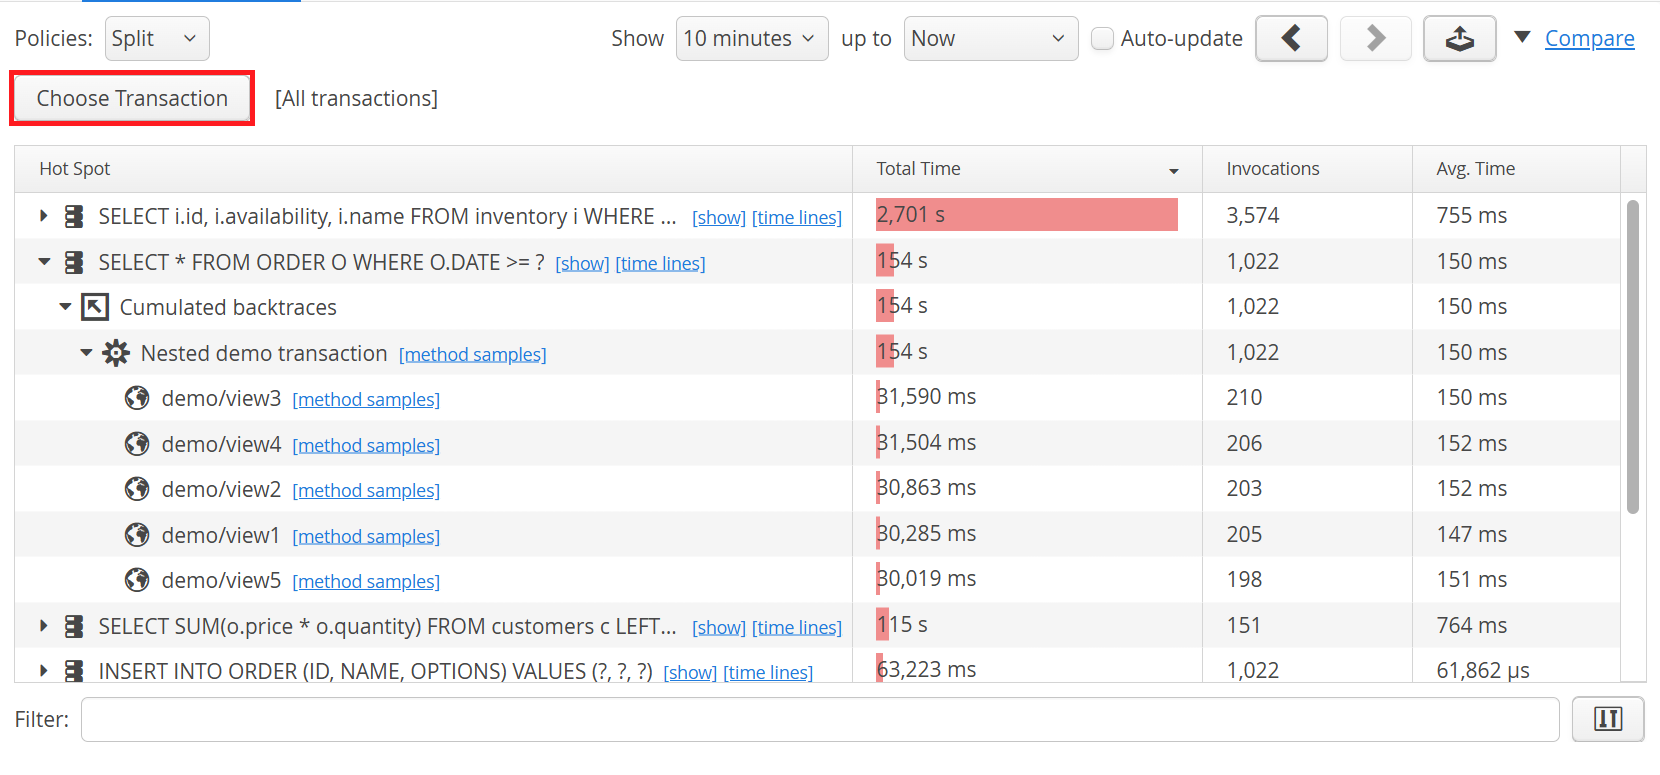
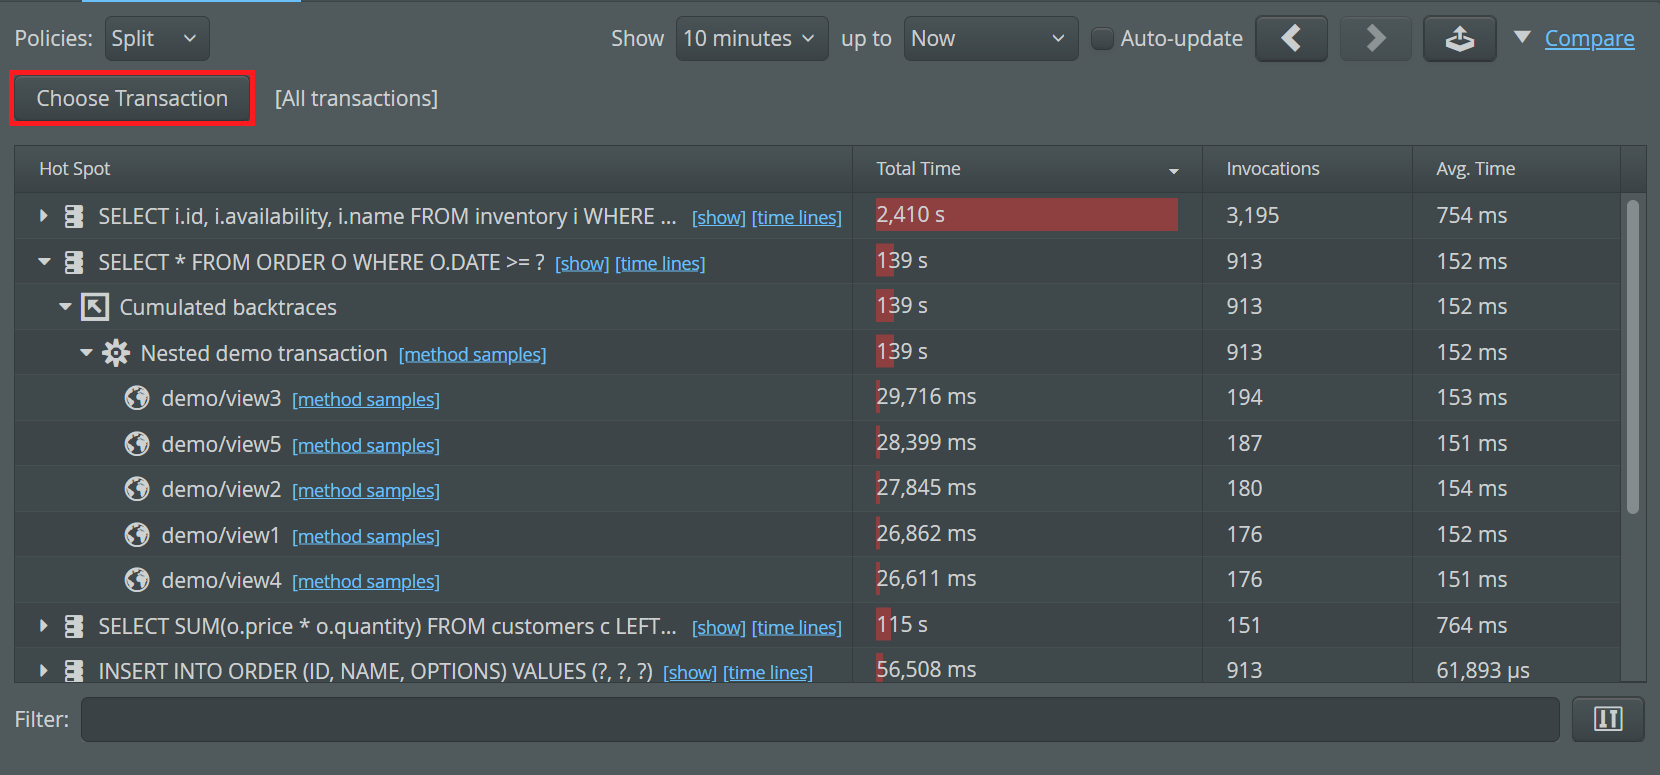
Sometimes your focus is not on transactions, but on the probe data. For example, when trying to speed up your database, the question is: What are my slowest database operations? For that purpose, perfino offers the probe hot spot views. Each probe has a separate view of this kind where a list of operations is shown together with cumulated backtraces.
The probe hot spots view can be filtered on a per-transaction basis. By default, cumulated data for all transactions in the selected time interval is shown. When clicking on the Choose transaction button, you can select one transaction from which the probe hot spots should be taken.
Probe data granularity
Probe operations can be extremely frequent, and they usually don't do the same thing over and over again. perfino makes an effort to modify the displayed name of a probe so that frequently varying information is replaced with placeholders. Imagine a loop of SQL queries where an ID varies in each statement. Showing the raw SQL in the UI would mean that perfino would potentially have to remember millions of SQL statements per hour.
This is why perfino by default does not show SQL for JDBC statements that have been created with the
createStatement(...) method. Rather, perfino shows those operations with a description of
"unprepared select statement". SQL is only shown for prepared statements without resolving the single
parameters. If you do not use prepared statements and need to see more detail, the "Resolve non-prepared
statements separately" option in the probe configuration enables SQL recording for all unprepared statements.
Perfino will then try to replace literals in the SQL string with a placeholder to limit the maximum number
of distinct SQL statements.
These considerations only apply to the call tree where data is retained indefinitely at the highest consolidation level. For sampling, where data is discarded in the medium term, perfino always records the SQL of unprepared statements.
The same strategy with respect to data granularity is used for other databases. For example, in MongoDB operations, all values are replaced with question marks.
Overload protection
Under some circumstances, the number of distinct payload strings can grow linearly with time, for example, if the prepared statement bodies contain IDs directly and not as bound variables or if the literal replacement of unprepared SQL statements fails. Too many different payload strings would overwhelm the system over time and so perfino's overload protection mechanism caps probe payload strings at a configurable maximum number.