One of perfino's core features is the ability to track calls between monitored VMs. No configuration is necessary to enable cross-VM monitoring. As soon as an outgoing and incoming call of a supported subsystem can be matched between two monitored VMs, perfino shows it as a remote call in the call graph and in the call tree.
The following remote call mechanisms are supported:
- RMI
- Web services: JAX-WS-RI, Apache Axis2 and Apache CXF
- Remote EJB calls: JBoss 7.1+ and Weblogic 11+
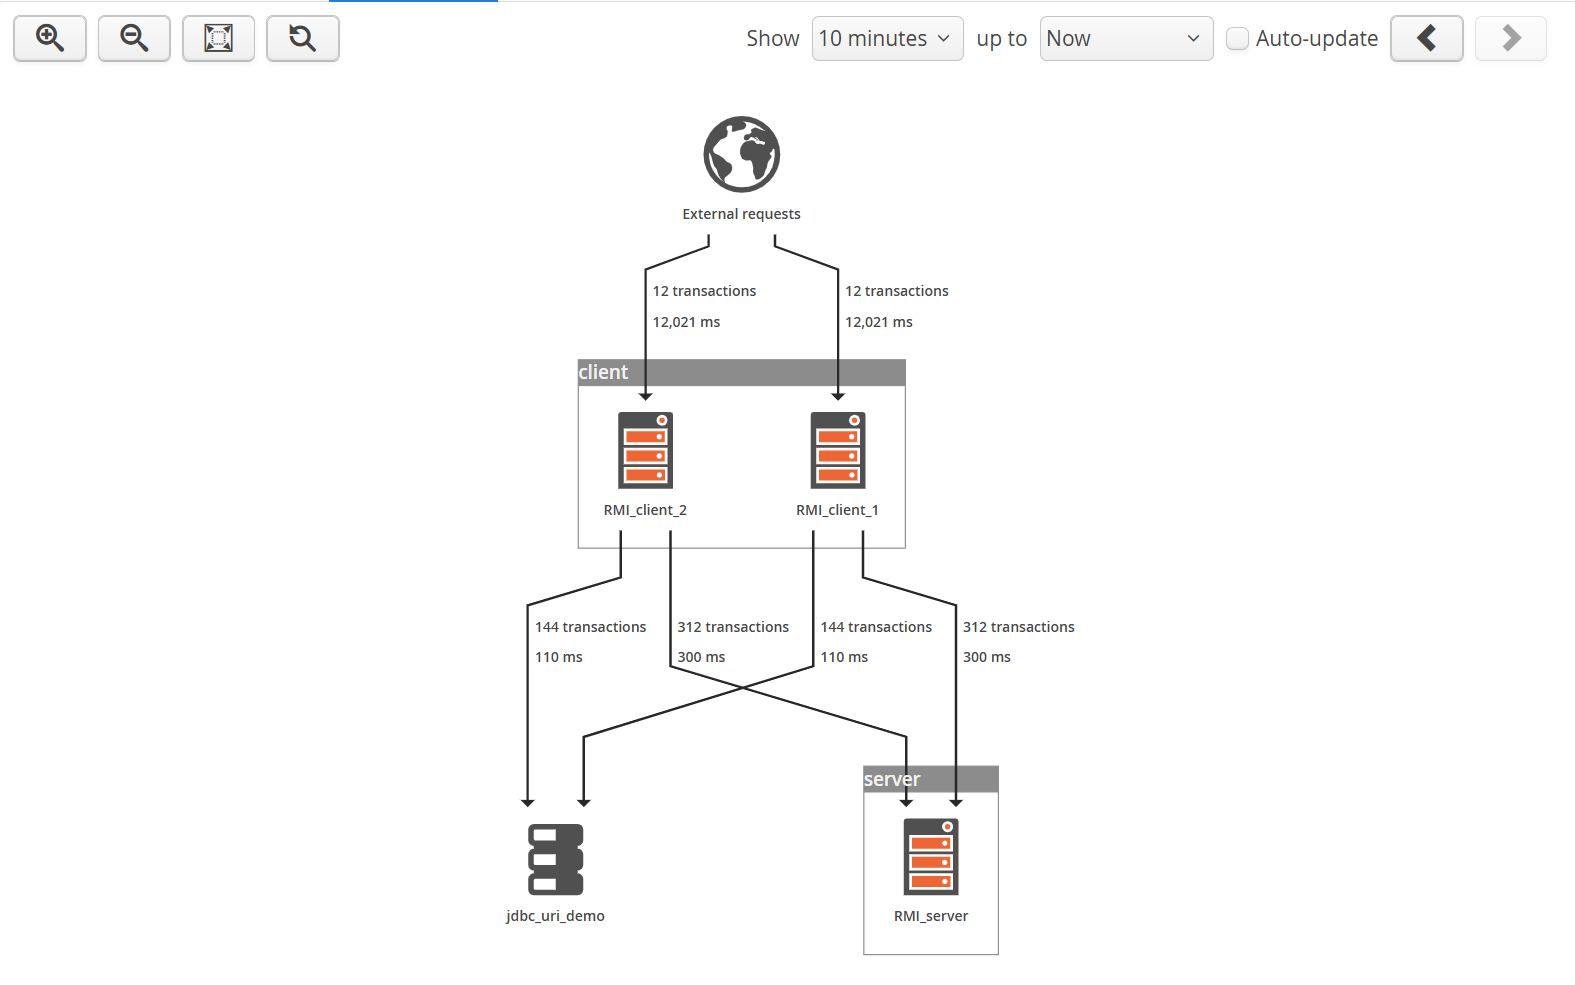
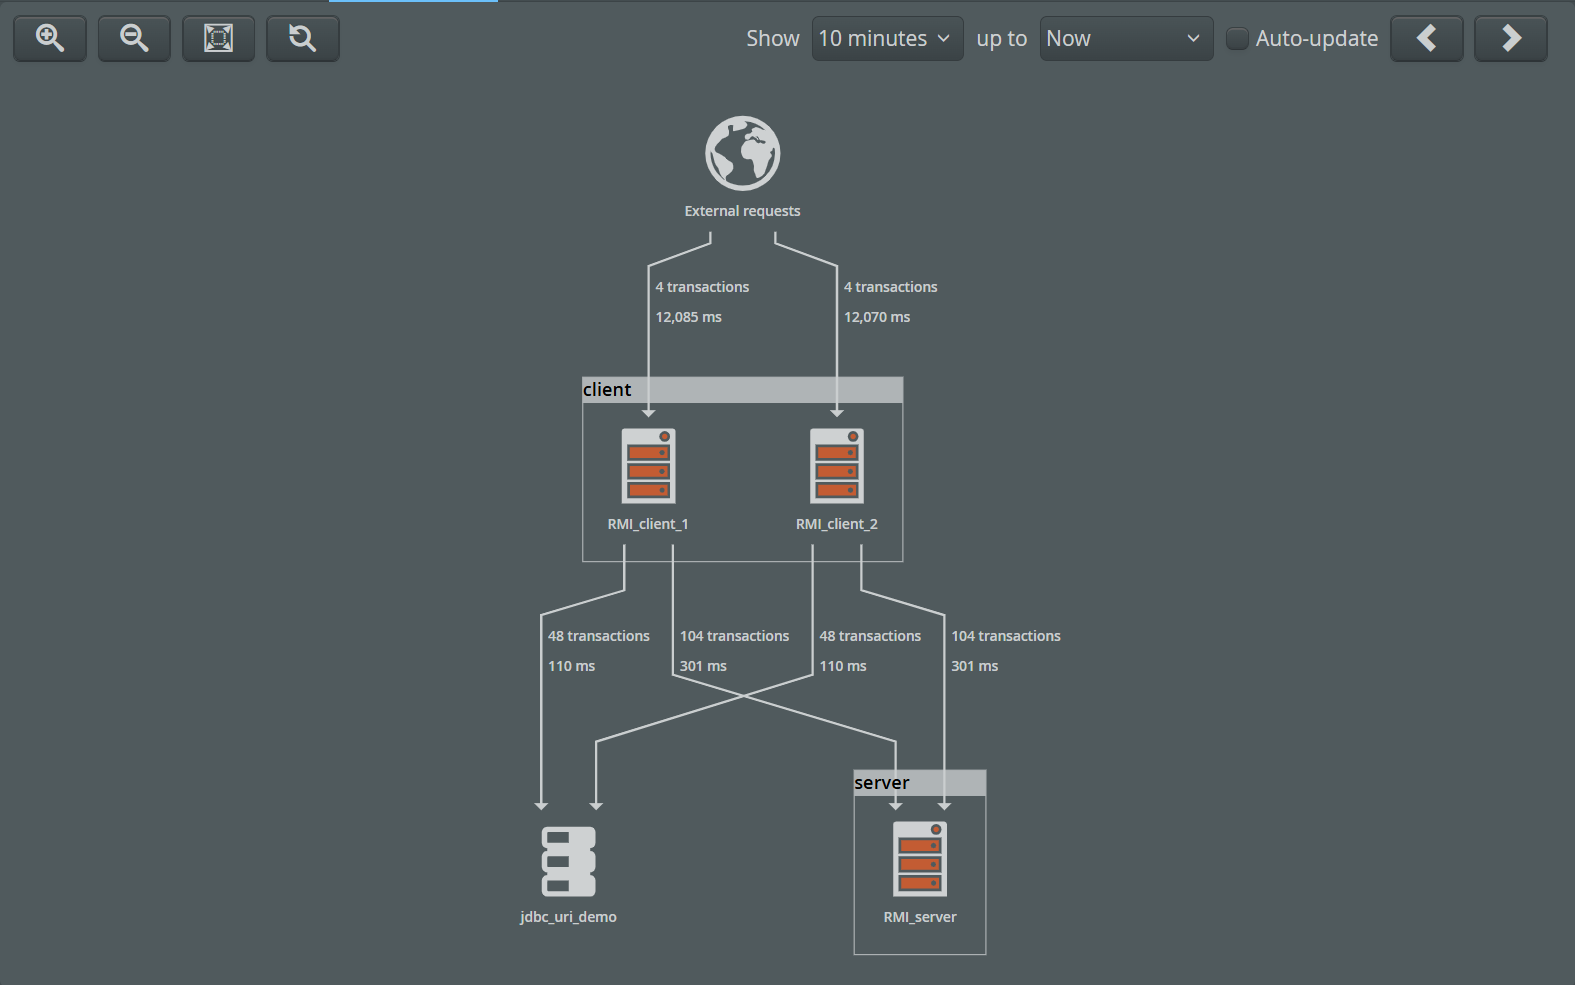
Call graph
The natural representation for remote calls is the call graph, where each pair of VMs that participate in a remote call are connected by an edge. In addition, two other node types are present in the call graph that usually represent calls to and from external processes:
-
External calls
The "world" node shows external calls that create transactions in monitored VMs, such as URL invocations. -
Databases
Database nodes show database operations. If perfino detects that two VMs are using the same physical database, it only shows a single node in the call graph.
When a node or an edge is selected in the call graph, a detail panel is shown that holds several tabs with information about the associated transactions. The number and names of the tabs depend on the selected object:
-
External calls node
The only tab is the "Transactions" tab which shows the call tree of all transactions with external origin. Transactions are only shown in the first neighbor nodes, not across the whole graph. -
Database node
The only tab tab is the "Remote origin hot spots" tab which shows the database operations with cumulated backtraces. To restrict displayed data to a particular VM, select an incoming edge instead. -
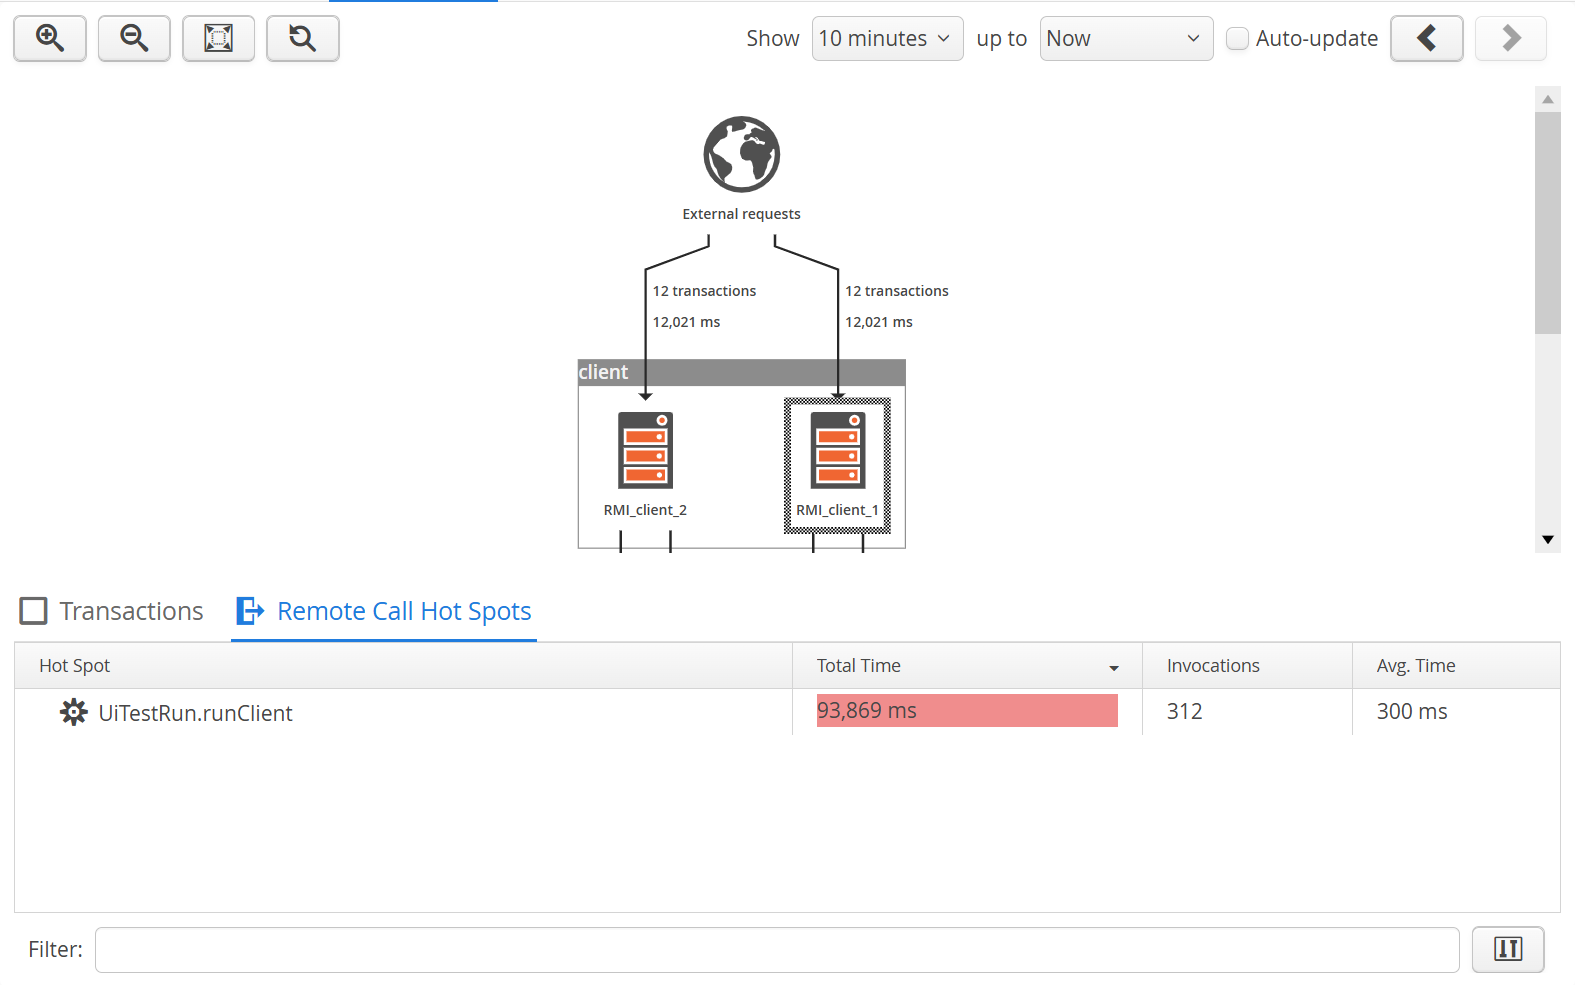
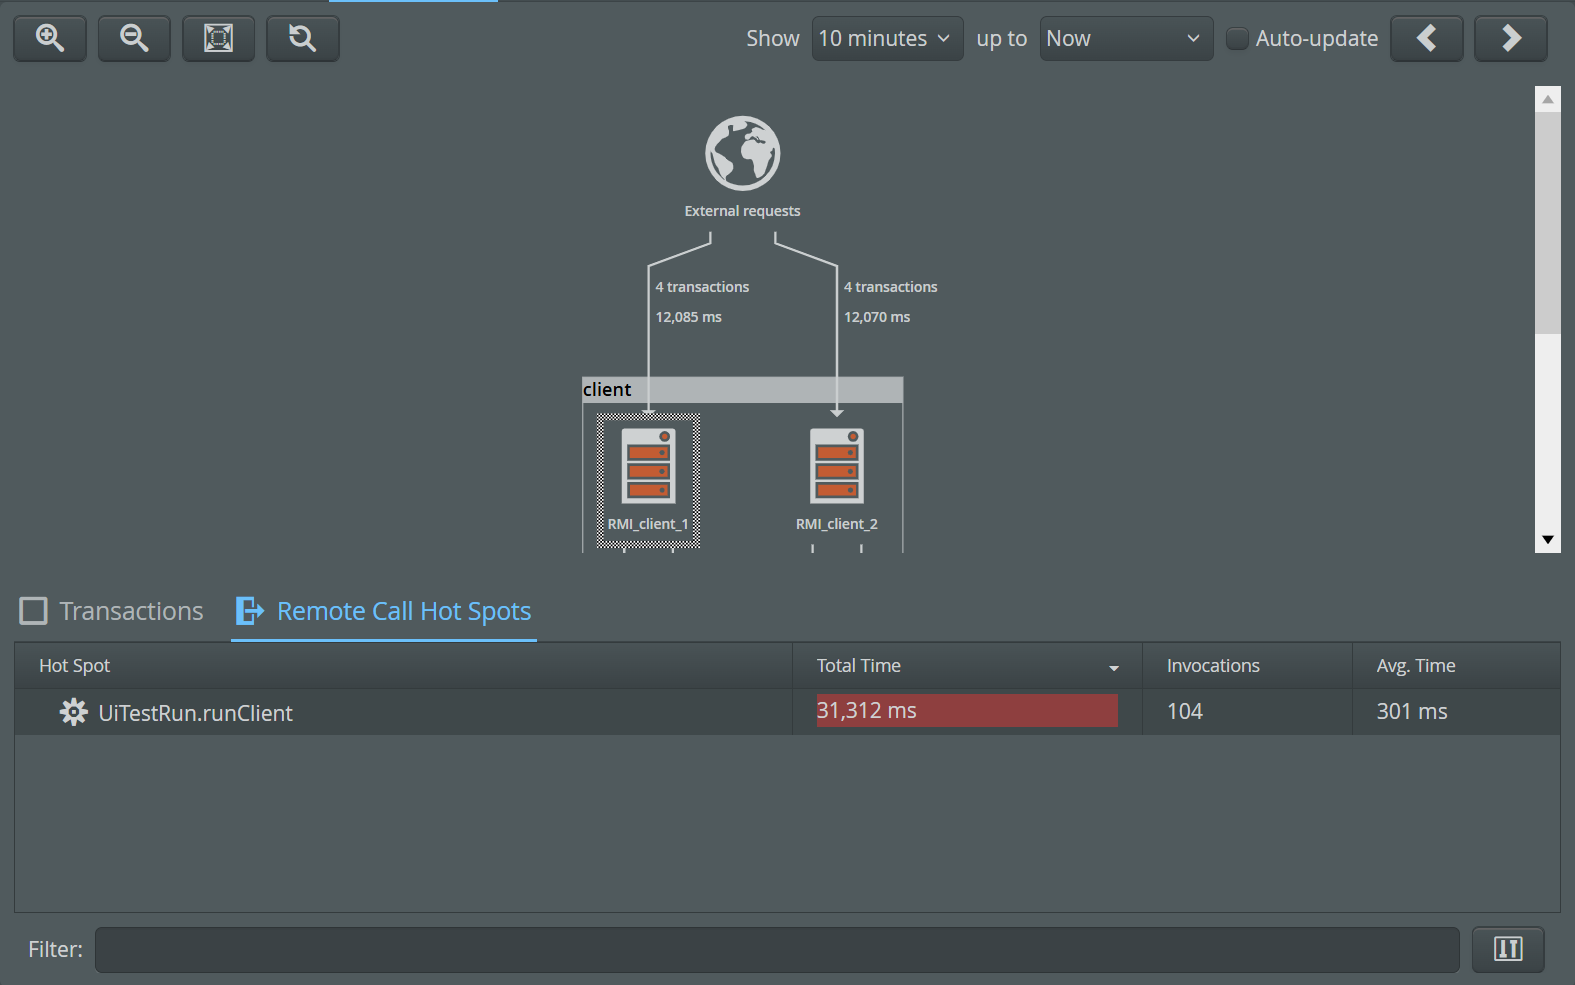
VM node
The "Remote origin hot spots" tab shows the duration and count of handled remote calls mapped to the originating transactions from other monitored VMs. Backtraces are resolved up to the leaves that specify the VMs where the calls originated. The "Transactions" tab shows the call tree of all transactions executed in the selected VM. Finally, the "Remote call hot spots" tab shows the duration and count of remote calls originating in the selected VM. The top-level hot spots are the transactions that cause the jump into a different monitored VM. Check the outgoing edges to learn more about those calls. -
Edge
The "Call site hot spots" tab shows which transactions in the source node caused remote calls along the selected edge together with cumulated backtraces. For edges into "Database" nodes, this is the only tab and shows database operations instead of transactions. The "Execution sites" tab shows the call tree of the transactions that were caused by the selected edge. For edges starting at the "External calls" node, this is the only tab.
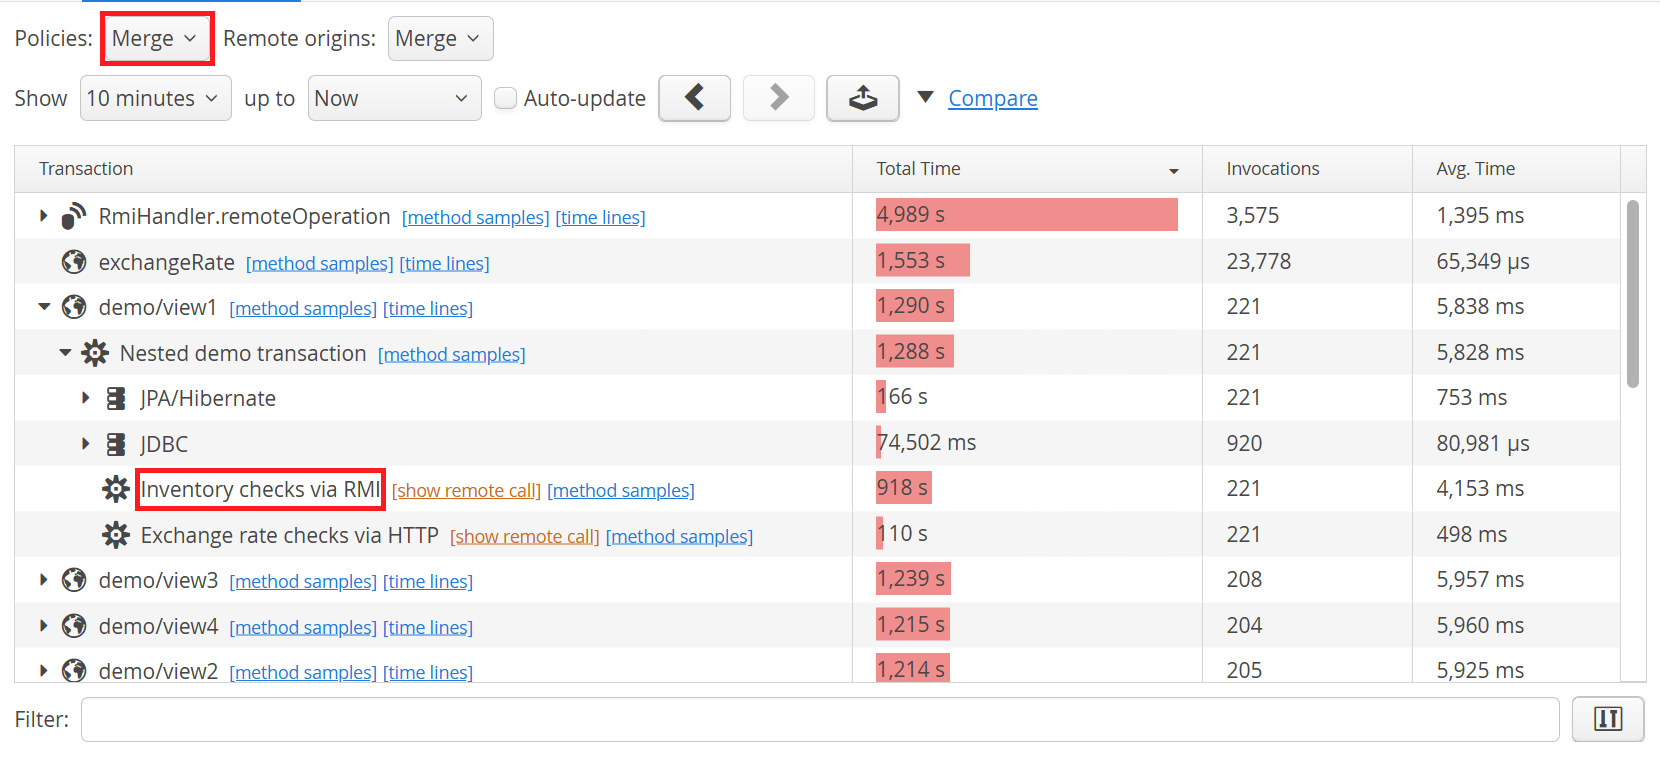
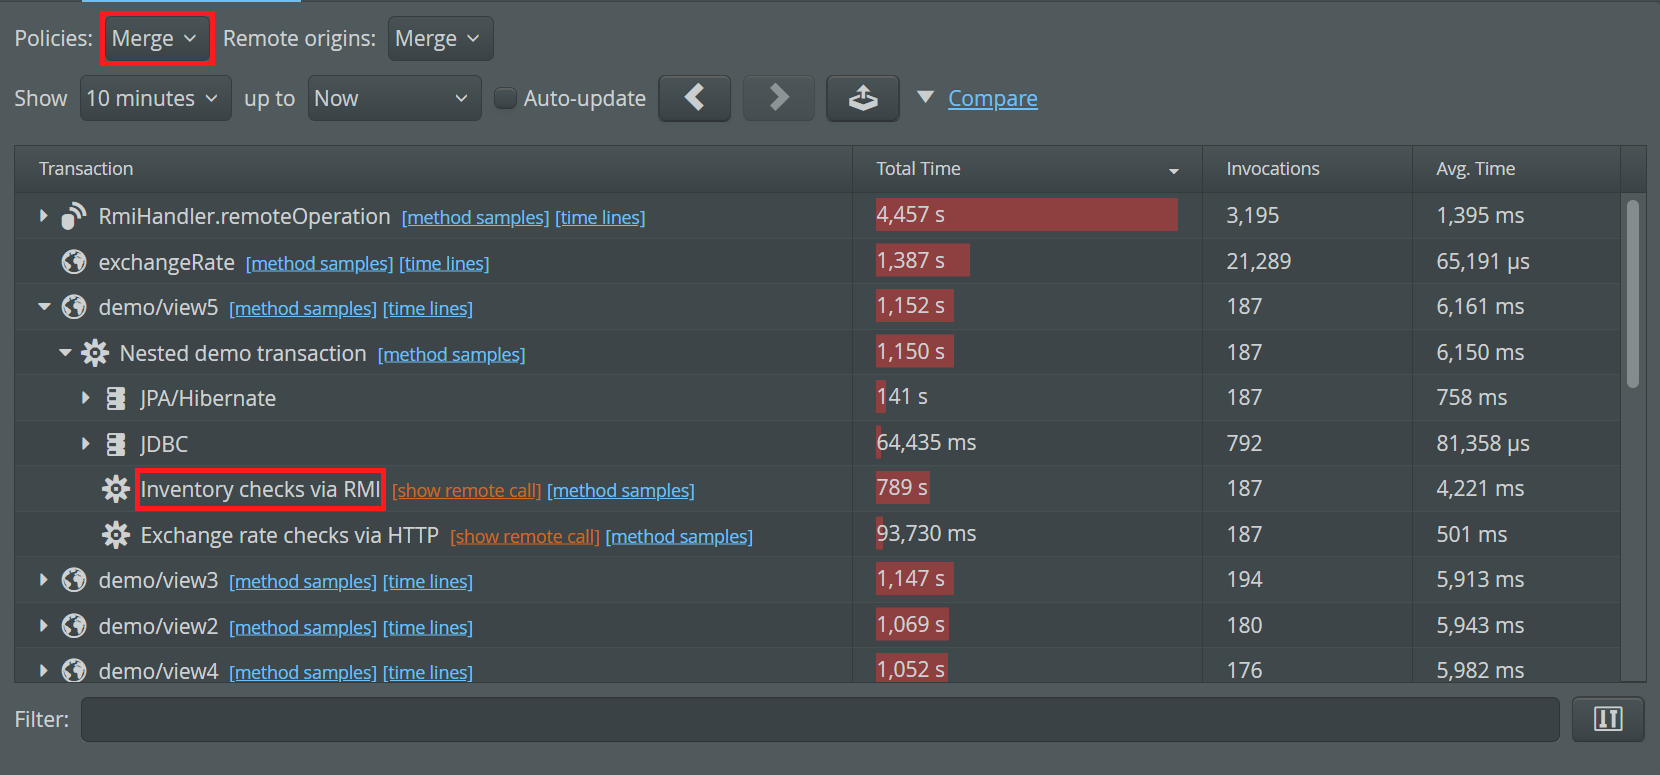
Call tree
In the call tree, you can recognize transactions that cause a remote call by the "show remote call" link that is shown next to the transaction name. When following such a link, it is advisable to select the "Merge" option for the policy split, otherwise the numbers on the remote side may not match the numbers in the source VM. This is because policy splitting is not tracked across VMs. In any case, there may be small discrepancies due to calls that are close to period boundaries which may be assigned differently by source and target VMs.
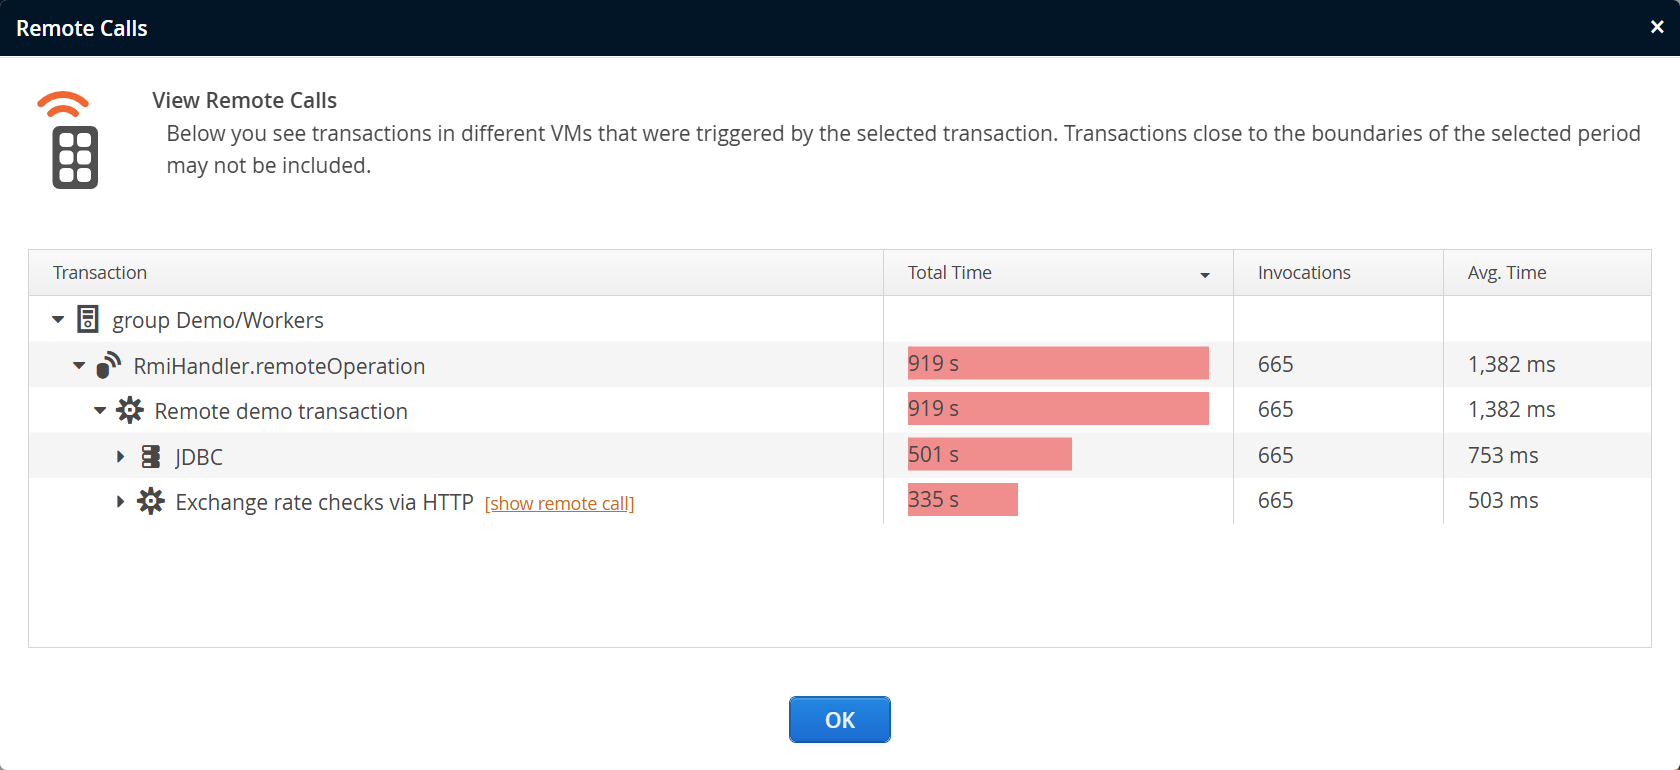
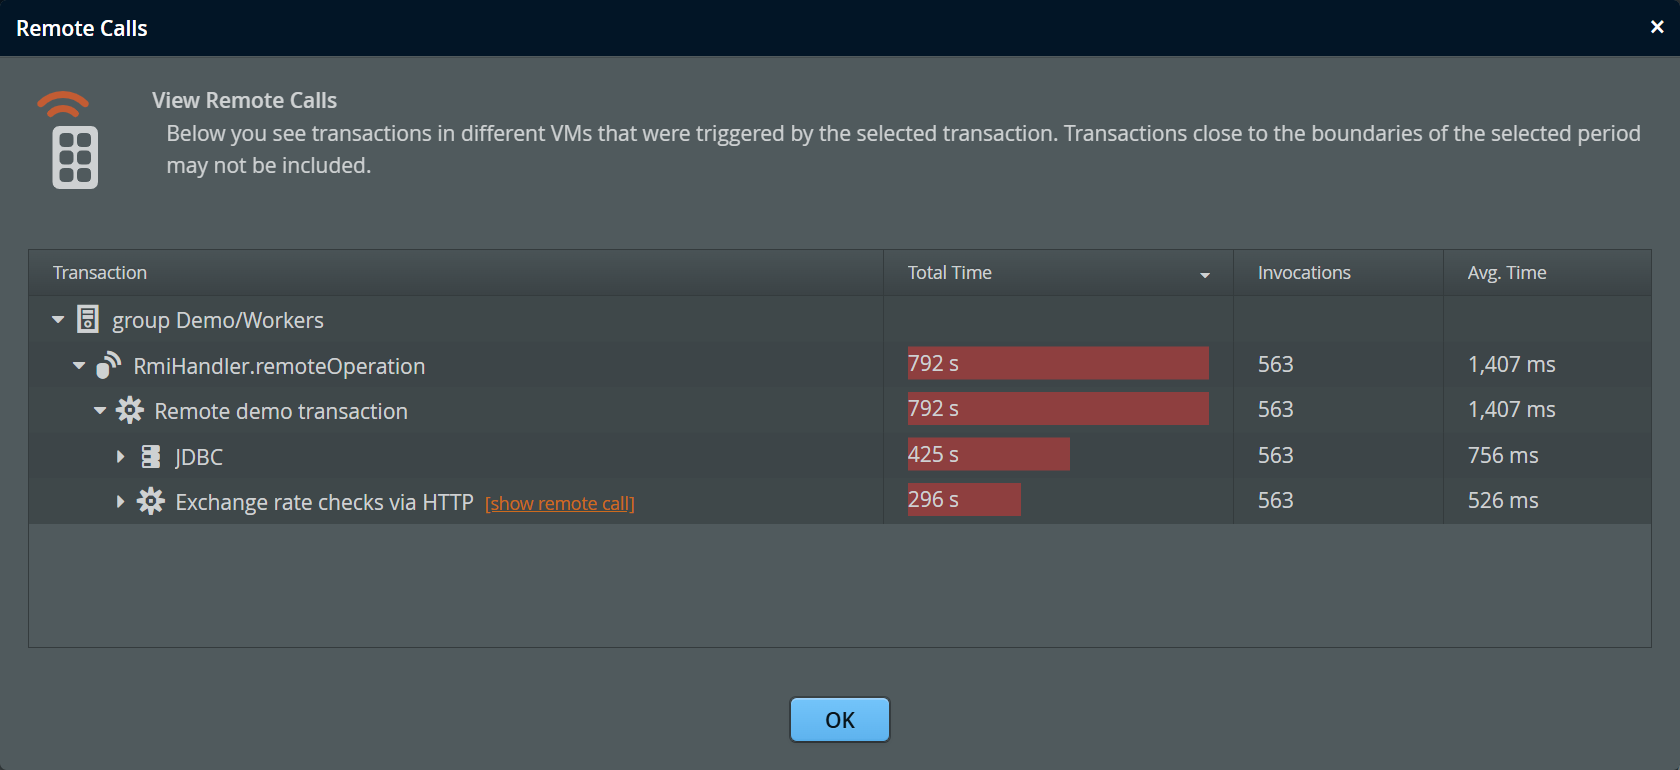
Clicking on the "show remote call" link opens a new dialog that shows the call tree of transactions in the remote VMs that were started by the selected transaction. At the top-level, the call tree is partitioned into VM groups.
The call tree only shows the transaction in the target VMs. If there are further remote calls, you will see "show remote call" links, just like in the original call tree view. Clicking on those links replaces the call tree in the dialog and shows a Back In History button that can be used to return to the previous level. If the button disappears after clicking it, you are now looking at the first level.
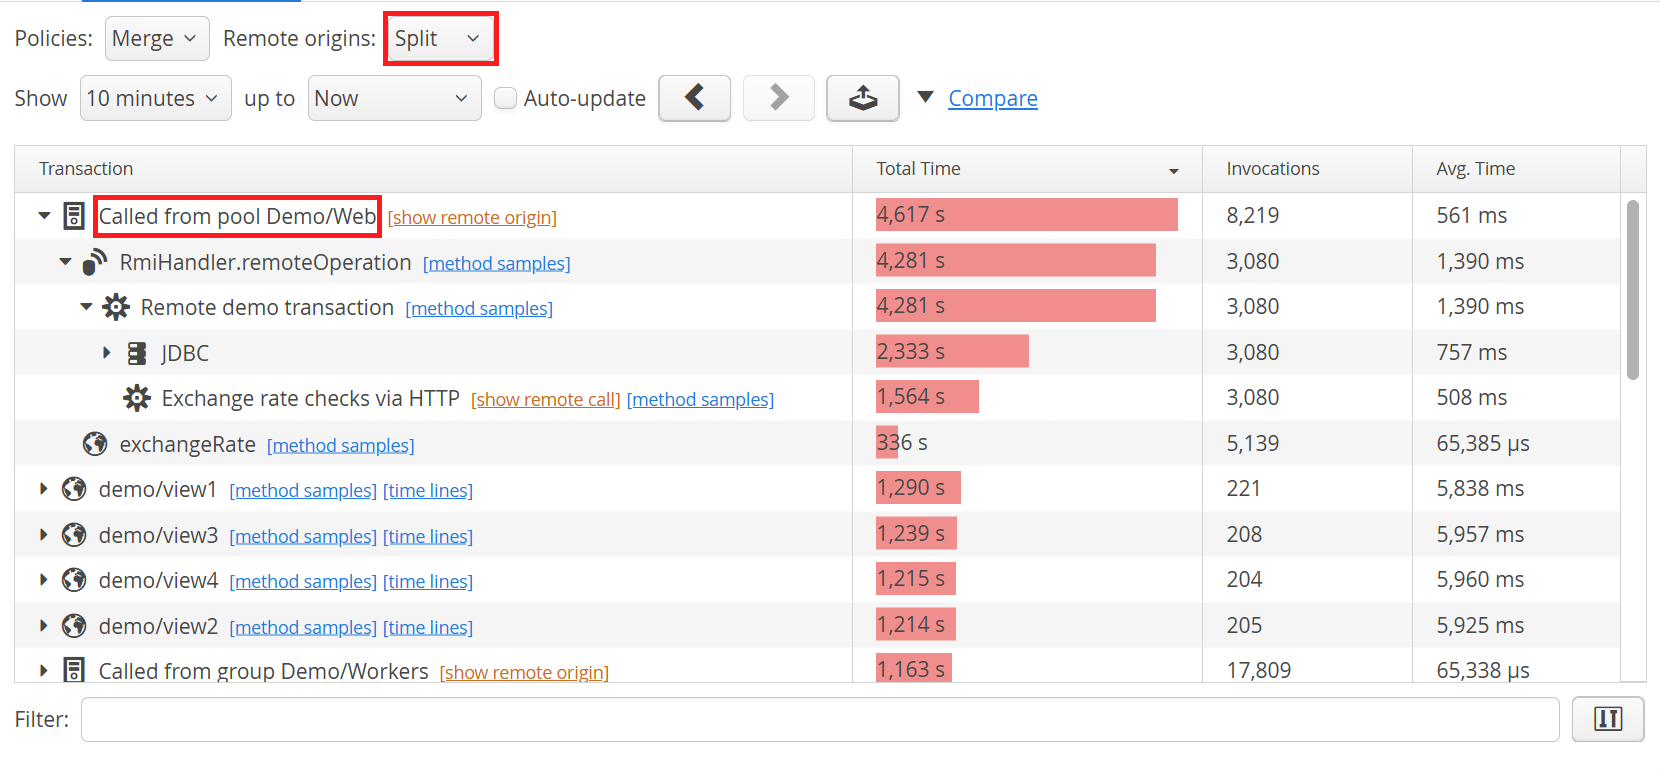
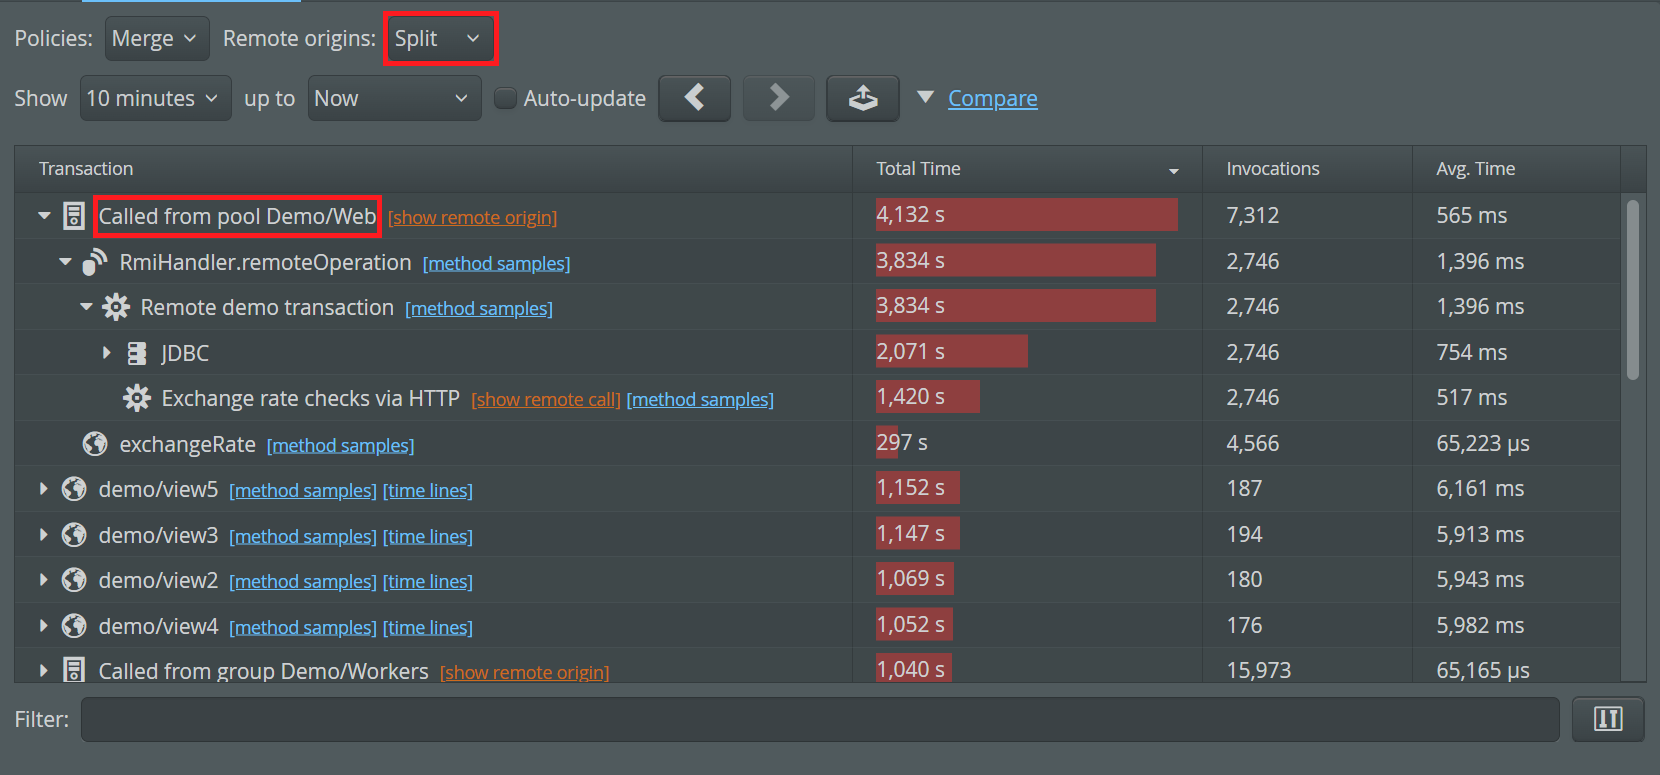
It is also possible to move in the opposite direction and ask which remote calls in other VMs started transactions in the currently selected VMs. First, change the remote origins drop-down to "Split". By default, that drop down is set to "Merge" and you cannot see the remote origins. With the "Split" setting, "Called from ..." nodes appear at the top-level containing transactions that were started by remote calls from other monitored VMs. If you are looking at VM group or VM pool data, a split is performed for each VM group, but not for individual VMs. If the data is not granular enough, consider making your VM group structure more granular. If you are looking at the data for a single named VM, the split is performed for each remote VM.
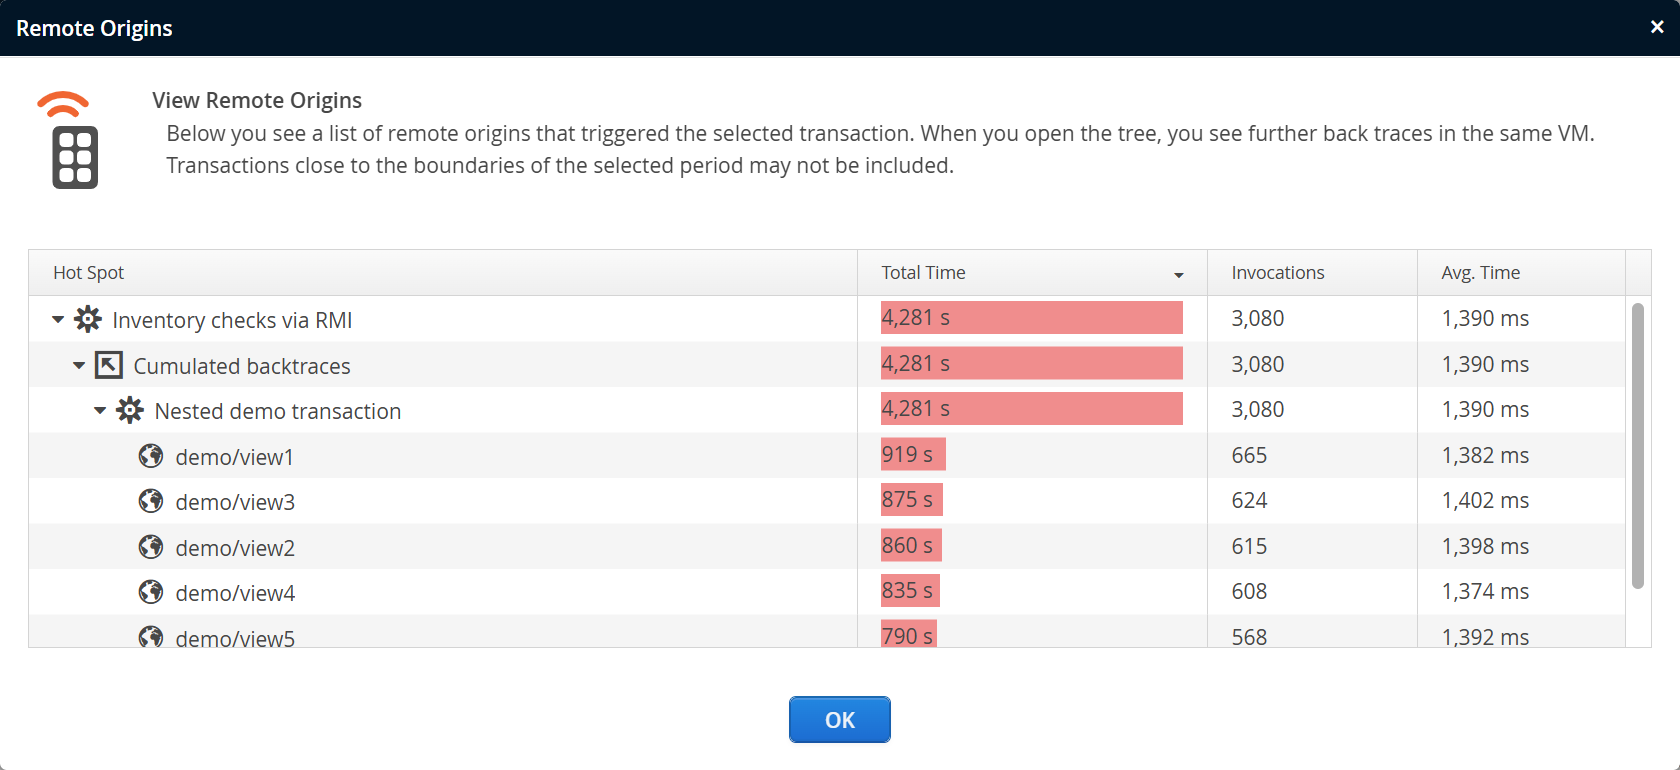
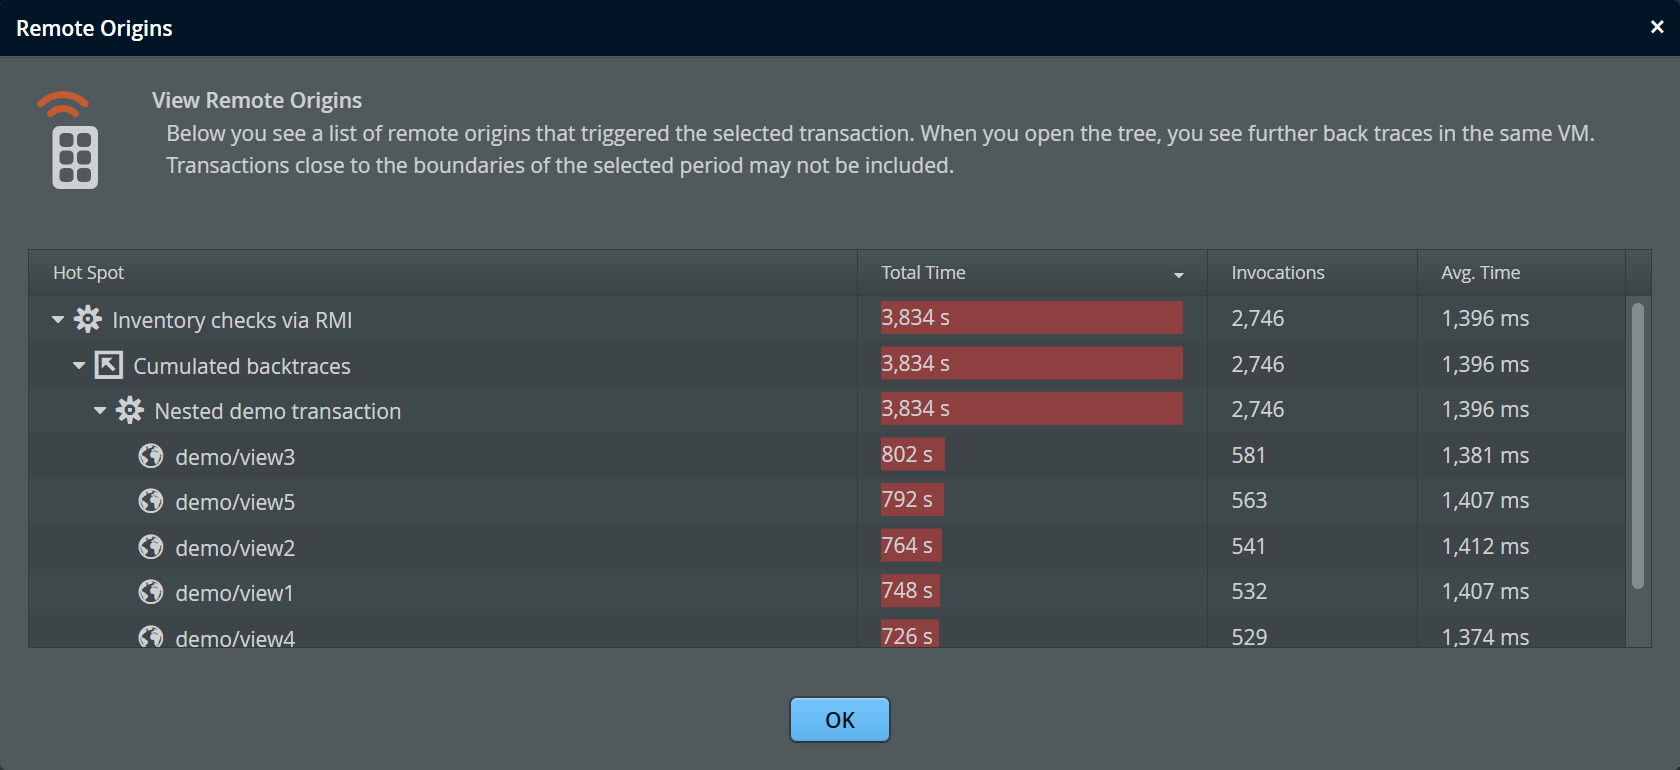
Similarly to remote calls, clicking on the "show remote origins" link brings up a modal dialog. In the dialog, the count and duration of the selected transaction is attributed to the remote transactions that started it. The data is presented as hotspots with the innermost transactions from the originating VM at the top level. Analogous to the "remote calls" dialog, you can jump further back in a chain of remote calls when you see a "show remote origins" link next to a transaction. The Back In History button brings you closer to the original transaction.
Overload protection
If you monitor many VMs that all call each other, the number of the remote call sites grows with the square of the number of VMs. Remote call sites have a substantial overhead, since the transaction call trees have to be split for each remote call site. If too many distinct remote call sites are being created, perfino's overload protection mechanism prevents excessive resource usage.