While policies and thresholds detect anomalous conditions and display them in the dashboard and the VM data views, they cannot take any actions by themselves. With triggers, you can react to policy and threshold violations and execute a list of configurable actions.
Mechanism
Triggers operate on a different level than policies and thresholds. The latter are configuration options that are applied to single VMs or VM groups. Triggers, on the other hand, are not directly coupled to single policy or threshold violations. Rather, they react to sequences of such events that originate from all monitored VMs in a VM group.
This mechanism is intended to give you greater flexibility for deciding what constitutes a condition that requires a particular action. For example, you might expect up to one slow URL invocation when a cache is rebuilt. However, if there are five slow URL invocations per hour or more, then something is wrong. The definition of what is acceptable and what is not, strongly depends on the type and the implementation of your application.
Configuration
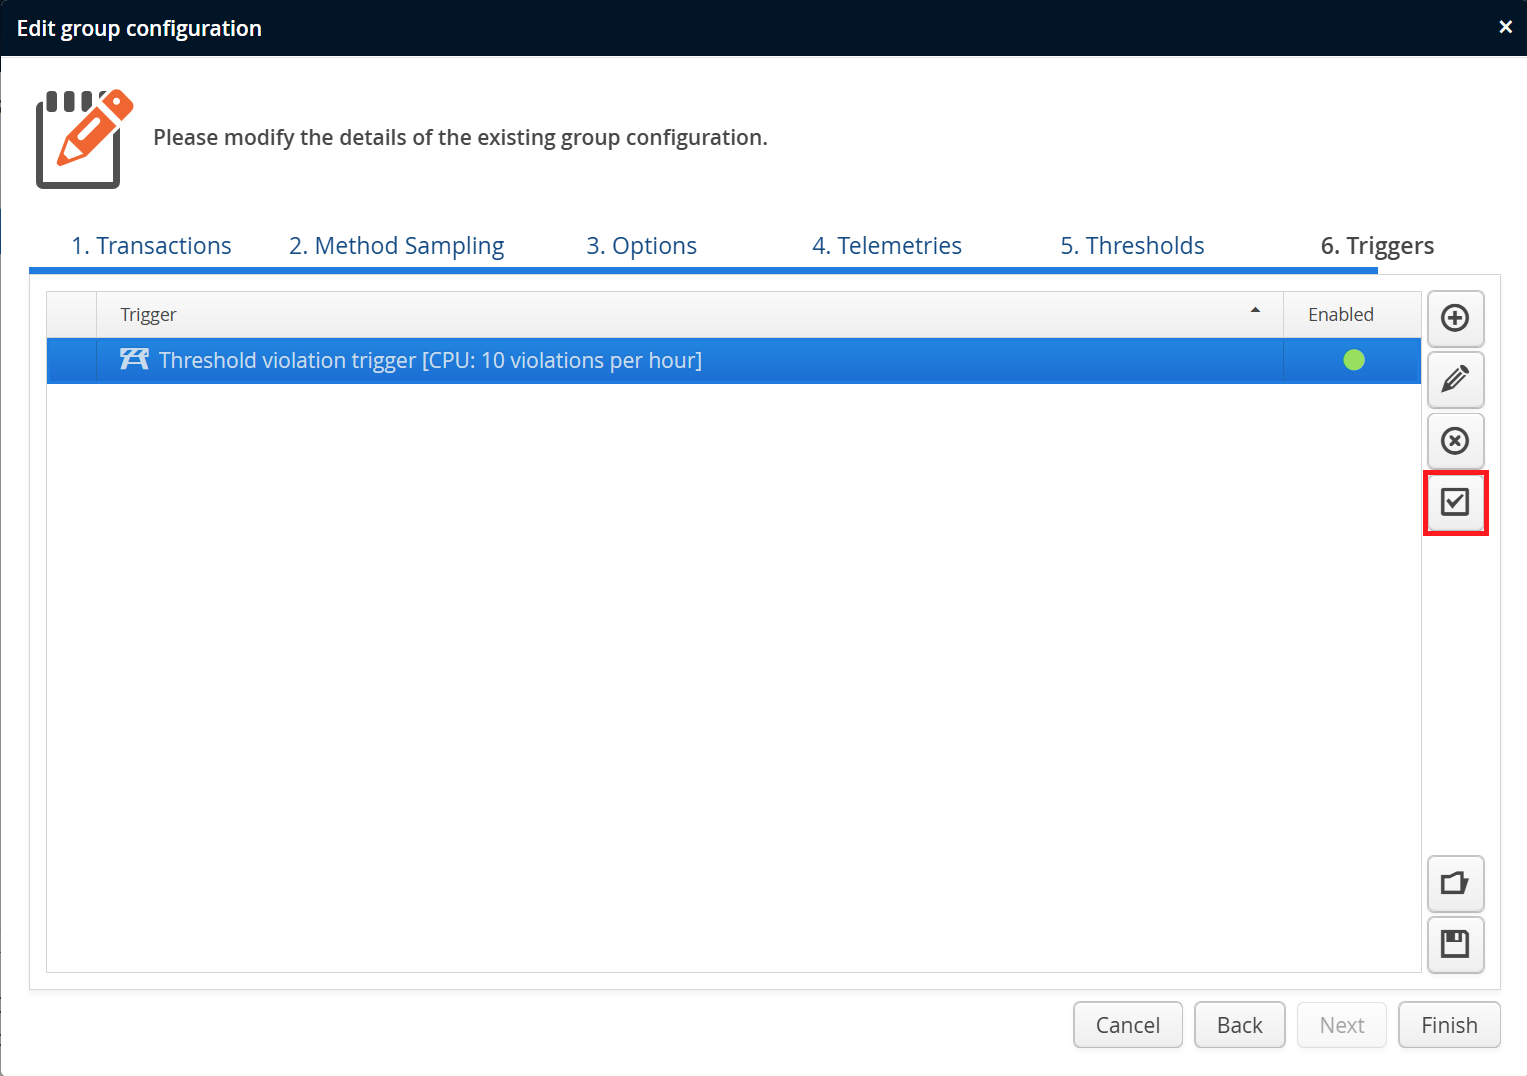
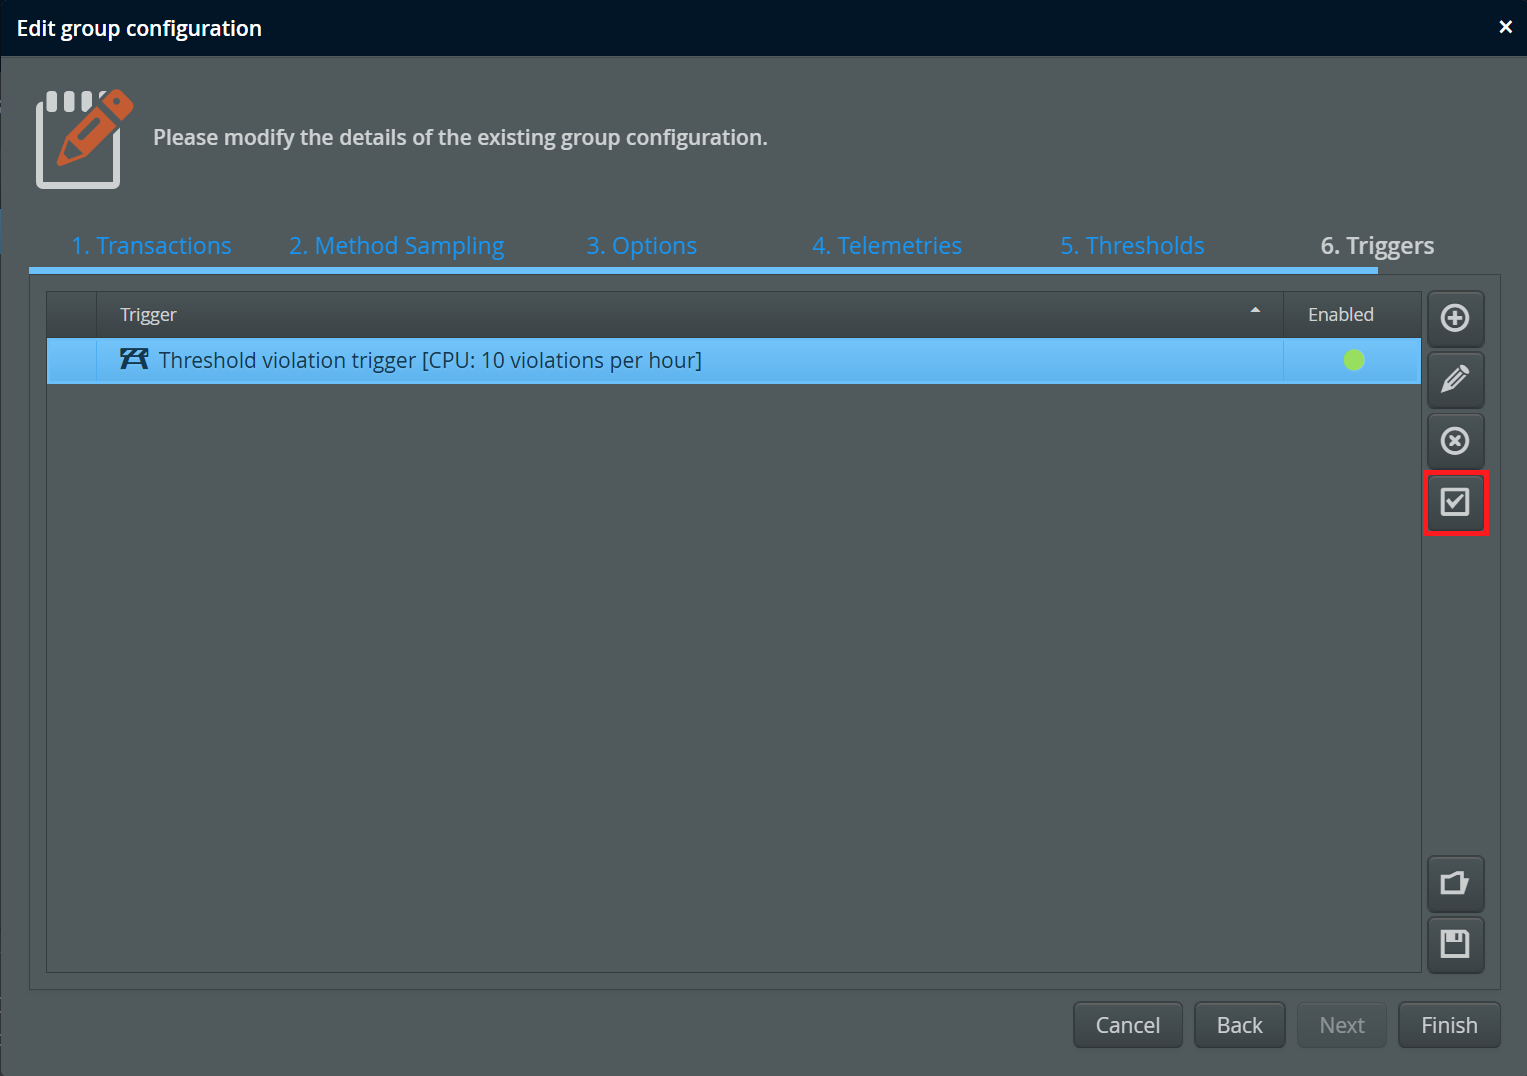
In the recording settings, you can edit triggers for each VM group. Triggers operate on all recursively contained VMs. It is possible to define different triggers for a VM group and an ancestor VM group, both sets of triggers are handled separately.
In some cases, triggers are fired too often. For that case, perfino allows you to disable a trigger until you have time to figure out how to change the underlying configuration.
Like for transaction definitions and other entities in perfino, triggers can be saved to and loaded from trigger sets. This enables you to copy and paste trigger definitions as starting points to multiple VM groups.
Trigger types
There are three types of triggers:
-
Policy triggers
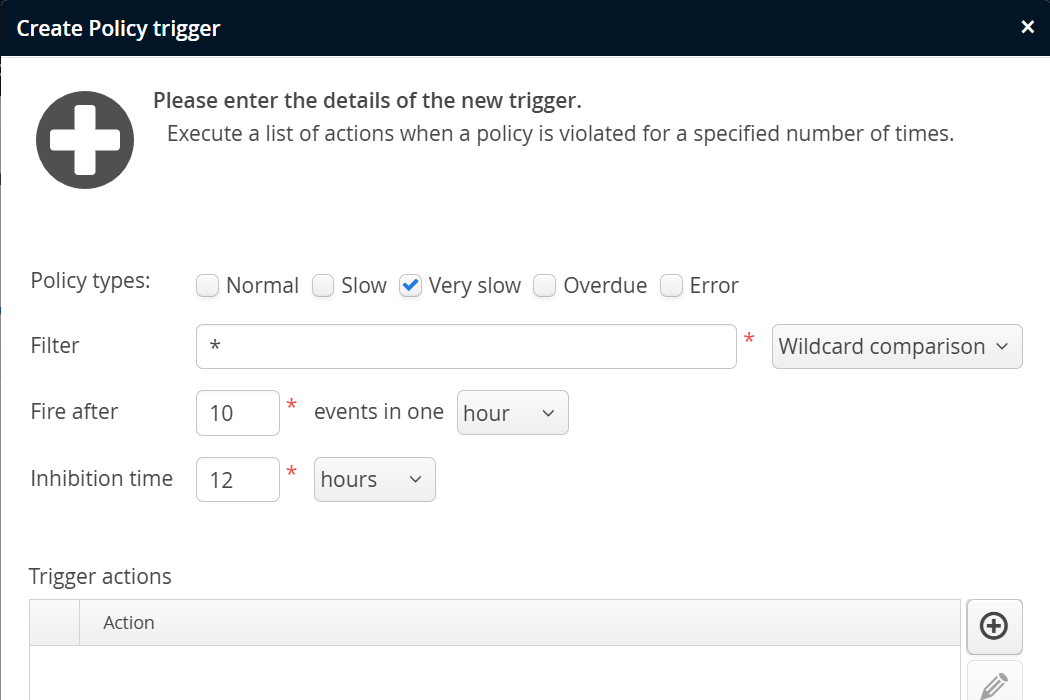
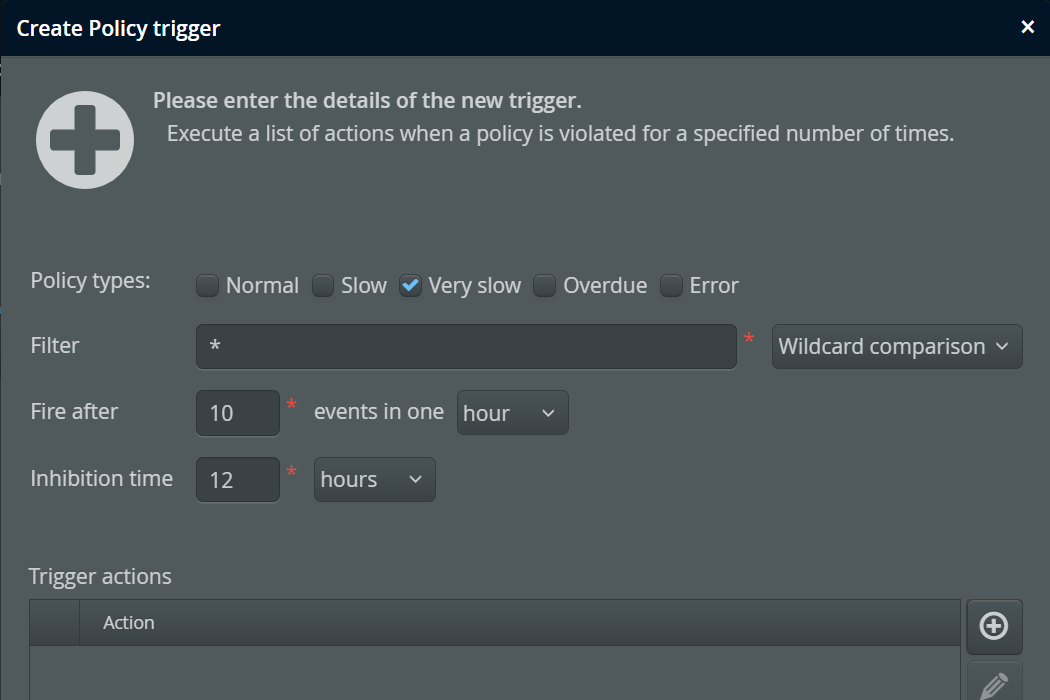
Policy triggers are fired when the policy violations of a set of transactions exceed a defined number during a specified period of time. The filter text field takes a transaction name pattern, either a wildcard expression or a regular expression. Also, policy triggers are configured for particular policy violation types.
You can have multiple policy triggers, each matching different transaction names. Unlike for transaction definitions, there is no name matching for policy triggers where only the first matching entry is used. If you add more than one trigger for the same transaction name, you will probably want to set different event rates, otherwise both triggers will be fired at the same time.
The trigger condition is decoupled from the actual condition of the policy violation. Various transactions can define different times after which a transaction is characterized as "very slow", the policy trigger then counts these events.
-
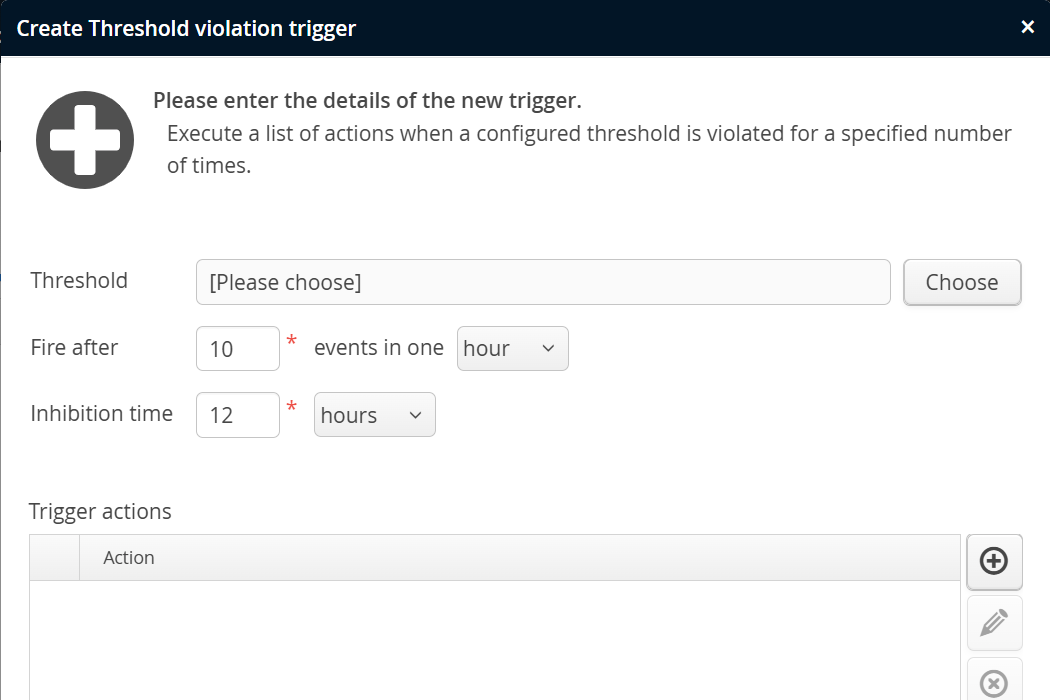
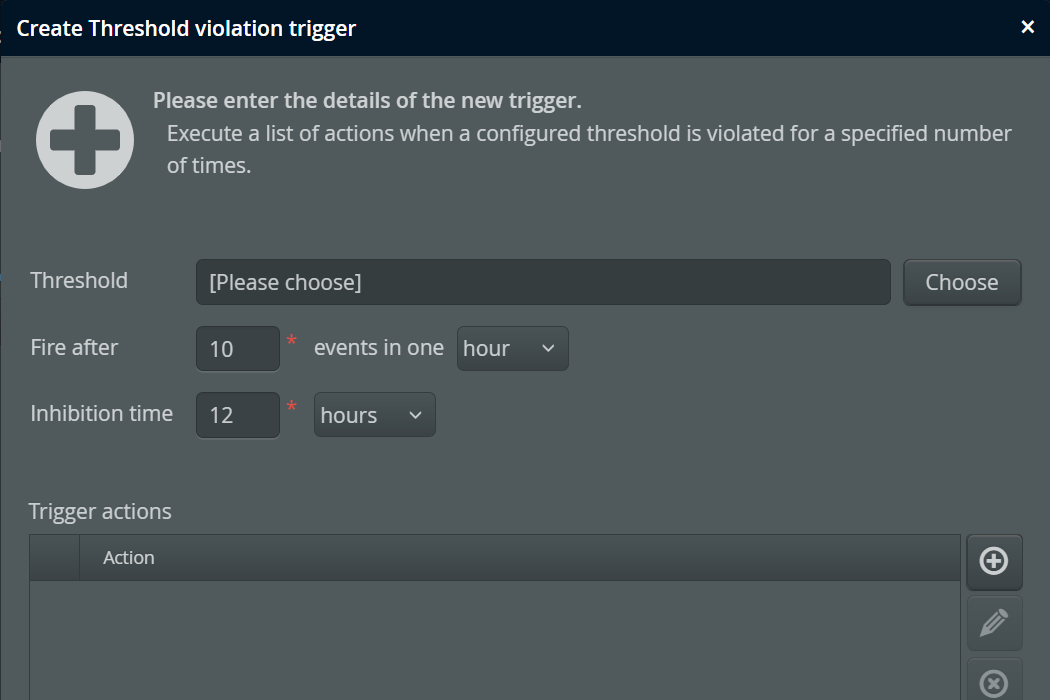
Threshold triggers
Threshold triggers are fired when the rate of threshold violations for a selected telemetry exceeds a configured value. This requires that you have configured at least one threshold for the same VM group.
Like for the policy trigger, the trigger condition does not define an actual threshold. Thresholds can be defined differently in different descendant VM groups, and the threshold trigger then counts threshold violations.
As an example, imagine you have two groups of machines, powerful machines and legacy machines. On a powerful machine, the number of threads may not exceed 1000, on a legacy machine that threshold is just 500. You would create VM groups named "Powerful" and "Legacy" and define the corresponding thresholds in the recording settings of each group as well as a default threshold in the "All VMs" group. Then, in the "All VMs" group, you would define a threshold trigger for the thread count telemetry. That trigger would handle both VM groups at the same time.
-
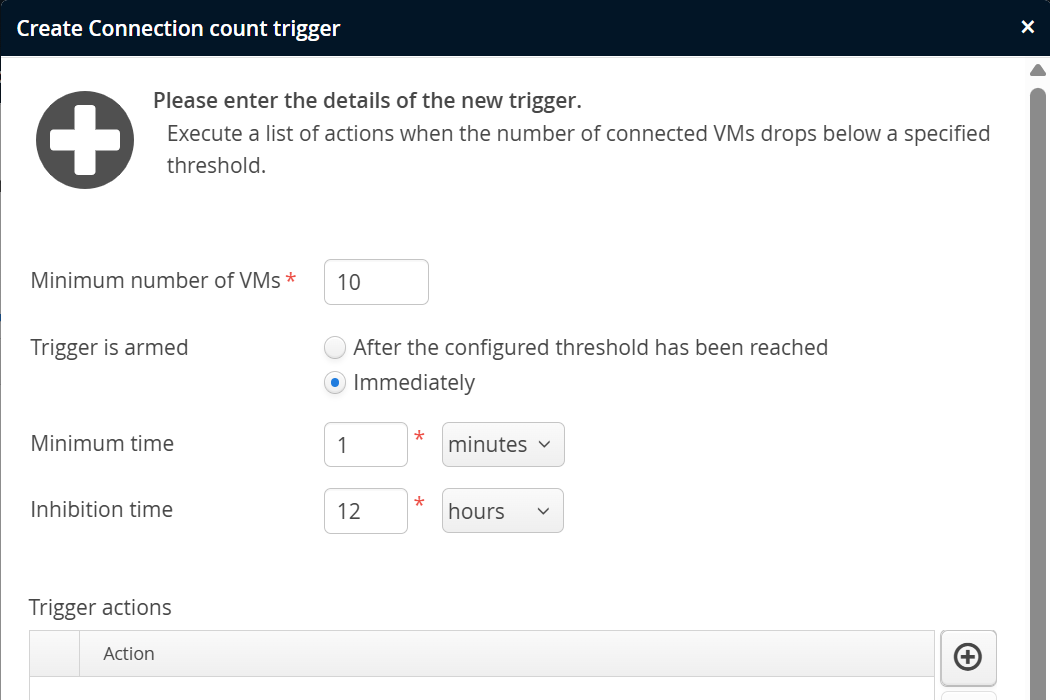
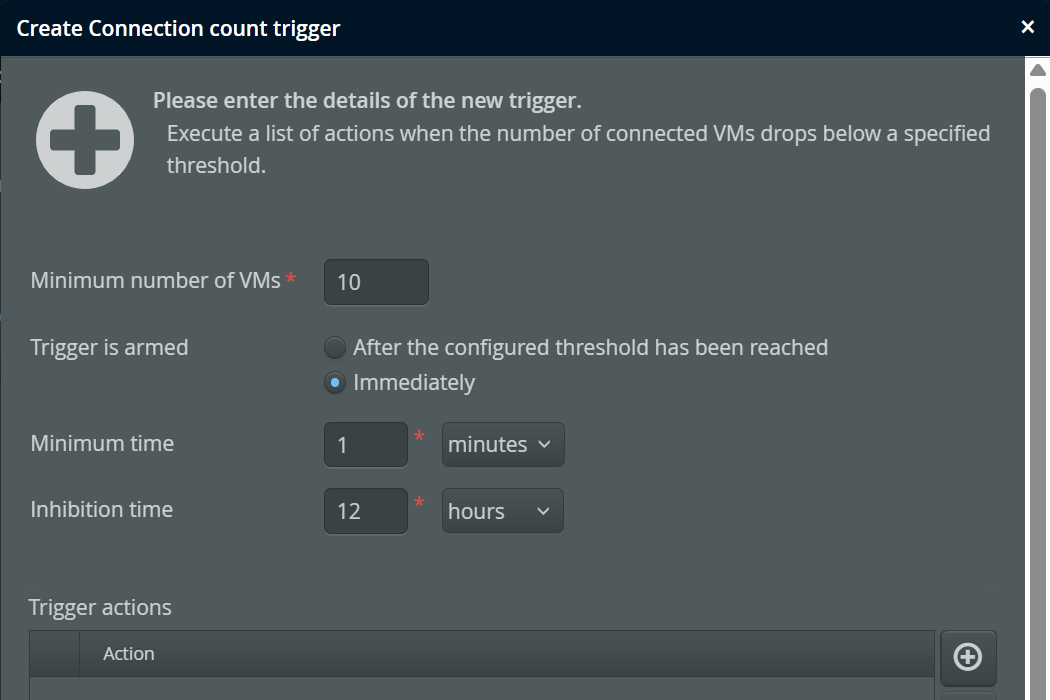
Connection trigger
The number of connected VMs is a scalar value that originates in the perfino collector and not in the monitored VMs. The connection trigger is intended to take action in the case that too few VMs are running. The configured minimum number is not reached immediately when the perfino server is started, so you have the option of arming the trigger only after the minimum number has been reached for the first time, or after a fixed amount of time has passed.
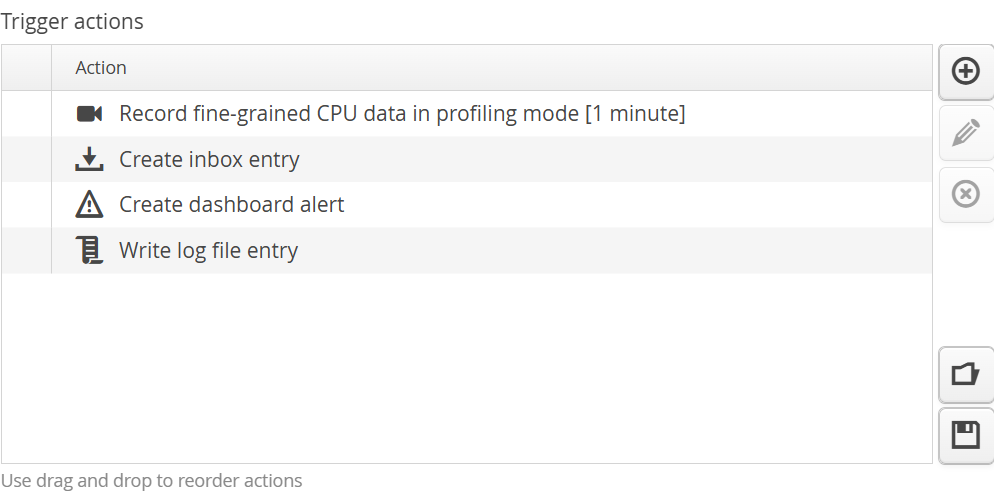
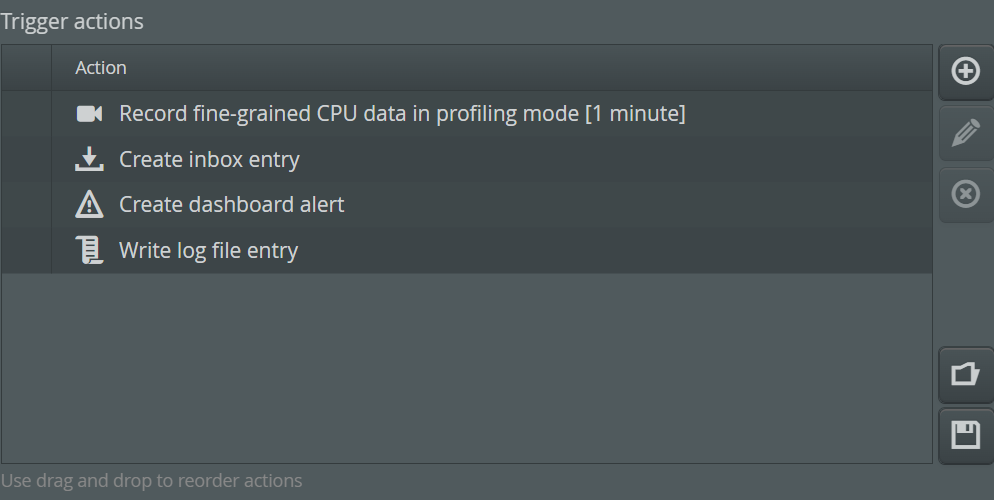
Trigger actions
Each trigger can have an arbitrary list of actions.
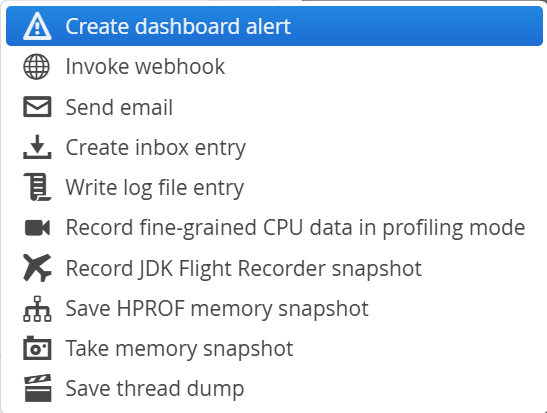
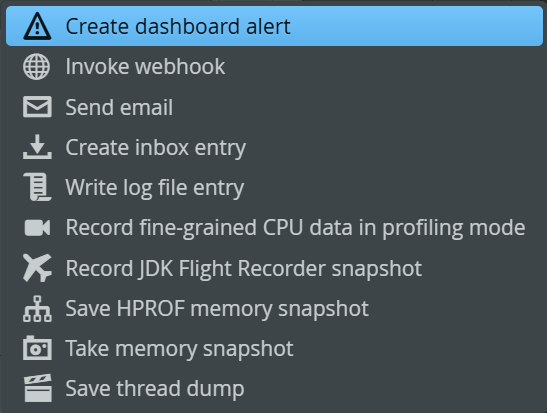
The types of actions that can be added to a trigger can be ordered into two categories:
-
Notification actions
Notifications can be created for consumption inside perfino. Apart from the alerts mechanism, you can write to the log file or to the inbox. Alerts are visible in the dashboard and are saved as historical data. The inbox is maintained for each user and has an "unread status" on a per-user basis. Externally, you can send emails or invoke webhooks. For sending emails, the SMTP configuration in the general settings has to be valid.
Emails get a subject line that indicates which VM cause the trigger to file, in webhook actions you can use the character sequence
@TRIGGER@to insert this message into headers, query parameters or a JSON request body. -
Data collection actions
As a reaction to anomalous conditions, you can decide to record more data for a detailed analysis. Some of these data recording options are more intrusive than the regular perfino recording.
For example. saving an HPROF heap snapshot should not be done on a regular basis, but if memory is low, it will help you to find a memory leak. HPROF snapshots are written directly by the JVM and do not require a native JVMTI profiling agent to be loaded. As such, this is a low-risk activity, although the VM is halted until the snapshot is saved. JProfiler and other Java profilers can open HPROF snapshots.
For getting memory information with a low overhead, use the action to take a memory snapshot. Memory snapshots are shown in the "Memory" view in the "VM data views" section.
Thread dumps are a basic low-overhead way to inspect what is currently happening in a JVM. A policy trigger with event type "overdue" can save a thread dump, so you can immediately see in which method a transaction is hanging.
Recording data in profiling mode is an escalation in CPU data gathering that requires a native JVMTI agent to be loaded. The native perfino agent operates in a restricted mode that is optimized for minimum overhead and minimum risk. More information on this topic is available in the chapter on cross-over to profiling.
The data collection actions are also available in the "VMs view" when clicking on the "actions" link next to a connected VM.
The list of actions is executed in order. If one action fails, perfino jumps to next action and does not terminate the execution of the trigger actions.