There are several reasons why you should not have a profiler running in production at all times. For one, there is the overhead that may be unacceptably high depending on the profiling settings. Profilers are geared towards maximizing the extraction of useful information with no explicit guarantees as to the incurred overhead. Also, the use of the native profiling interface in the JVM (JVMTI) is something that is an additional risk in a production environment. Depending on whether you use non-standard garbage collectors or other JVM tuning options, there may be stability concerns, since the JVM is not tested as extensively with JVMTI as it is without.
However, the best defense against performance problems is defense in depth. Sometimes there are situations that require more information than what can be obtained from the low overhead monitoring and sampling techniques that are available in perfino.
Recording CPU snapshots
For these cases, perfino offers a full sampling mode that loads a native JVMTI library that is optimized for in-production use. The result of this operation is a JProfiler snapshot file that can be downloaded from perfino and opened in JProfiler - similarly to the HPROF memory snapshot files that are saved directly by the JVM.
This profiling mode is only available if the correct native libraries are present in the
lib/[platform] directory next to the perfino.jar file
that was used in the -javaagent VM parameter. If you
download the agent from the perfino UI, native libraries for all supported
platforms are already included. If you copy the agent yourself from the perfino installation directory,
copy the agent/lib directory along with it.
Once the JVMTI has been turned on, it cannot be turned off again. As long as the JVM is running, it will remain in this state. Typically, the overhead of the JVMTI without any data recording is less than 1%, though.
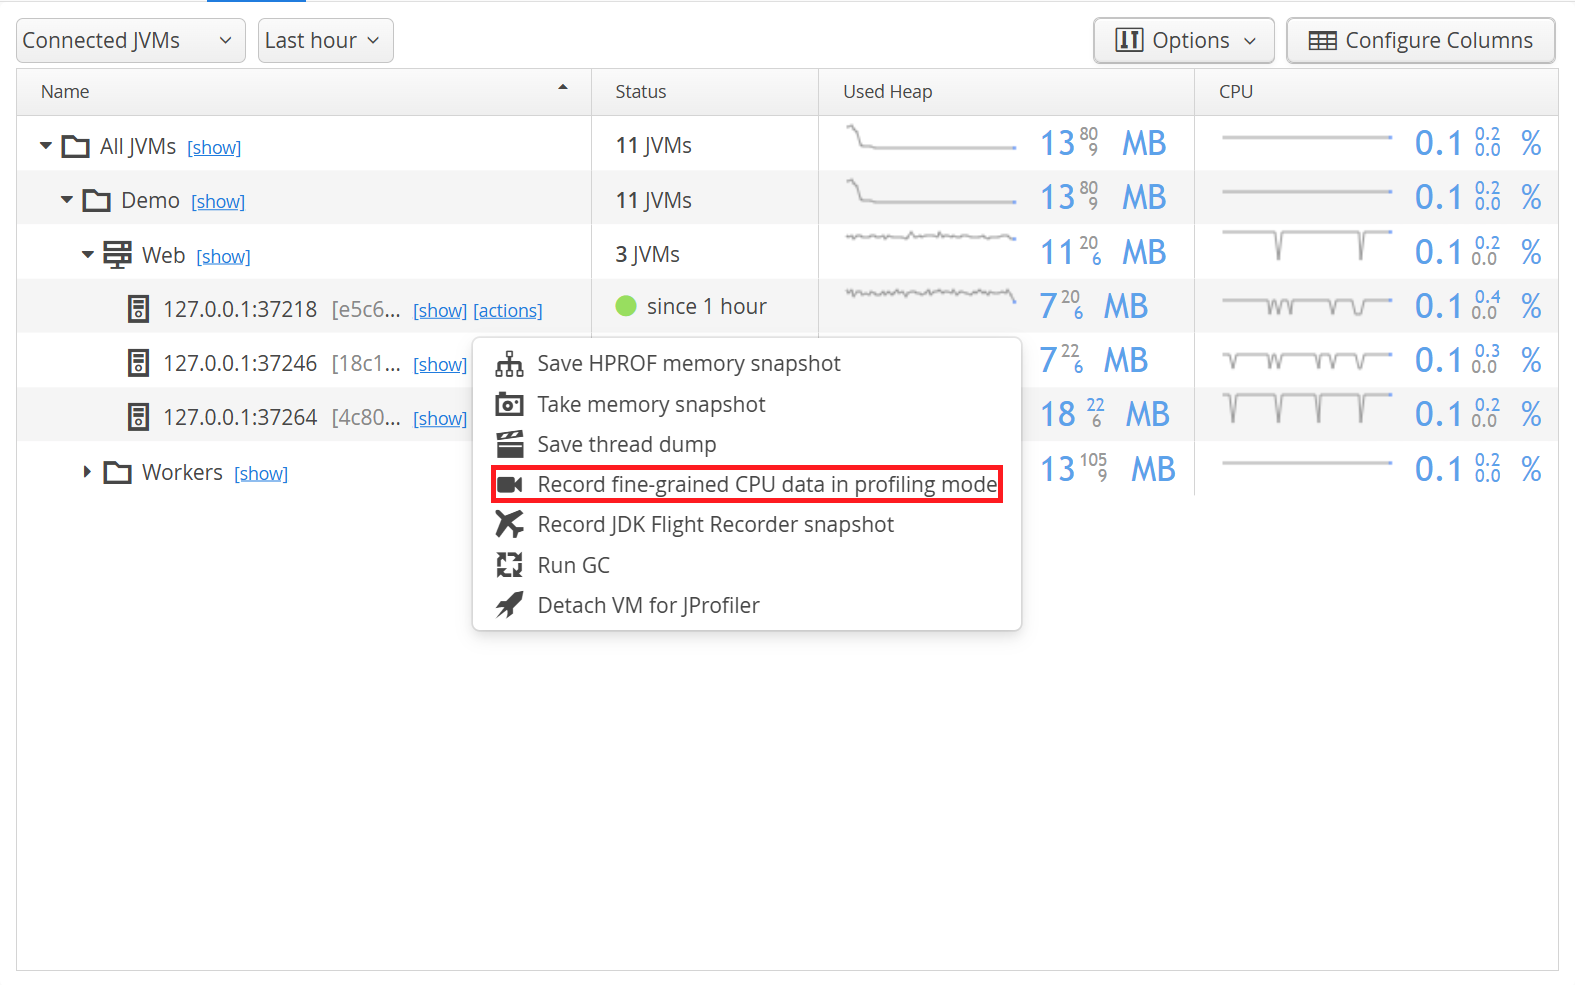
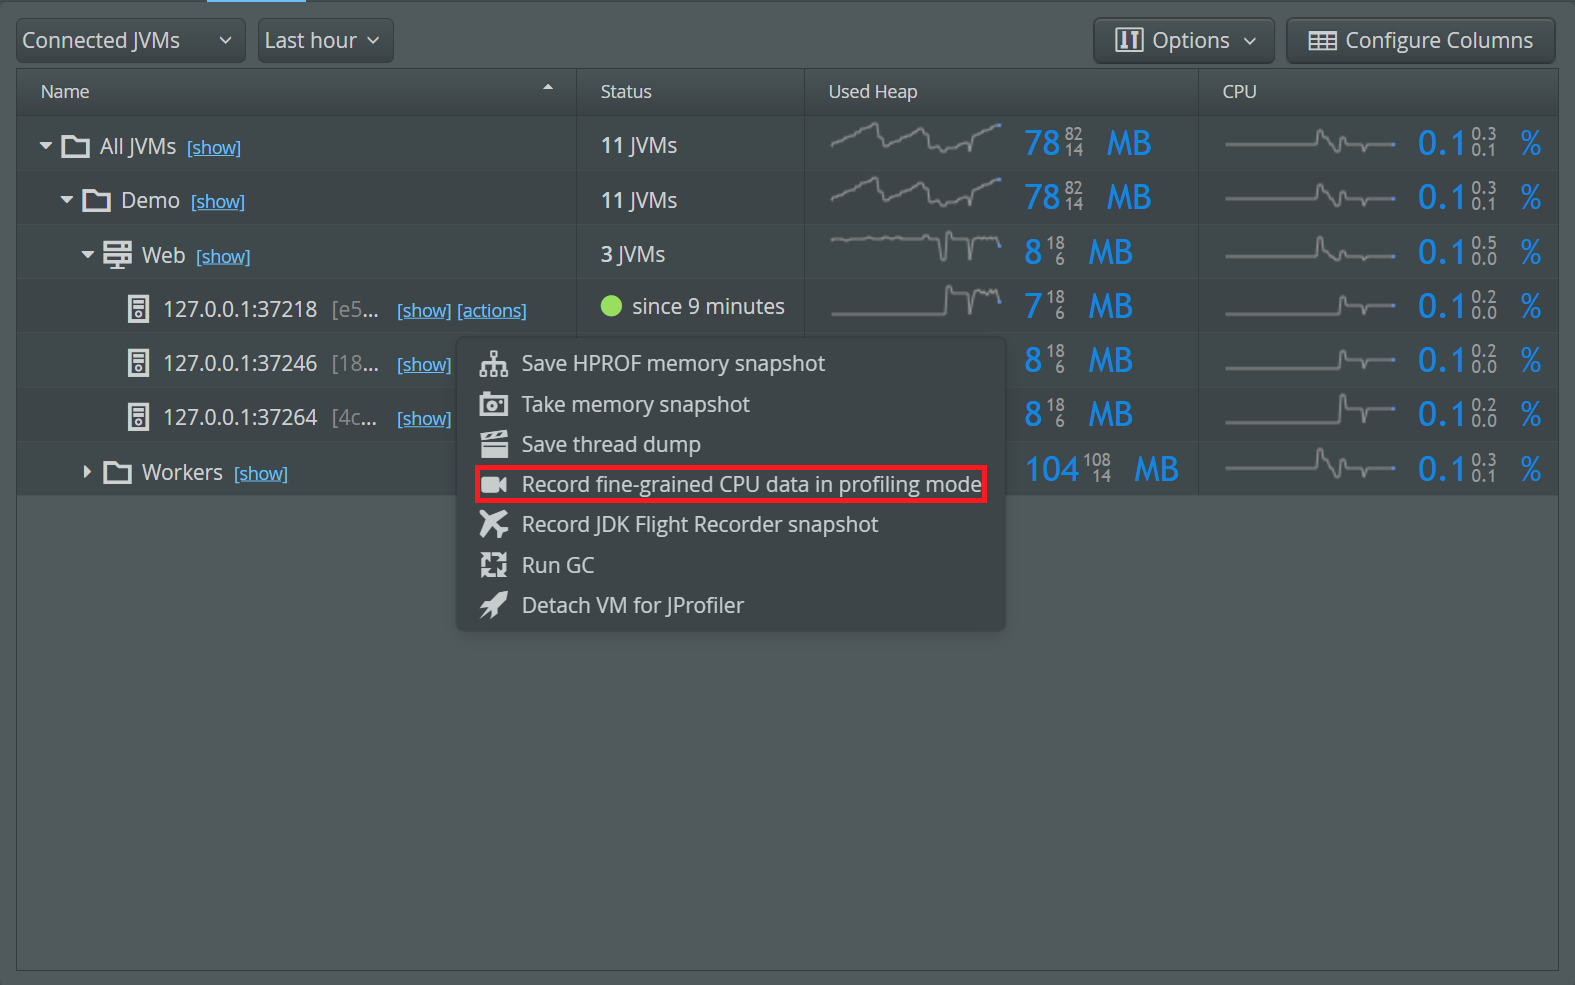
To take a CPU snapshot of a particular VM, go to the VMs view, click on the "actions" link next to the VM and select "Record fine-grained CPU data in profiling mode".
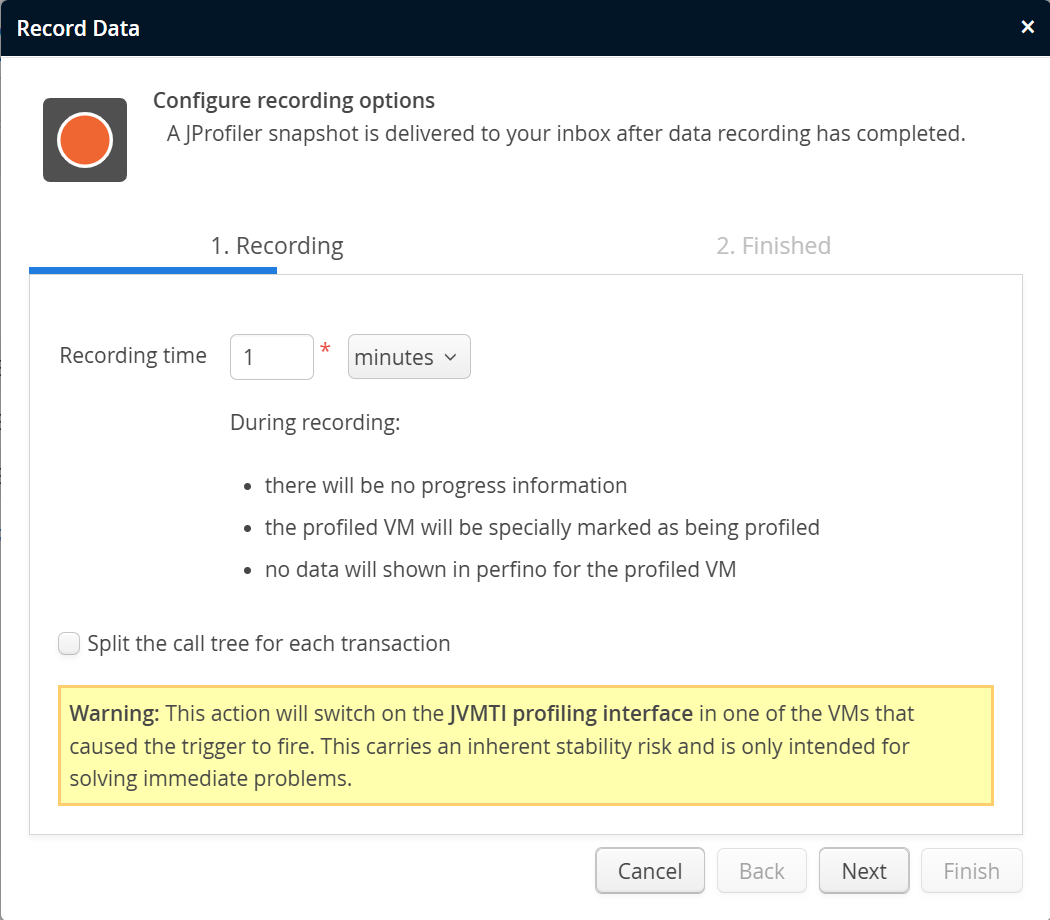
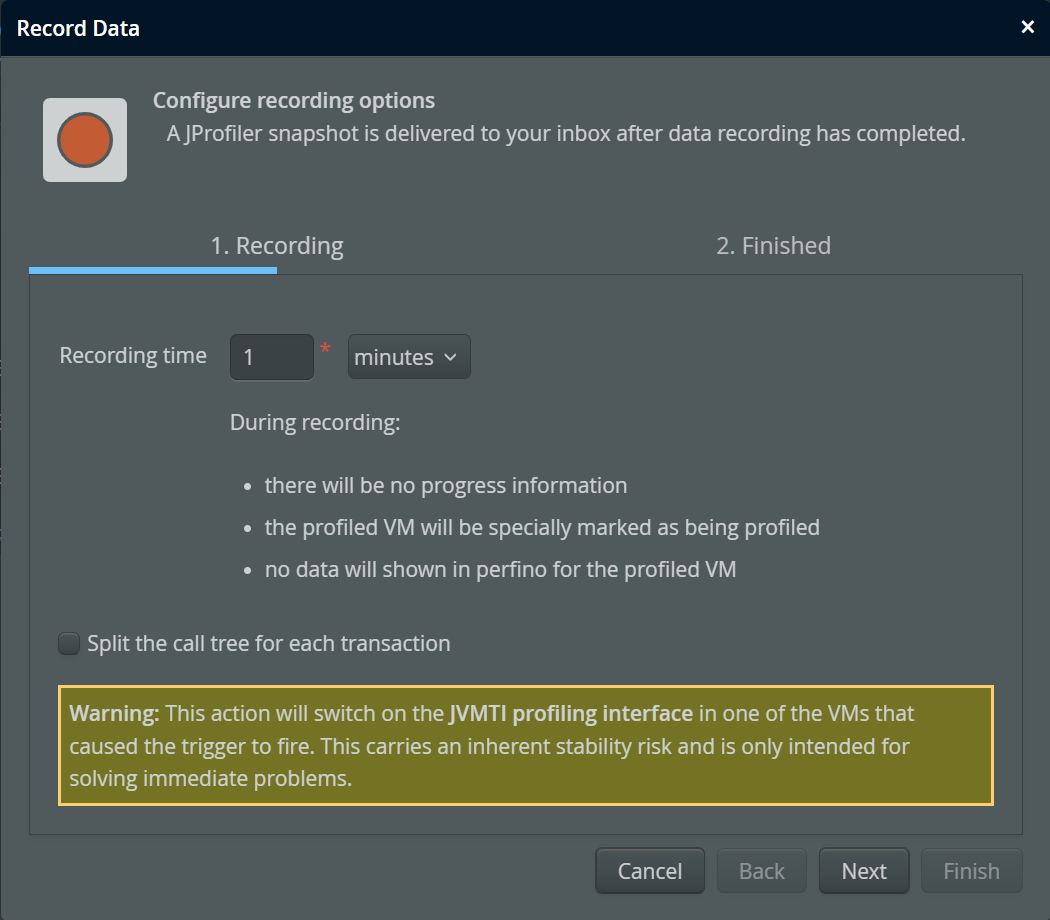
The duration of CPU recording can be configured. perfino monitoring is not impacted by CPU sampling. Also, you can specify if the call tree should be split for each transaction or not. This is a top-level split, and the sampling call tree is appended to the perfino transaction tree (see below). Whether this split is beneficial or not depends on your transaction definitions and what kind of problem you want to find. The overhead for sampling with transaction splitting is higher than without.
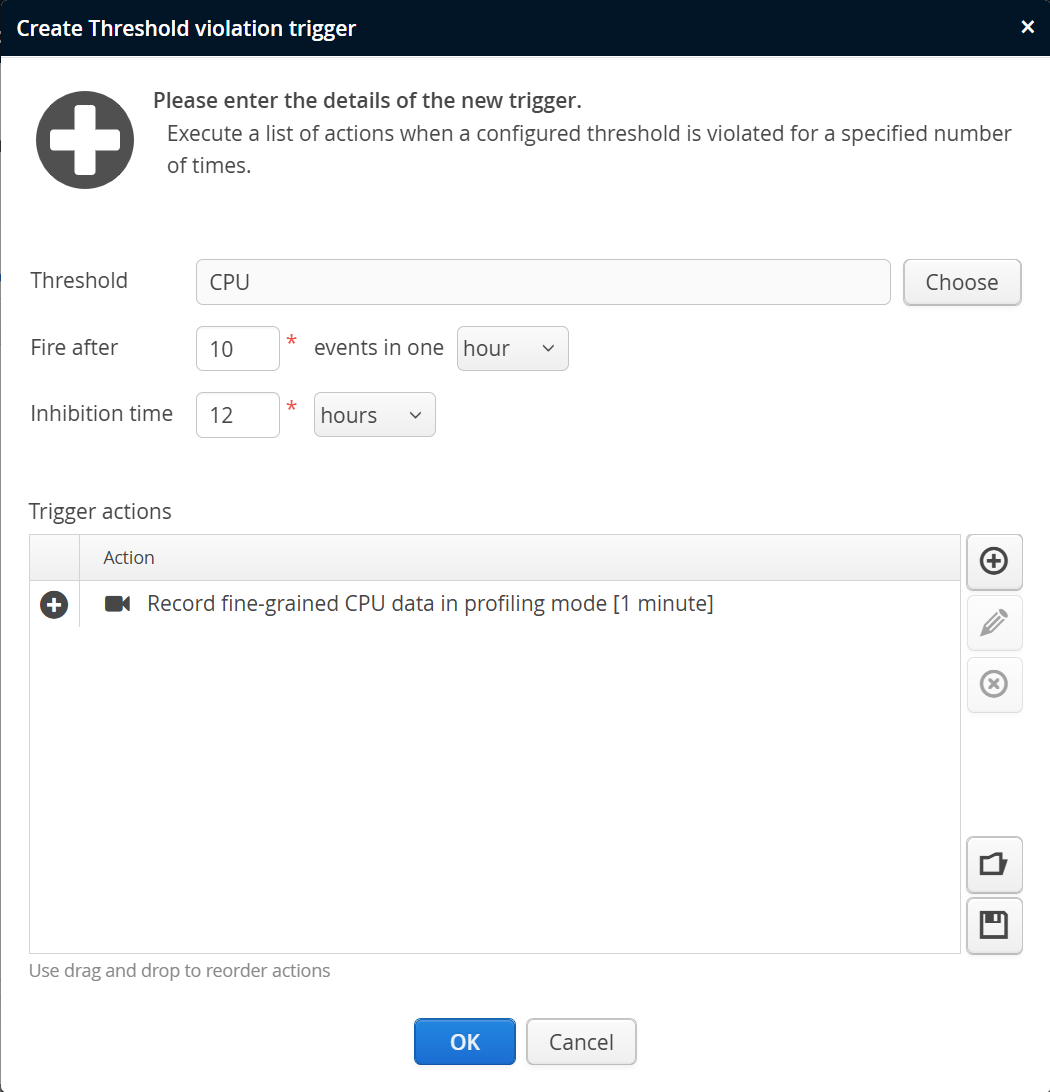
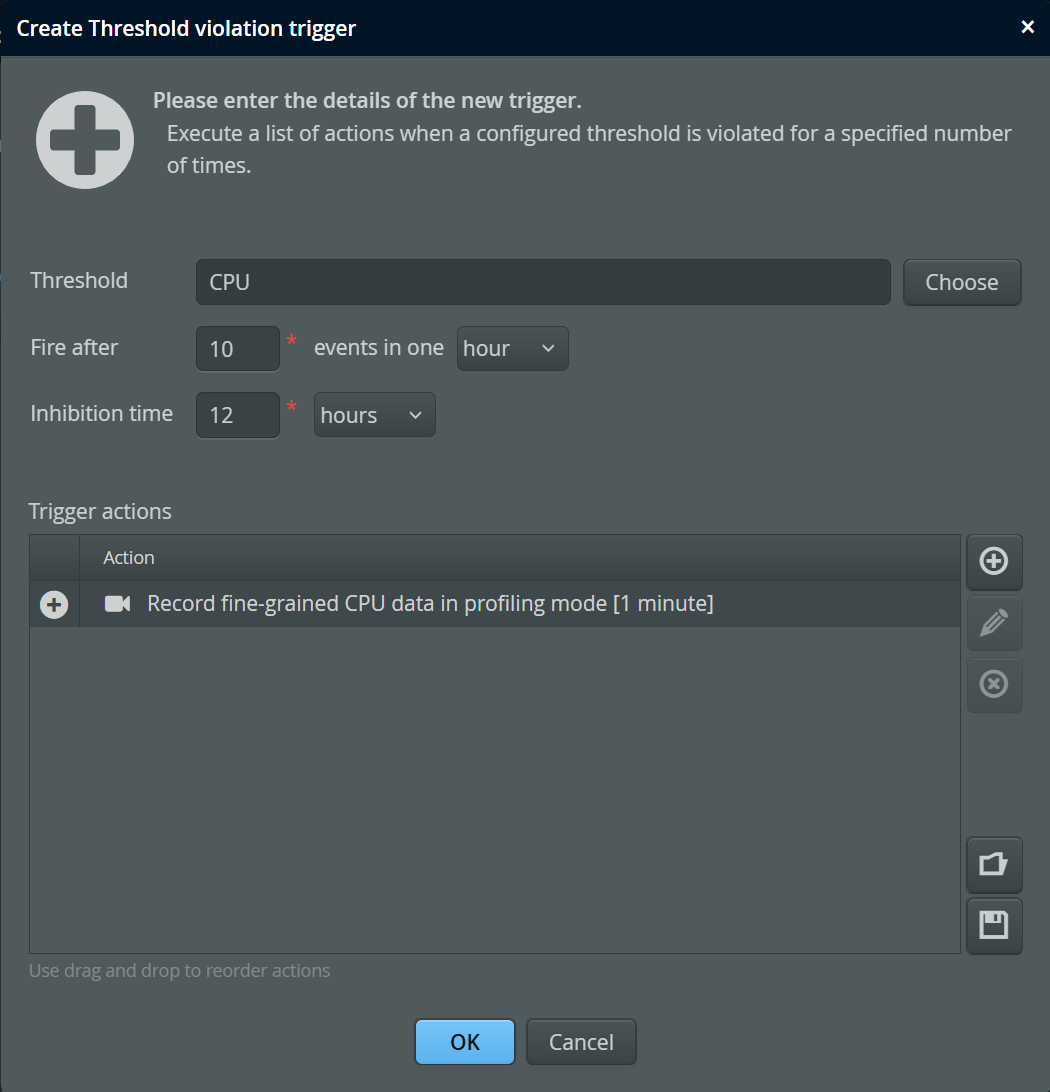
To take snapshots automatically if the CPU load is too high, you can set up a threshold for the CPU telemetry and configure a trigger that includes the "Record fine-grained CPU data in profiling mode" trigger action.
Note that only the last offending VM will be profiled, not all of them.
If you use a custom library for network I/O, you can add selected methods to the net I/O thread state, so that you get useful hot spots for your analysis.
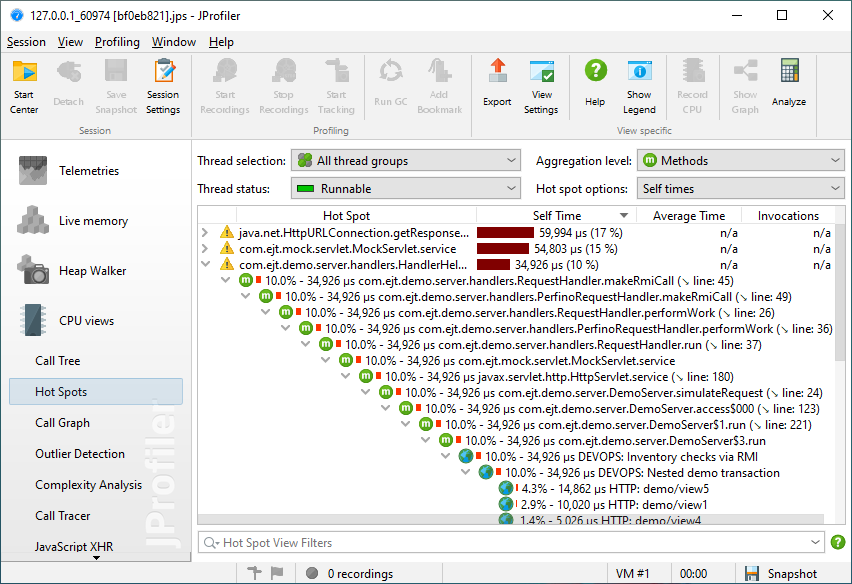
Viewing CPU snapshots in JProfiler
CPU snapshots are delivered to your perfino inbox from where you can download them. The file extension is ".jps" which stands for "JProfiler snapshot". If you have JProfiler installed, you can double-click on the snapshot file to open it, or choose Session→Open Snapshot from JProfiler's main menu.
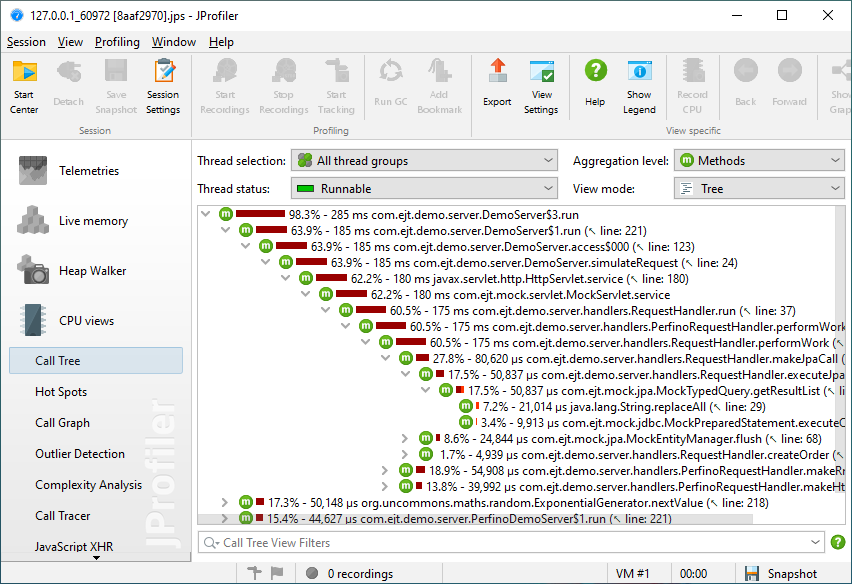
CPU snapshots taken by perfino only contain data for the call tree, hot spots and call graph views as well as the thread history and thread monitor views. Other views are disabled when you open a perfino CPU snapshot.
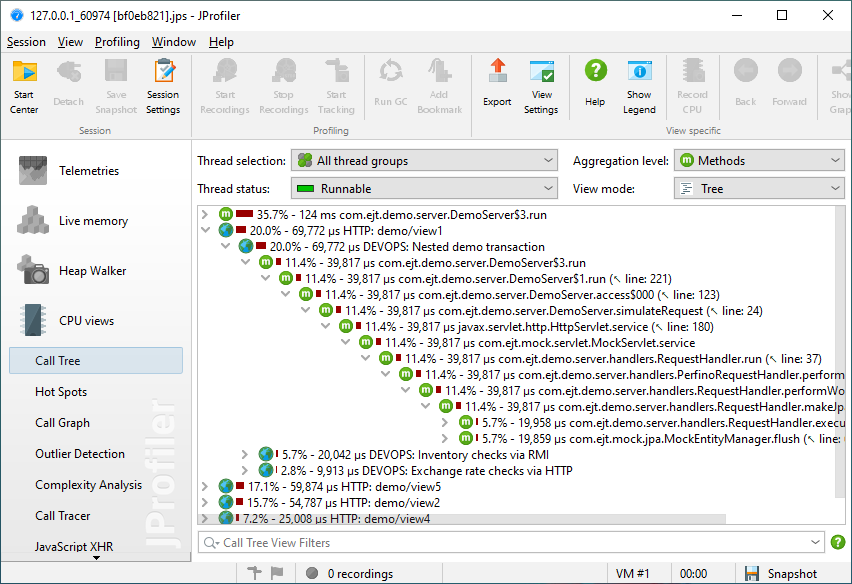
If transaction splitting was enabled for CPU recording, the perfino call tree is shown at the top and the sampling data is attached as appropriate.
The back traces in the hot spots view also show the perfino transactions in this case.
The attribution of sampling data to transactions is not exact, but only an estimation based on the analysis of subsequent sampling call stacks. For very short running transactions (< 5ms), sampling data may be attributed to another transaction or even be placed outside any transaction.
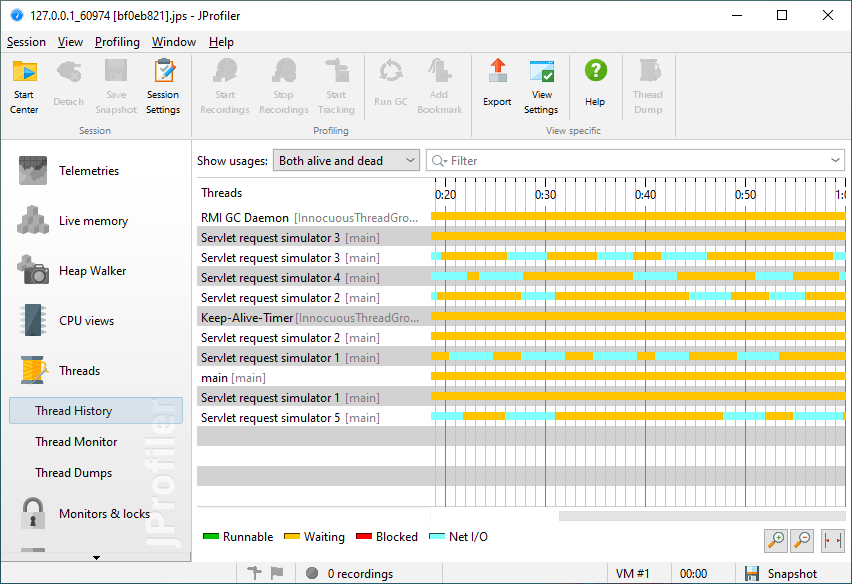
In the thread history view, you can check when threads were created or terminated and what kind of activity they performed over their recorded lifetime. Only green areas indicate times when the thread was actually eligible to execute methods. Other thread statuses designate idle time while waiting or blocking on monitors or reading or writing to network sockets.
Full profiling
Sometimes performance or memory problems are so tricky that you need the entire arsenal of recording techniques that a profiler has to offer. For example, the capabilities of the heap walker for live heap snapshots can be instrumental for solving a memory leak or the CPU and probe profiling features may be required for understanding a performance problem. Questions involving threading issues, monitors and locks can only be solved in JProfiler and not in perfino.
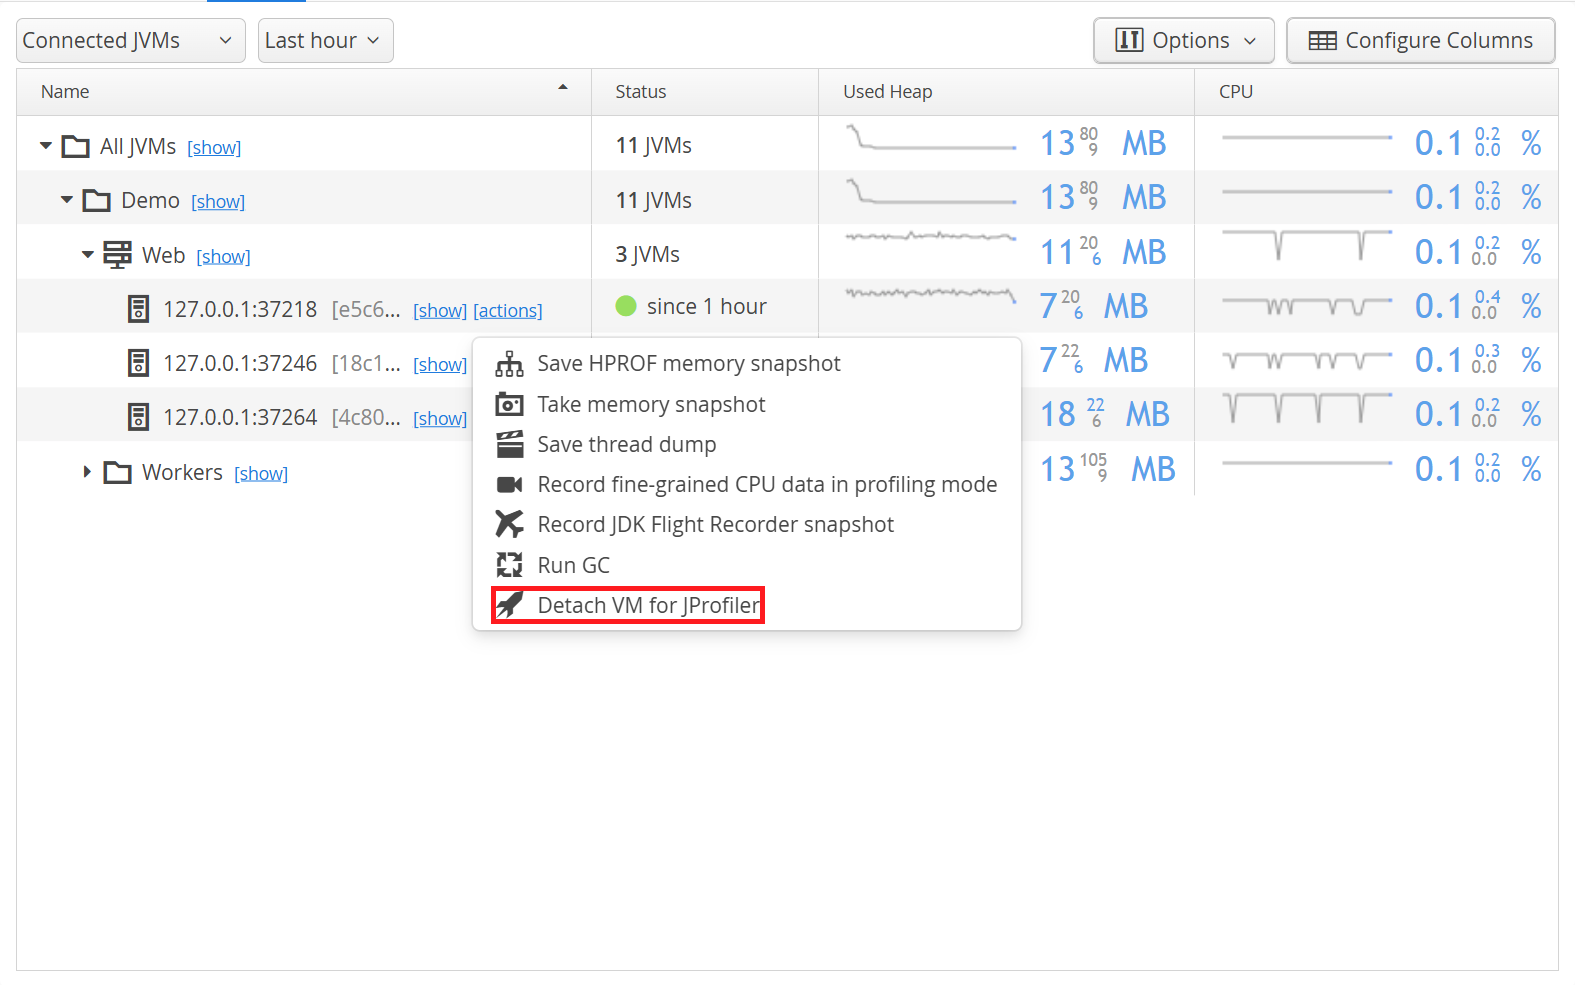
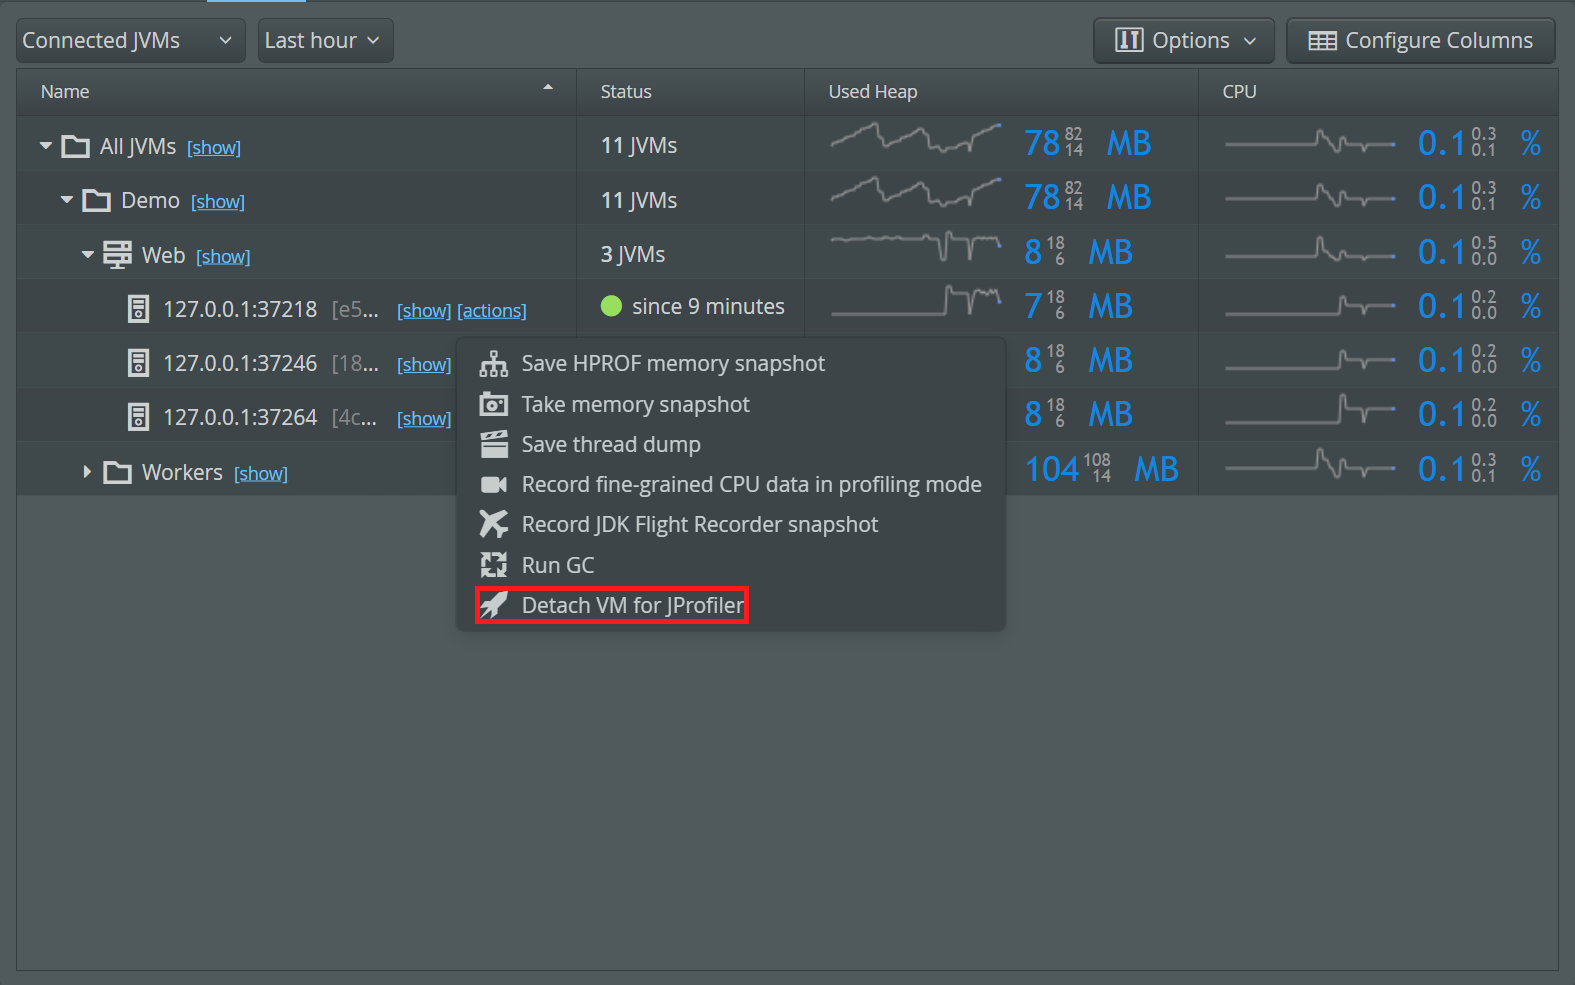
perfino helps you to cross over to full profiling with the minimum amount of intrusion into your production environment. If a JProfiler installation can be found, perfino can load its agent into a monitored VM and prepare it for a connection from the JProfiler GUI. Use the "Detach VM for JProfiler" action in the VMs view to initiate this process. The VM will be detached from perfino and has to be restarted after profiling to reconnect to perfino.
To take advantage of this integration, you have to download the JProfiler archive and extract it in one of the following directories:
- The directory where the
perfino.jarfile has been installed -
The directory
$HOME/.perfinoon Linux/Unix or%USERPROFILE%\.perfinoon Windows, for the user who is running the monitored VM.
The JProfiler archives from the download page contain a single top-level directory named
jprofiler[major version]. The perfino agent sequentially looks for such directories in the above
locations and uses the directory with the highest version number. Any version of JProfiler starting from 8.0.6
can be used for this integration.
If none of the standard directories above are suitable or if you already have a JProfiler installation elsewhere,
you can append the option ,jprofiler=[JProfiler installation directory] to the
VM parameter for monitoring. If the appropriate native library file can be
found in that JProfiler installation, it will be used preferentially, otherwise the perfino agent will continue
to look in the standard directories.
If no JProfiler installation can be found, specific instructions for integrating JProfiler are given. You can download and extract JProfiler on the machine where the monitored VM is running and execute the "Detach VM for JProfiler" action again, there is no need to restart the monitored VM.
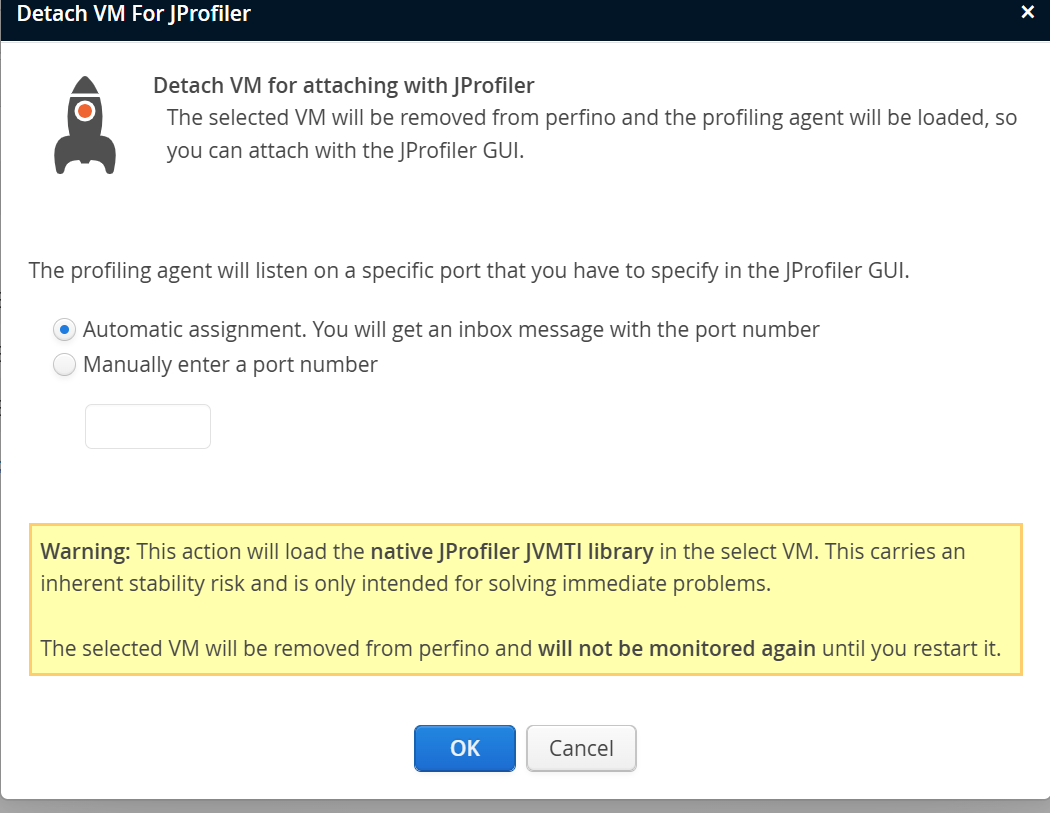
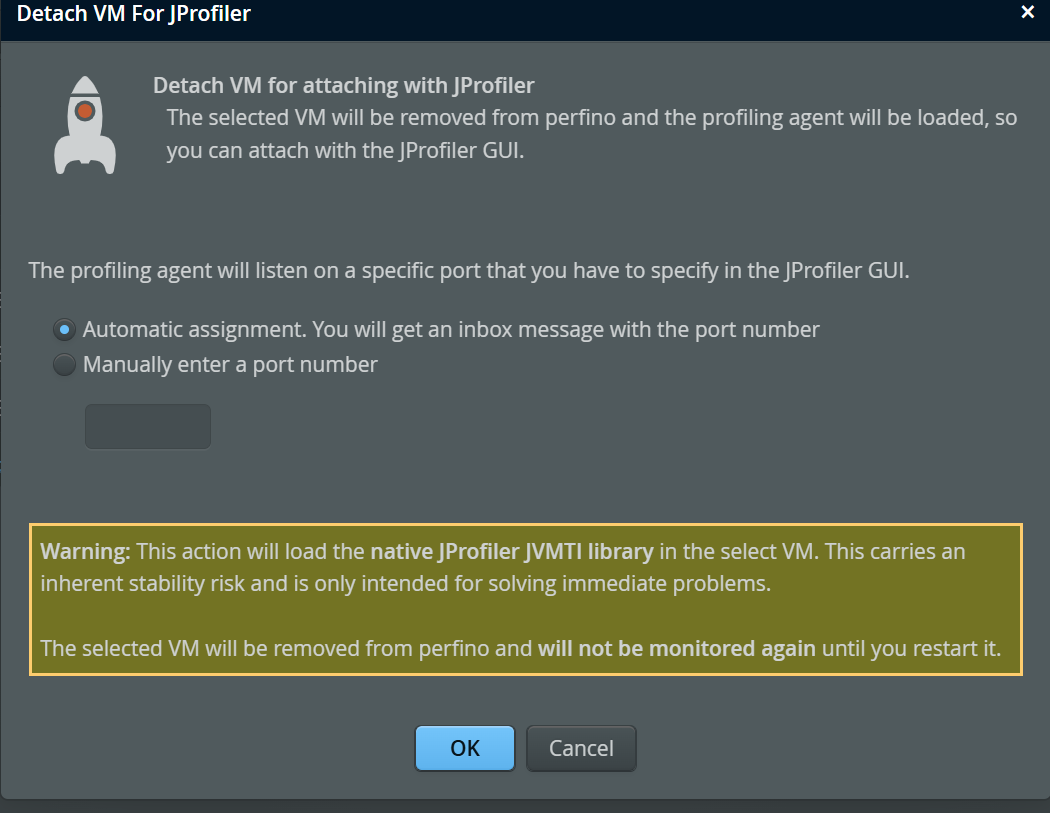
If JProfiler was found, a confirmation dialog is shown, where you get the chance to configure the profiling port to which the JProfiler GUI will attach. You can either enter the desired port number yourself or let perfino find a free port for you. In the latter case, an inbox message will be sent to you with the actual port number.
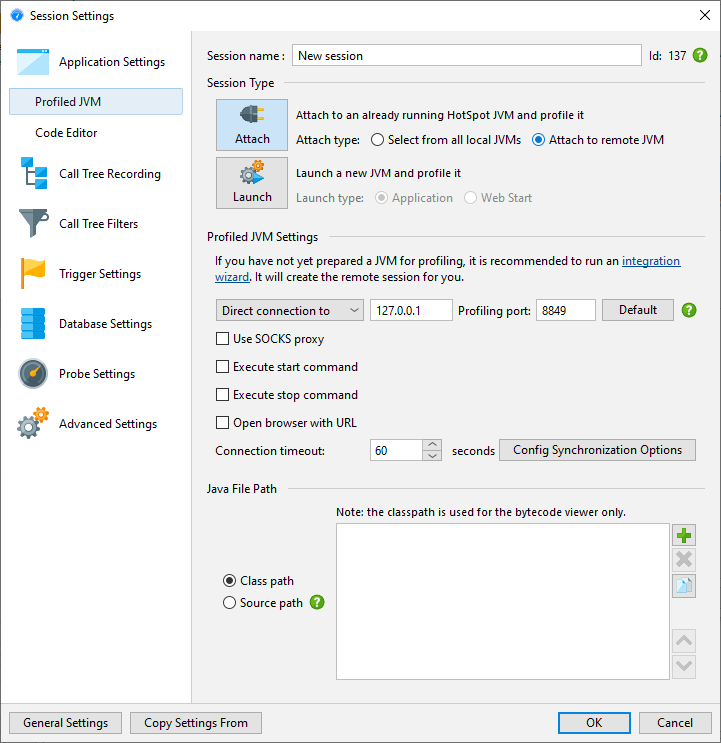
In JProfiler, create a new session of type "Attach to profiled JVM (local or remote)" and enter the IP address or host name where the VM is running as well as the port on which the profiling agent is listening.
perfino will stop monitoring the VM when you prepare it for profiling. To monitor it again, you have to restart the JVM.
Recording JFR snapshots
An alternative mechanism to get more low-level information on a monitored VM is to record a
JDK Flight Recorder (JFR) snapshot.
The Java version of the monitored VM has to be 11+, and the JRE has to
include the module jdk.jfr. JFR recording can have very low overhead because it does not activate
the JVMTI. Also, it does not interfere with perfino monitoring in any way.
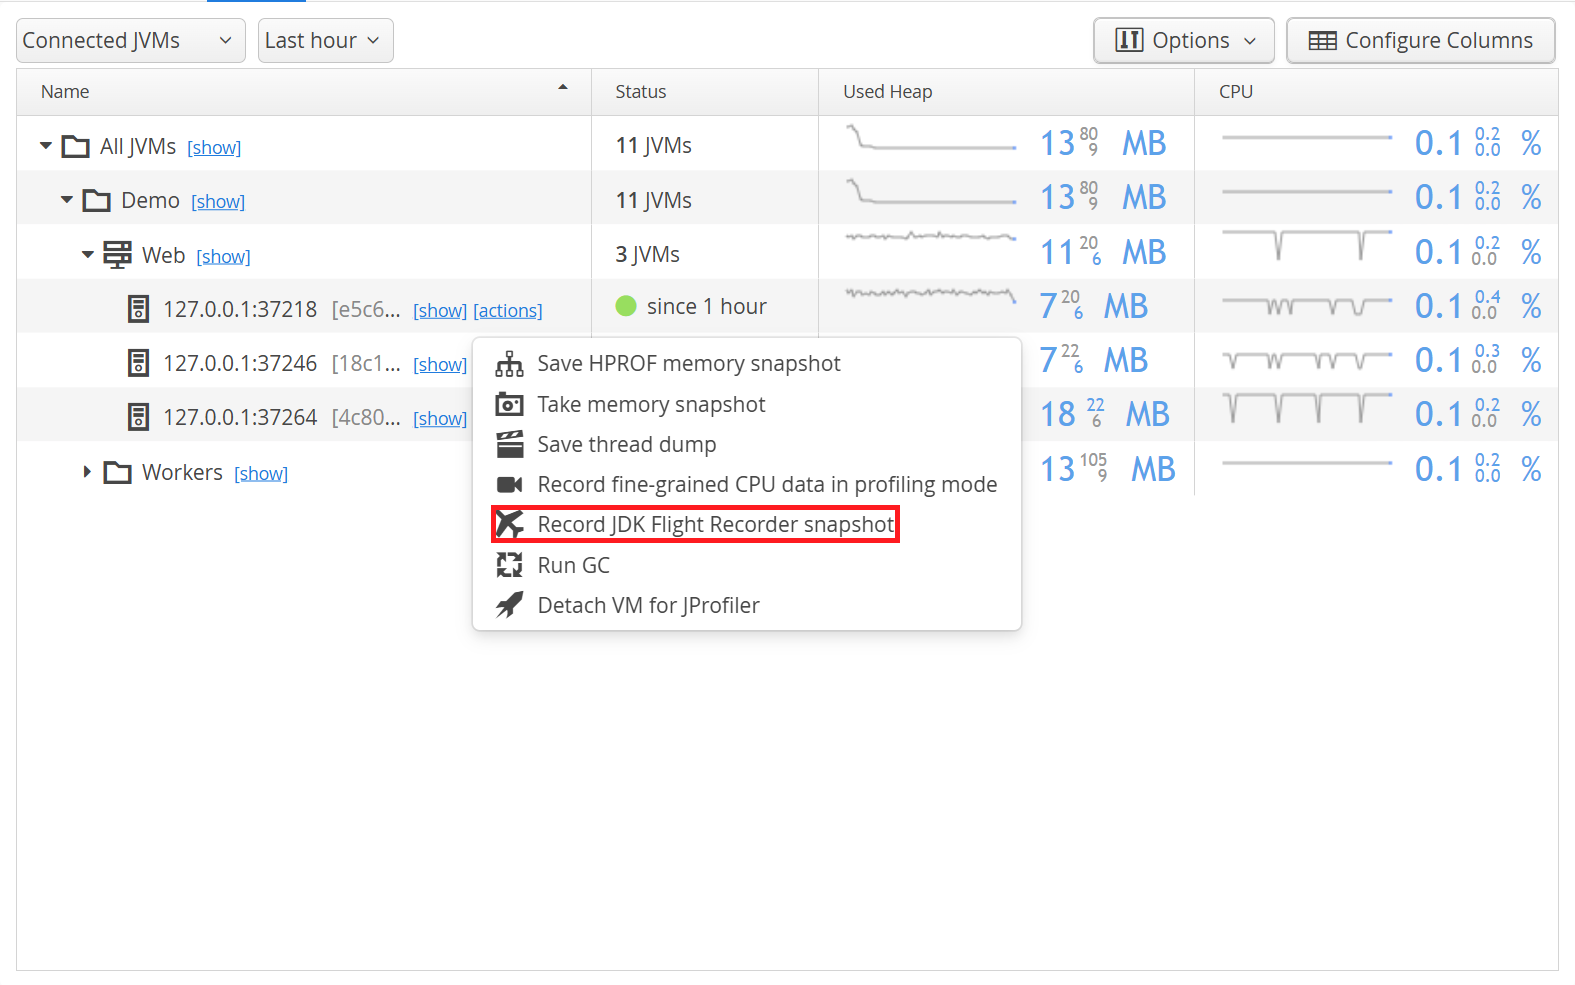
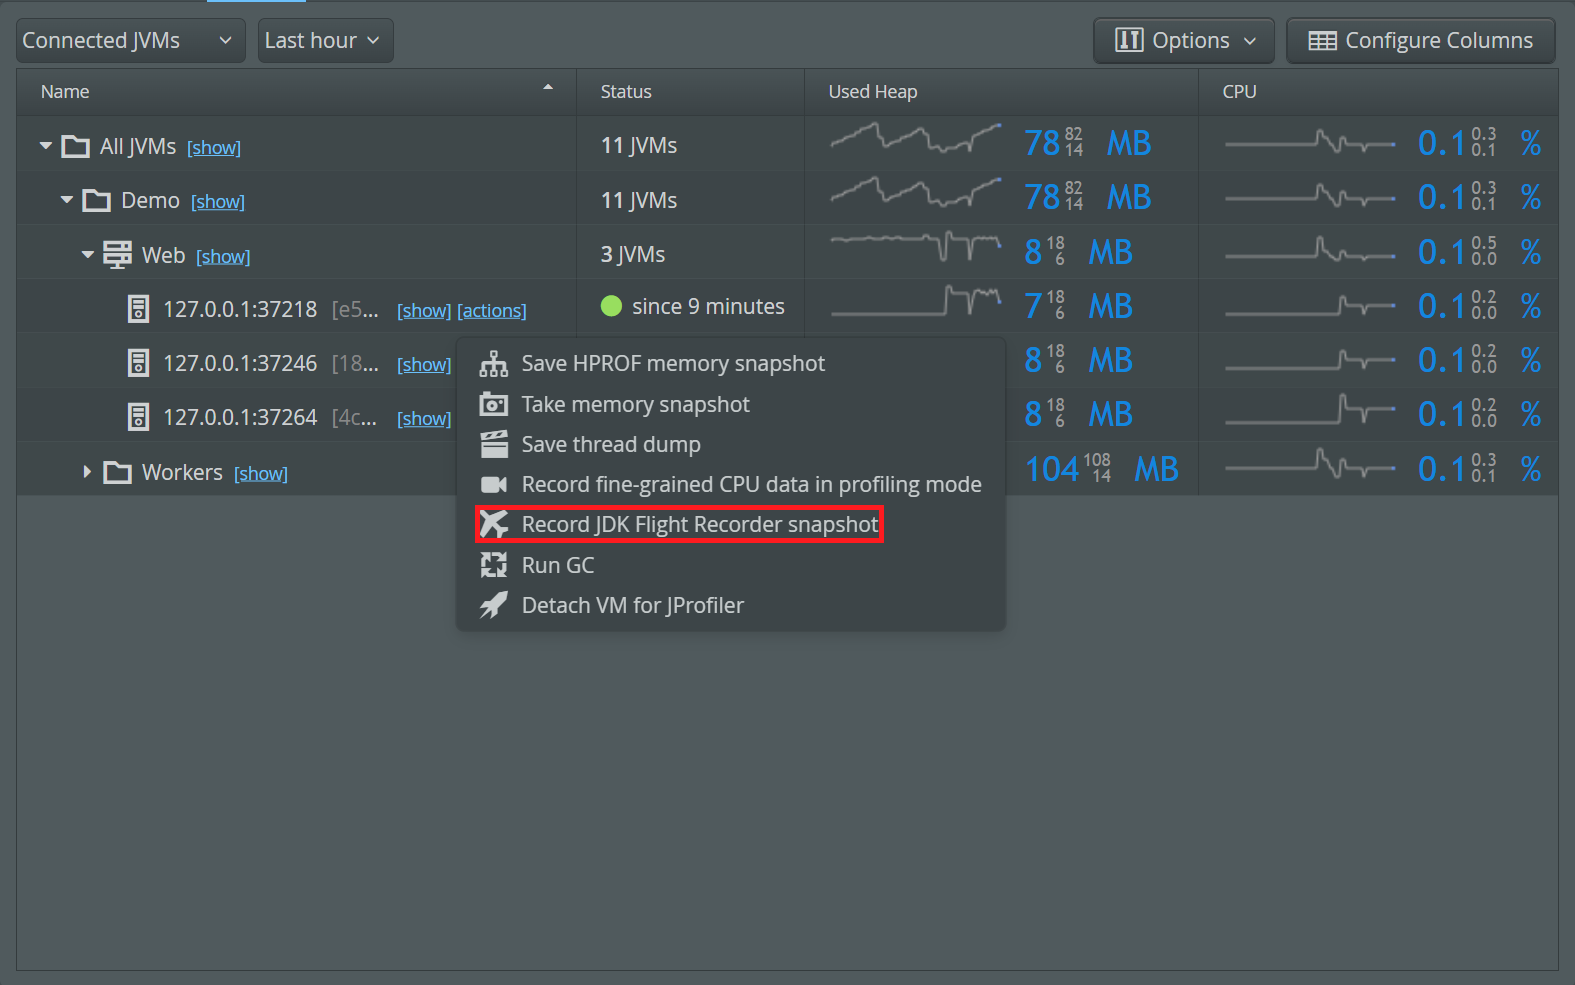
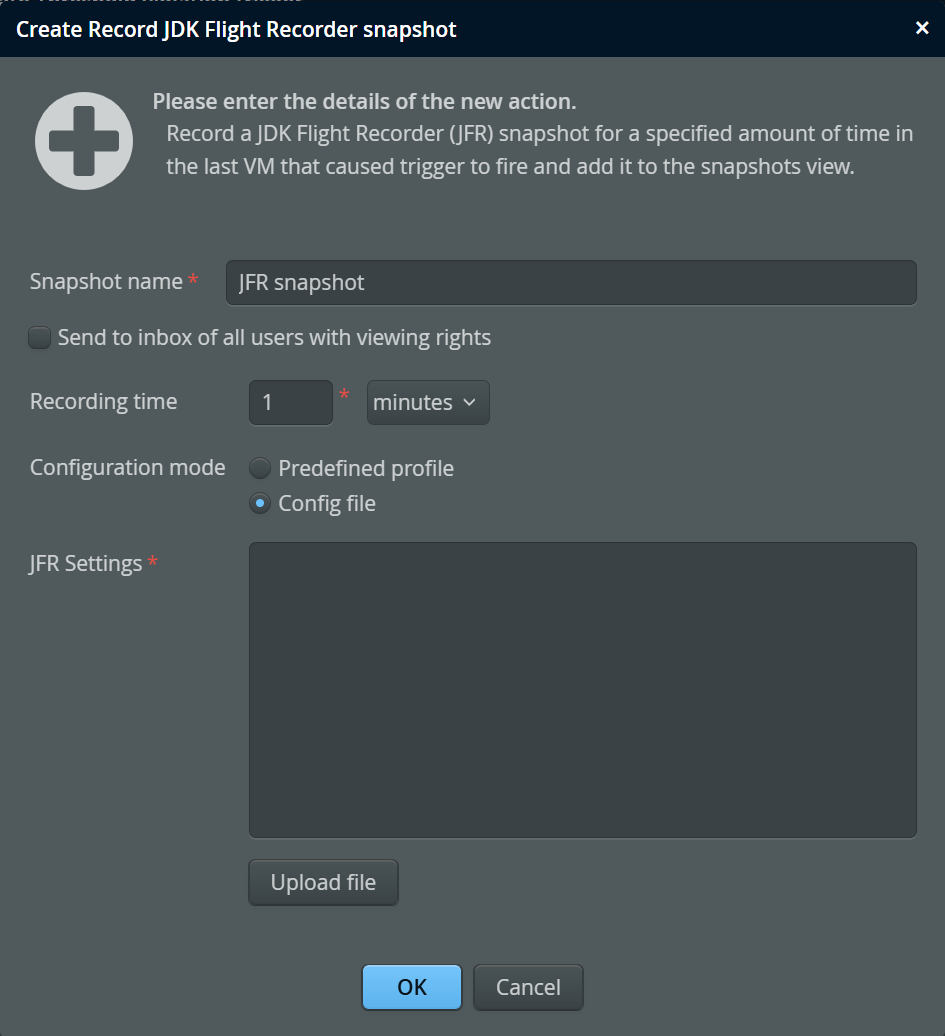
To record a JFR snapshot, go to the VMs view, click on the "actions" link next to the VM and select "Record JDK Flight Recorder snapshot".
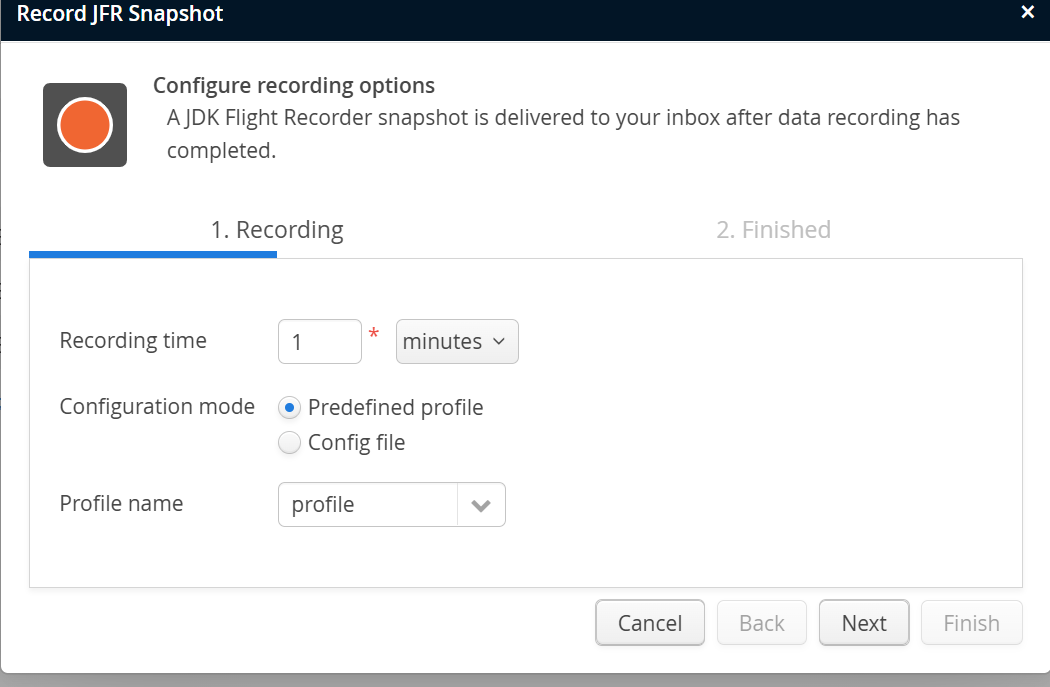
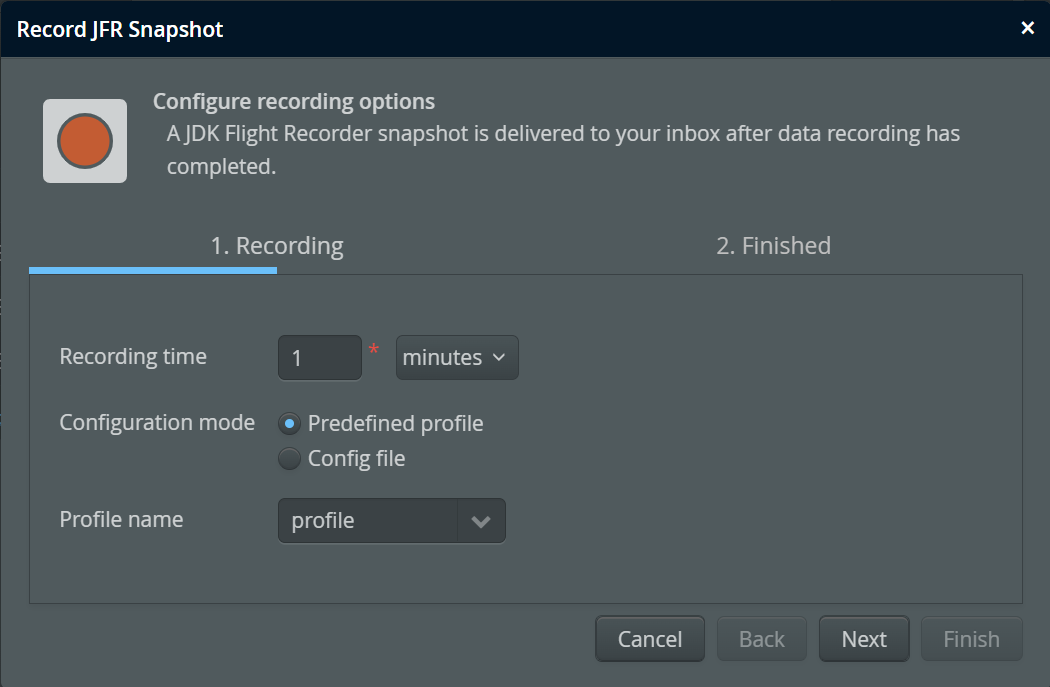
Besides configuring the duration of the JFR recording, you can choose a predefined setting or upload a
.jfc settings file that was exported from the "Flight recording template manager" in
JMC. The two predefined settings that are guaranteed to exist
are "default" and "profile". perfino suggests to use "profile" by default, because it records more relevant
information. Other settings can be predefined by placing .jfc files in the lib/jfr
directory of the JVM that is monitored. If you upload a settings file, make sure that is created for a
compatible Java version.
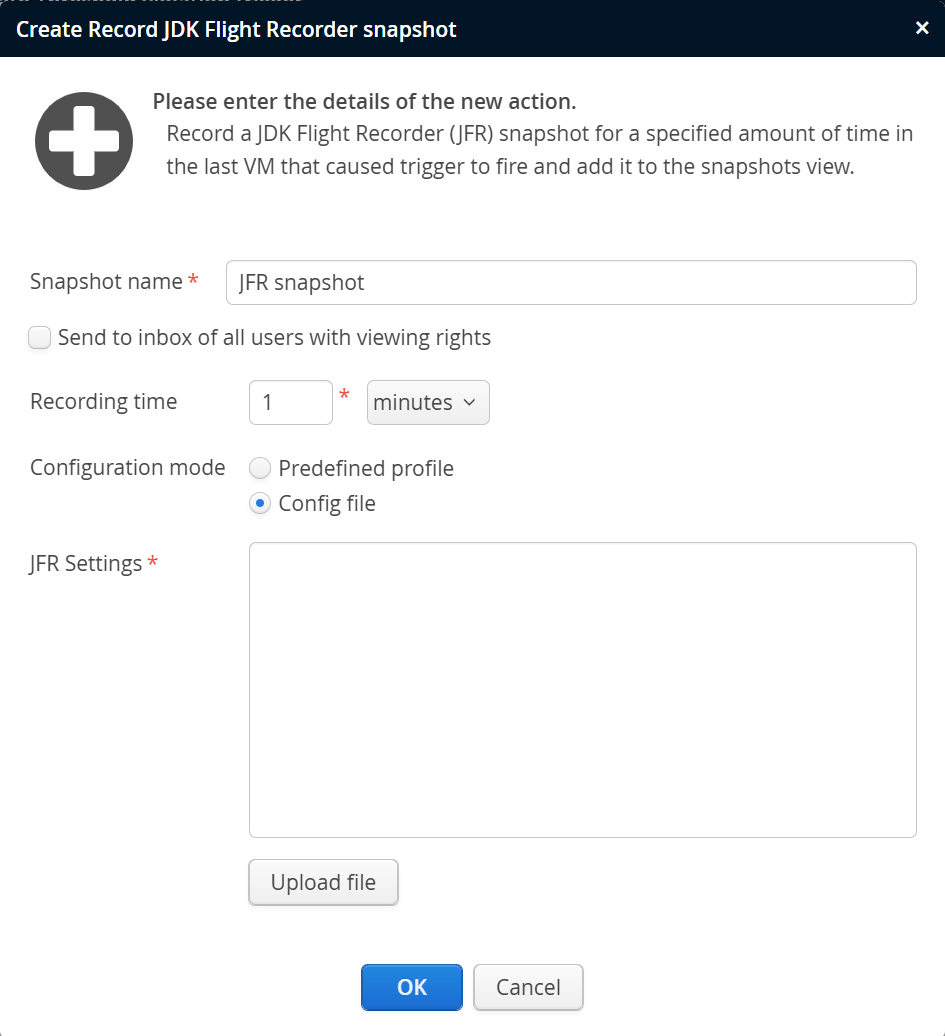
As with the other recordings above, JFR snapshots can also be recorded automatically with triggers and the corresponding trigger action for JFR recording.
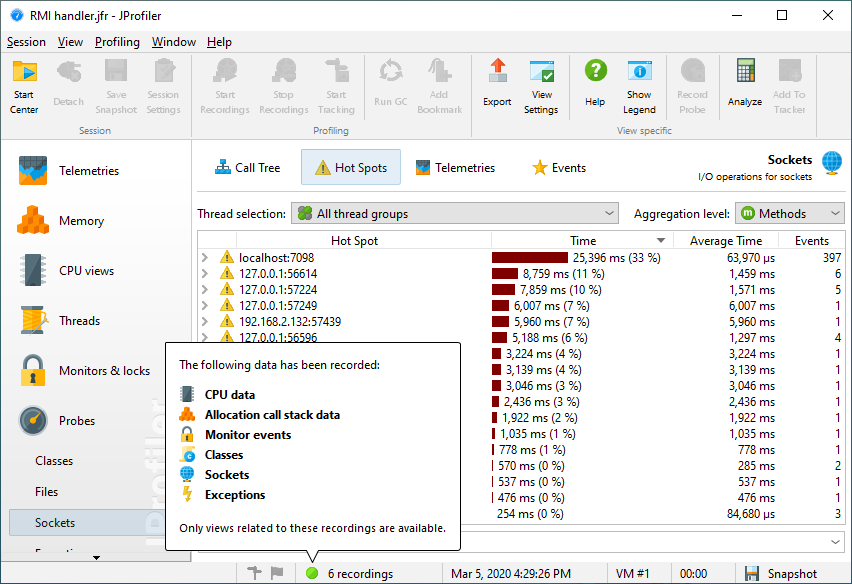
While you can use JMC to view JFR snapshots, we recommend using JProfiler, just like for CPU snapshots. In addition to CPU, allocation, and monitor recordings, JProfiler shows a number of probes that are constructed from JFR events.