Memory analysis in perfino is always on a per-VM level. Two kinds of memory snapshots can be taken and analyzed: Low-overhead memory snapshots and HPROF snapshots.
Memory snapshots
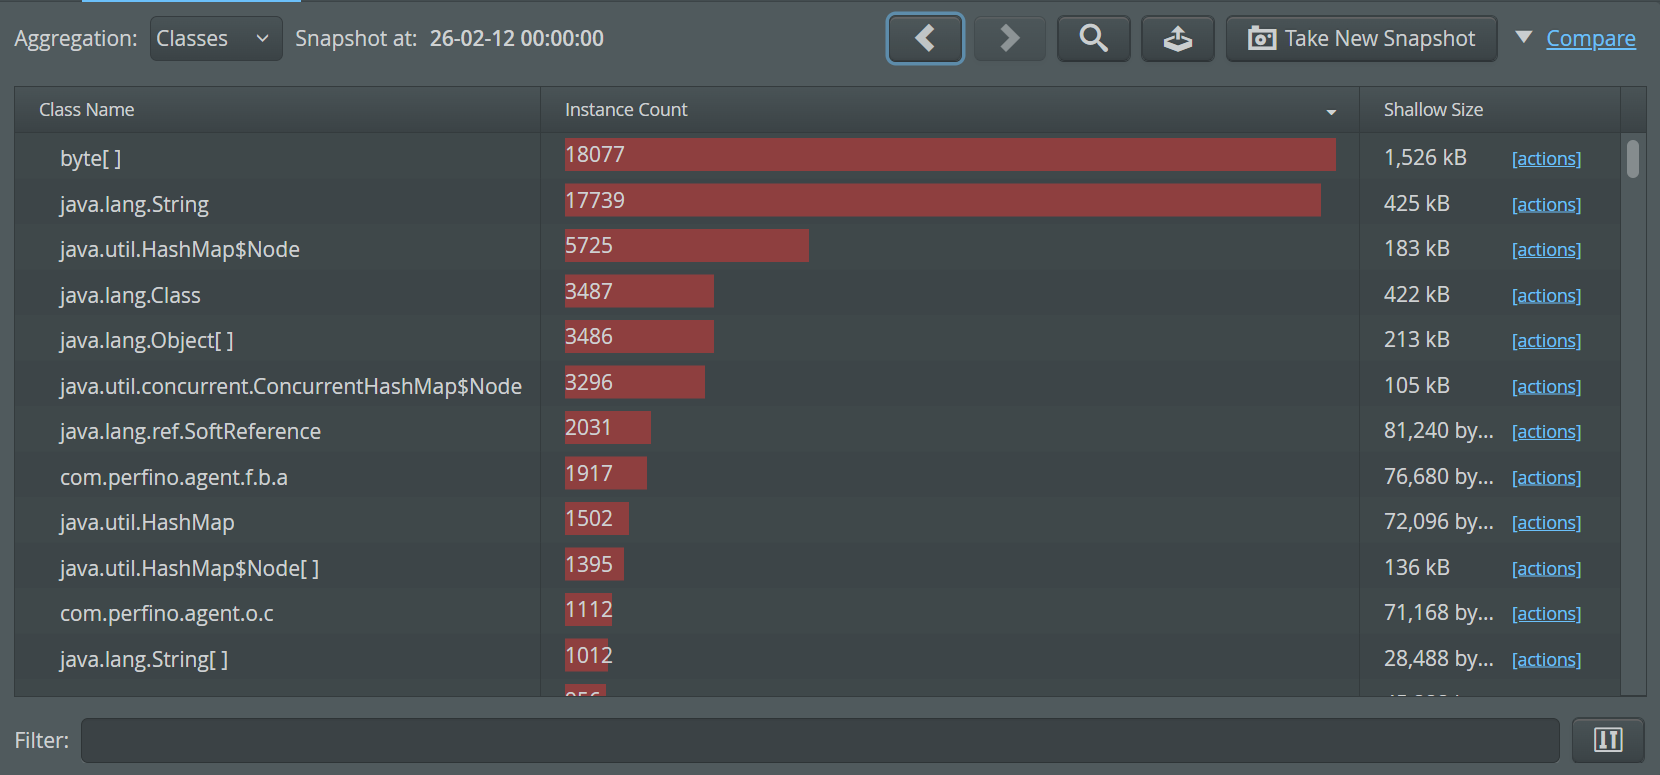
Low overhead memory monitoring is only possible at a "shallow" level. The JVM knows about loaded classes, and instance counts and exposes this information. There is no kind of reference information available, which is important for solving memory leaks. Nevertheless, classes and instance counts give you a good initial overview of the memory consumption inside a JVM. For historical comparisons, plotting the instance count of a particular class against time often shows important trends.
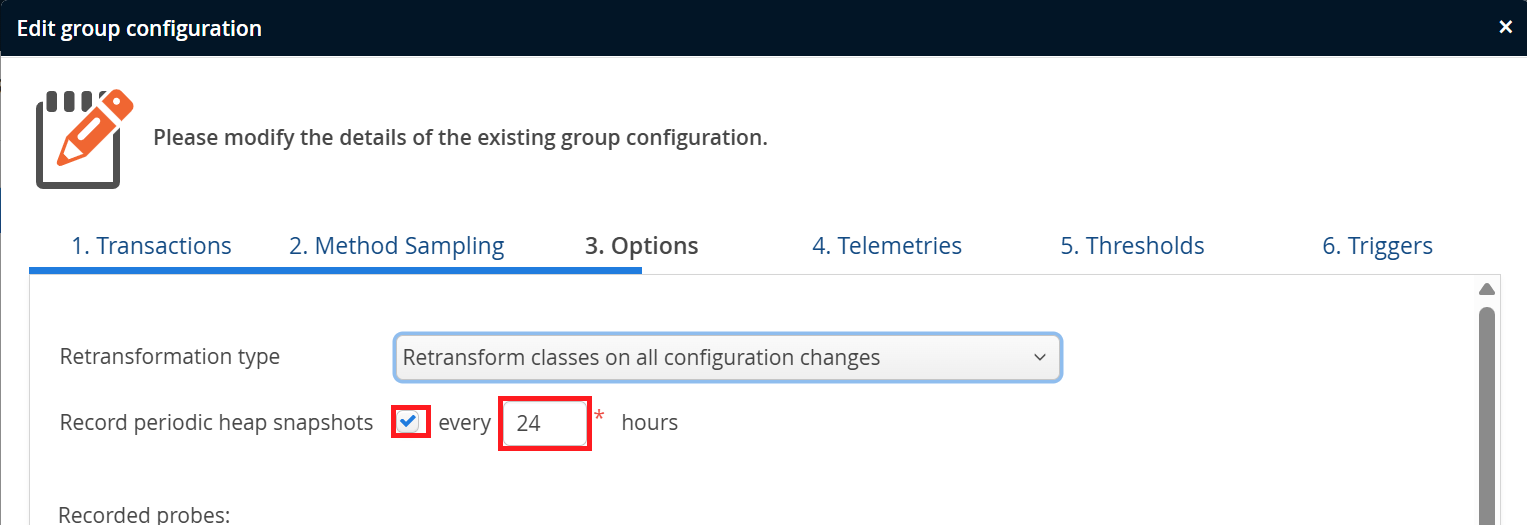
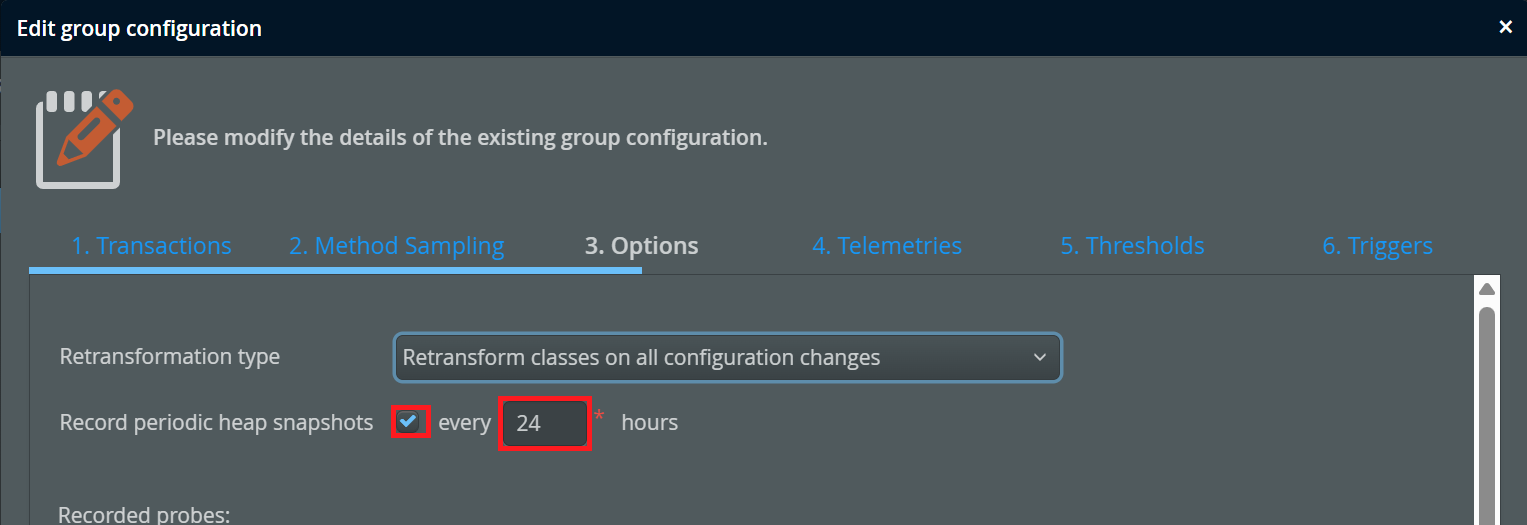
To get a basis for historical comparisons, memory snapshots are recorded once per day. This default can be changed on the "Recording" step of the VM group configuration. You can change the period for memory snapshot recording or disable it altogether.
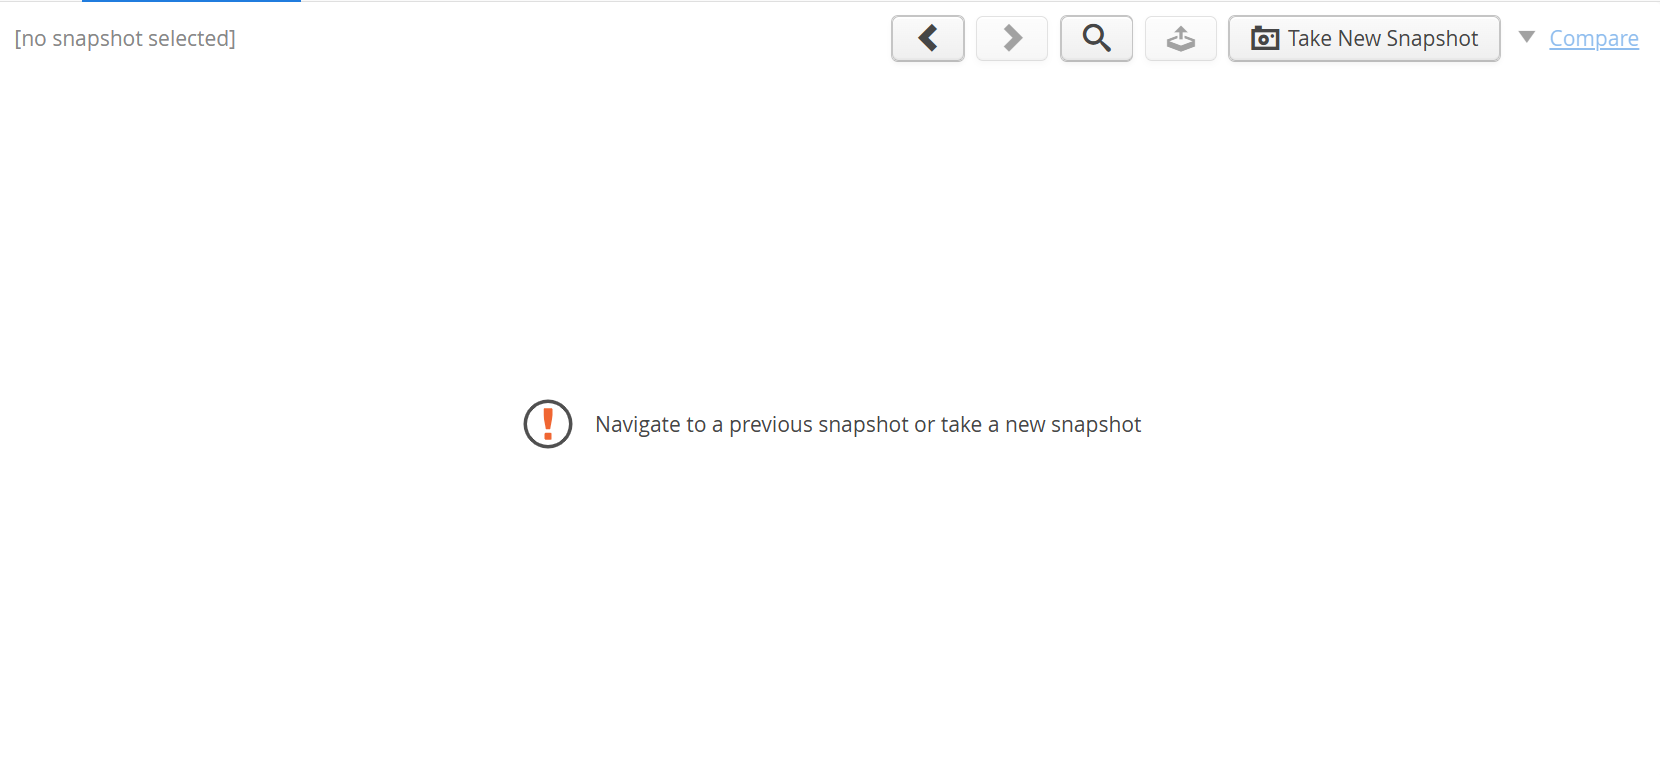
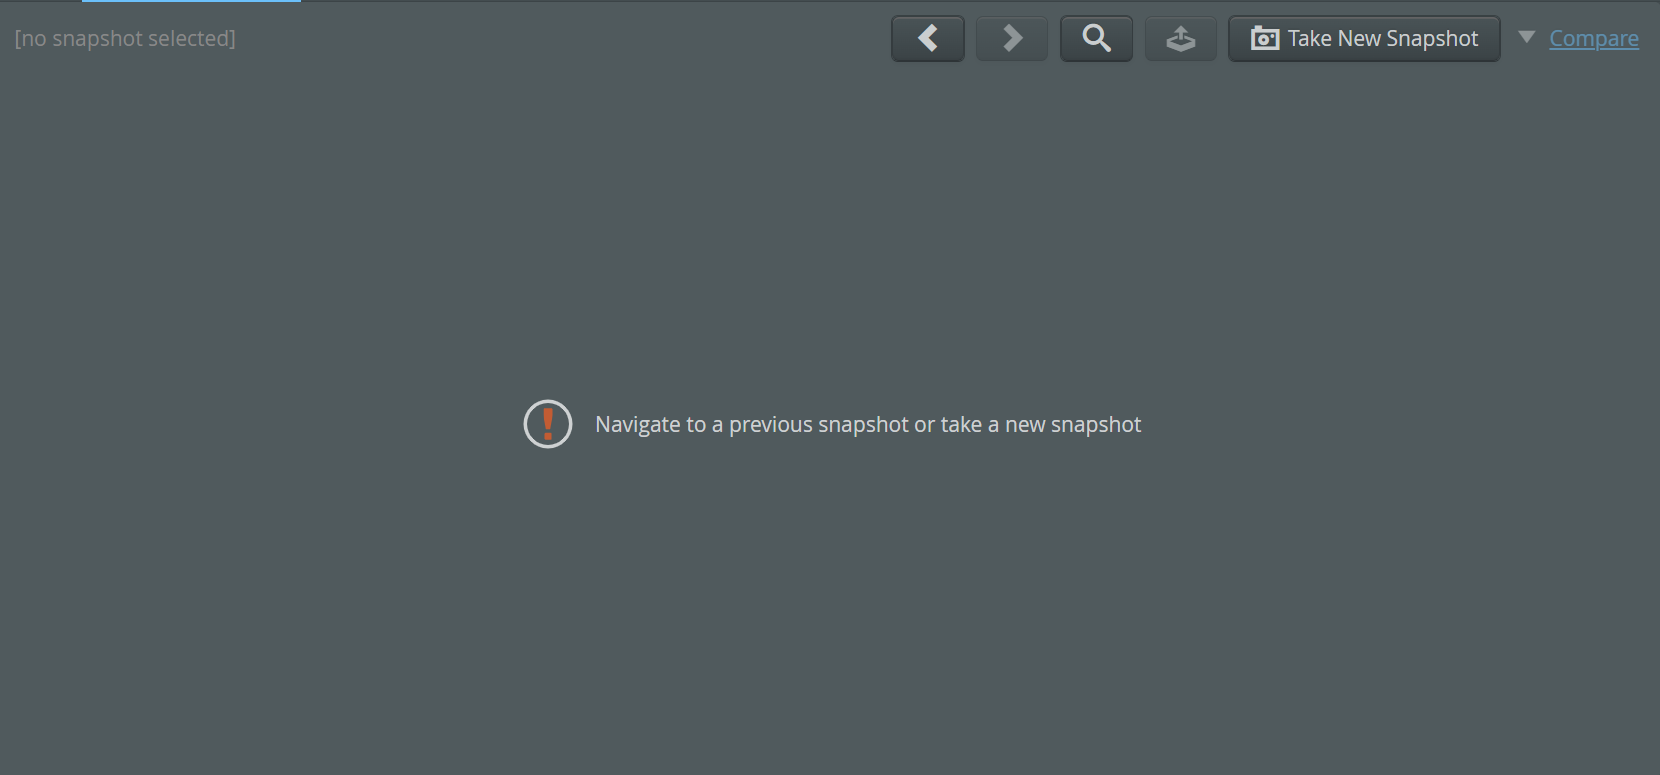
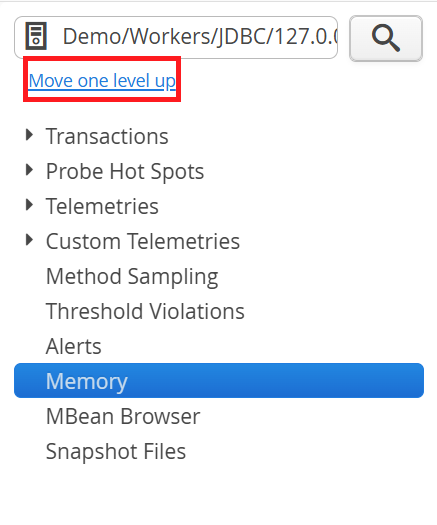
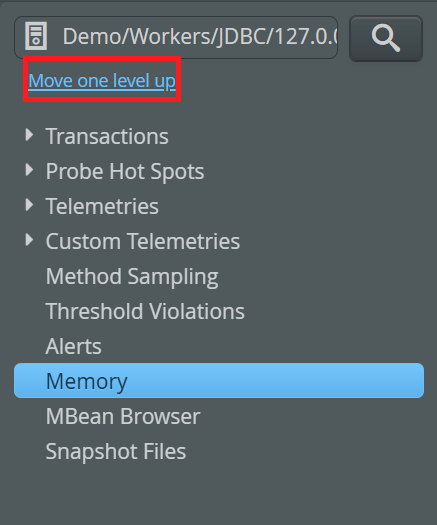
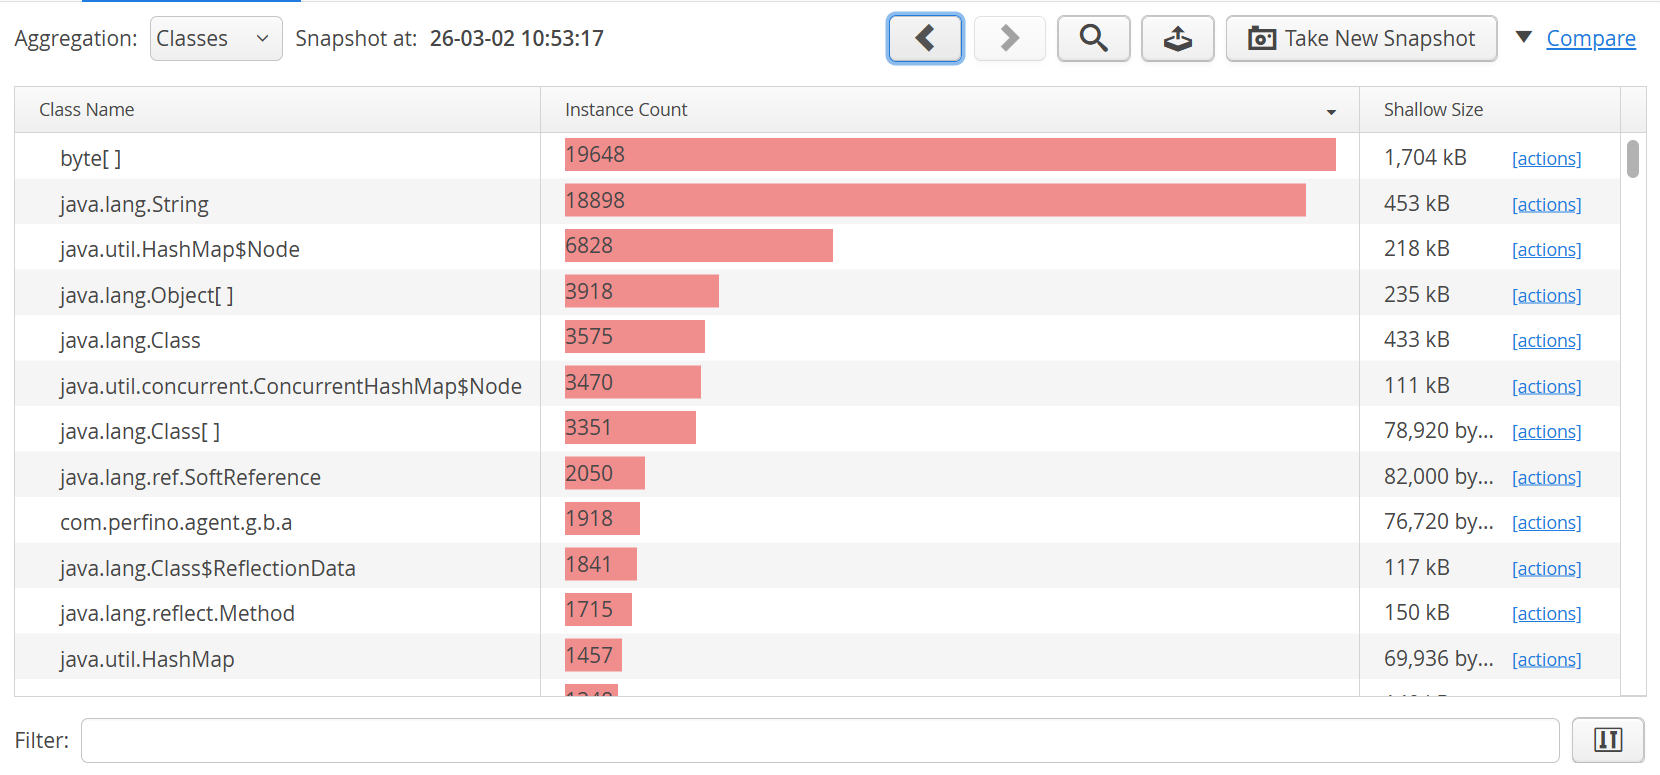
When you open the "Memory" view in the "VM data views", you are required to select a single VM or a VM pool with the VM selector in the top-left corner. After you make this choice, the navigation controls in the top right corner are enabled and you can move to the most recent snapshot with the Previous button.
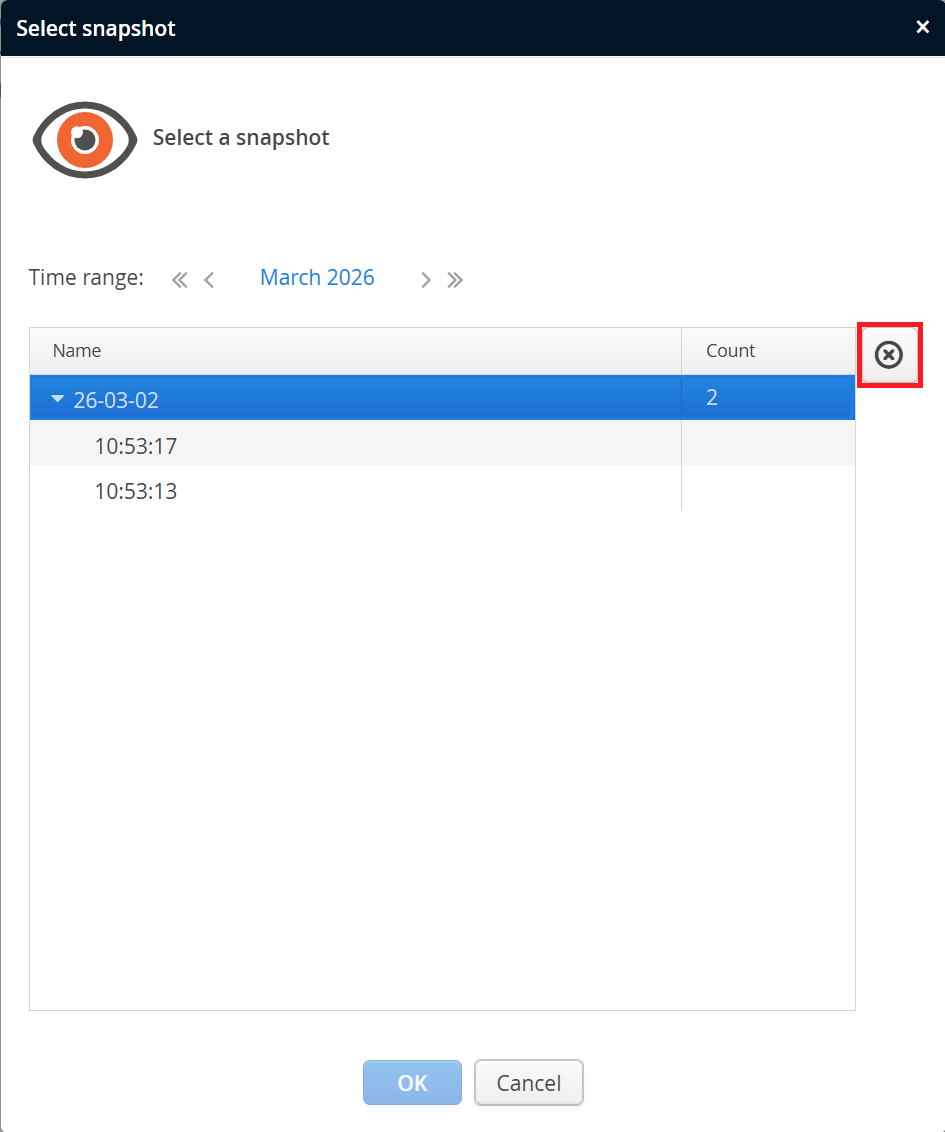
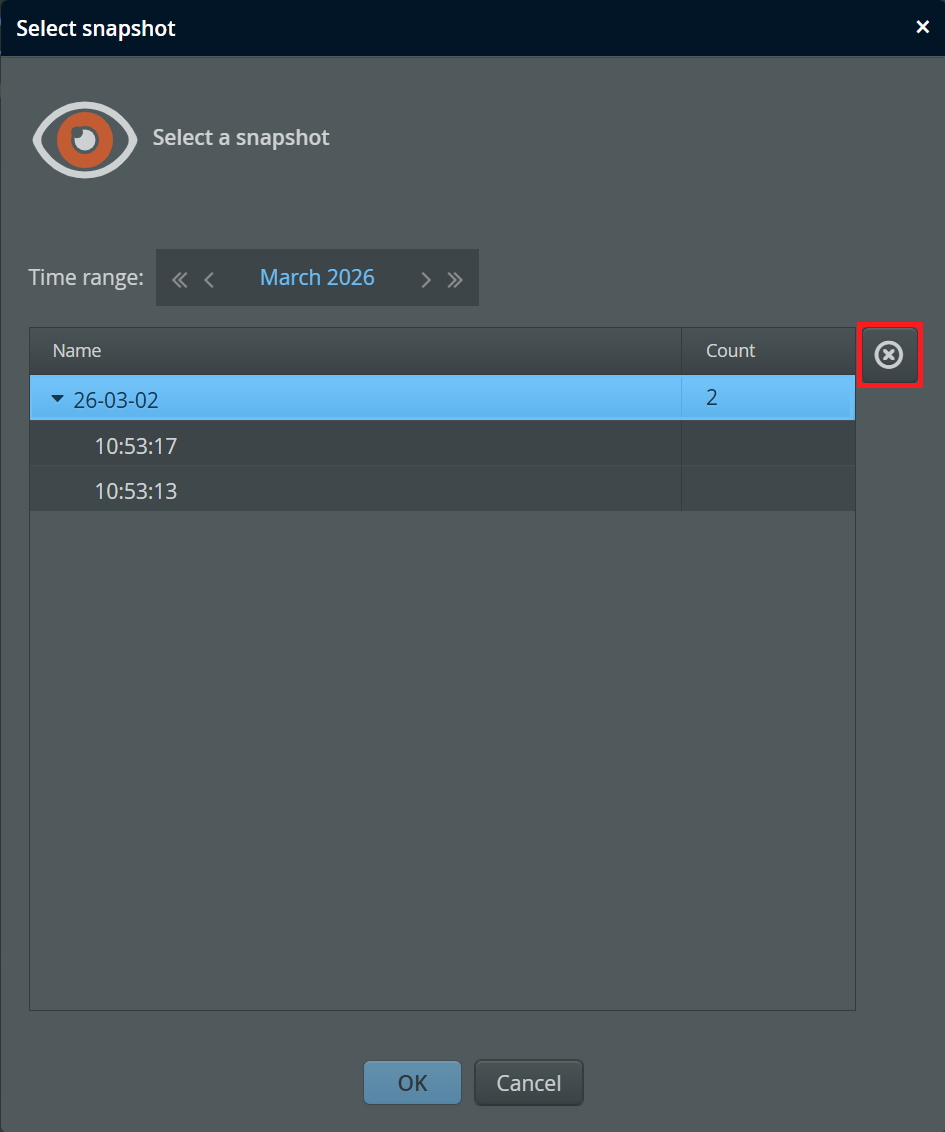
If you select a VM pool, you must select a specific snapshot. In this way, you also narrow your focus to a particular VM from the VM pool, and the VM selection will be set to that VM for all VM data views. To move back to the entire pool, simply click on the "Move one level up" link below the VM selector.
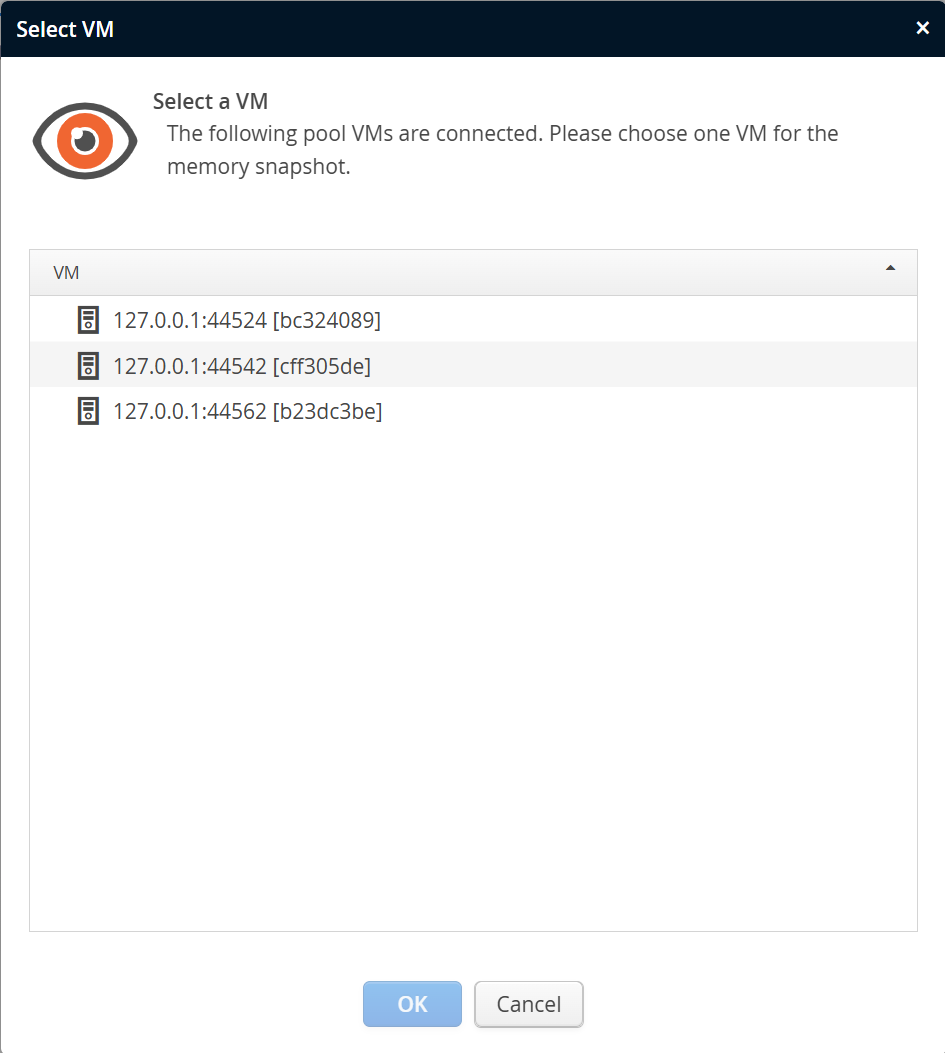
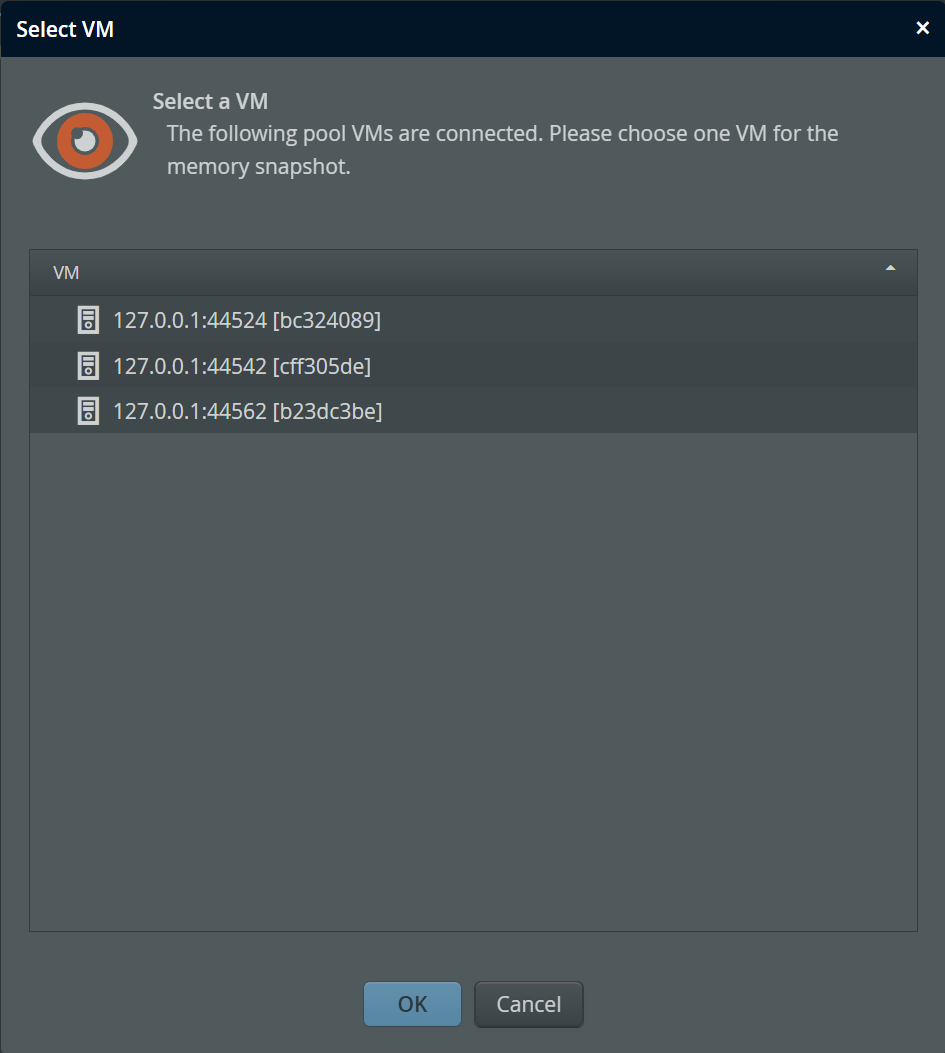
The record button takes a new snapshot and displays it immediately. Since periodic snapshots are taken quite rarely, this strategy may be necessary if you want to analyze a current situation.
If you have selected a VM pool, perfino asks you for which VM the snapshot should be taken. Just as when selecting an existing snapshot for a VM pool, the VM selection is then changed to that particular VM.
A memory snapshot is a list of loaded classes together with their instance counts and shallow sizes. "Shallow" size means that only the direct size of the object is counted. This includes pointer sizes for referenced objects, but not the referenced objects themselves. Any other size calculations like deep size or retained size would require information about references which are not available with this low-overhead technique.
The snapshot selector shows you all memory snapshots that are stored in perfino for the current VM selection. This is also the place to delete snapshots.
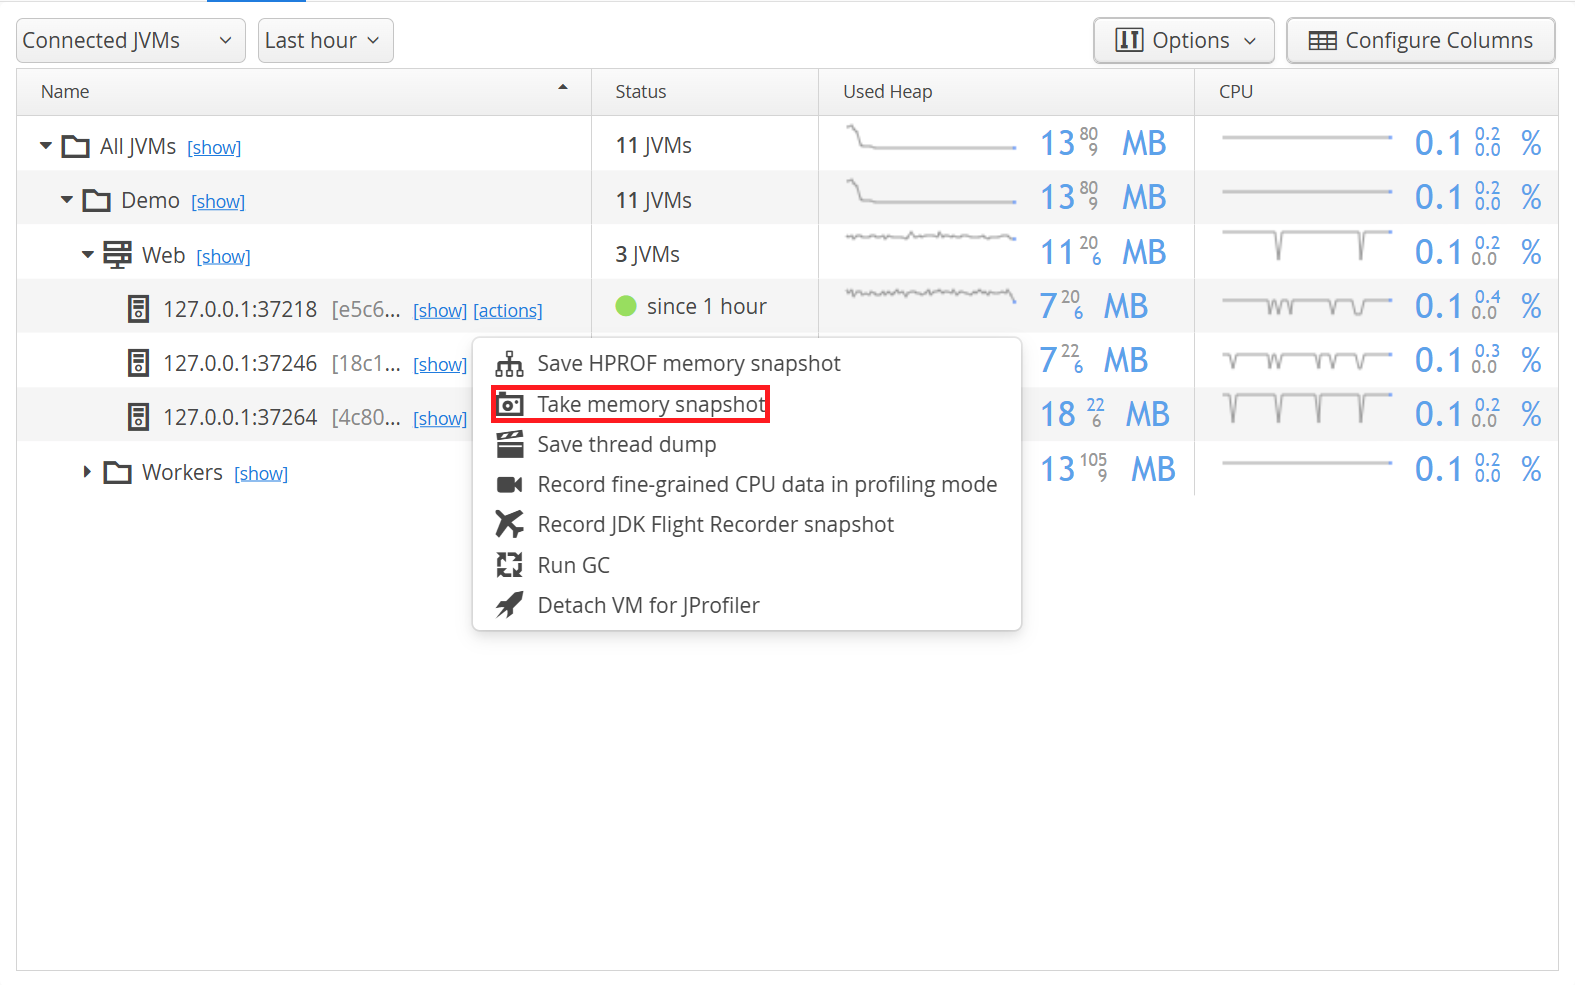
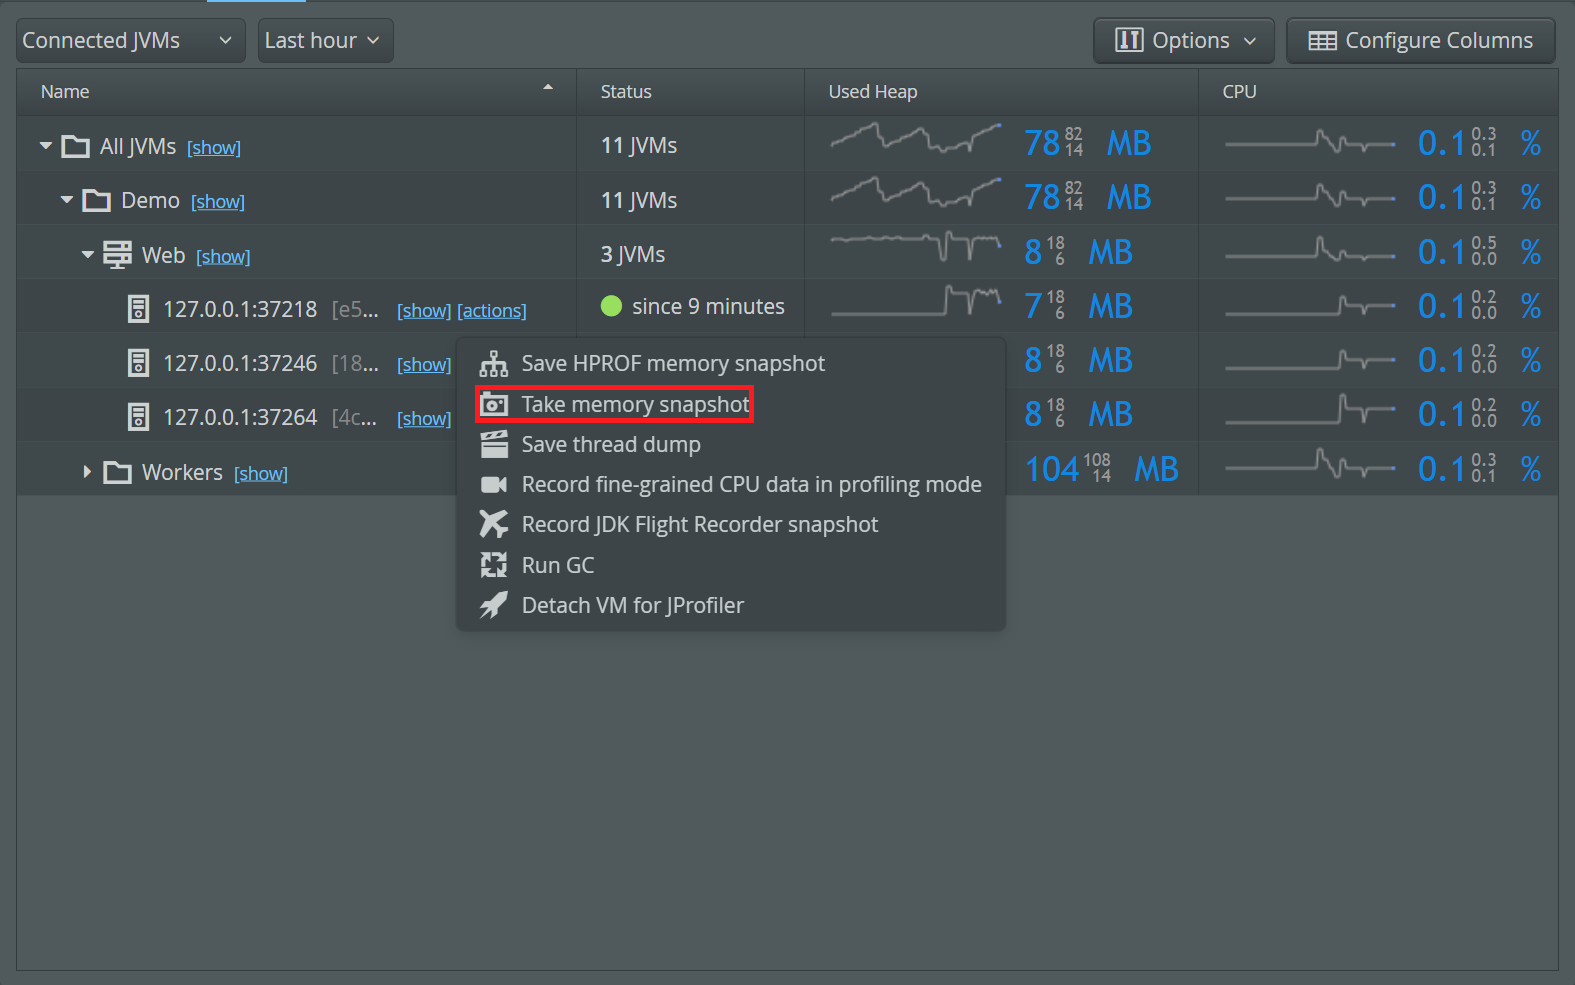
You can also take memory snapshots with the corresponding trigger action or by clicking on the "actions" link next to a VM in the VMs view and selecting "Take memory snapshot".
HPROF snapshots
Advanced memory analysis that can give answers to questions like
- What is the cause for the memory leak in my application?
- My application needs a lot of memory, how can I reduce memory consumption?
- Where does this class loader leak come from?
require a full heap dump.
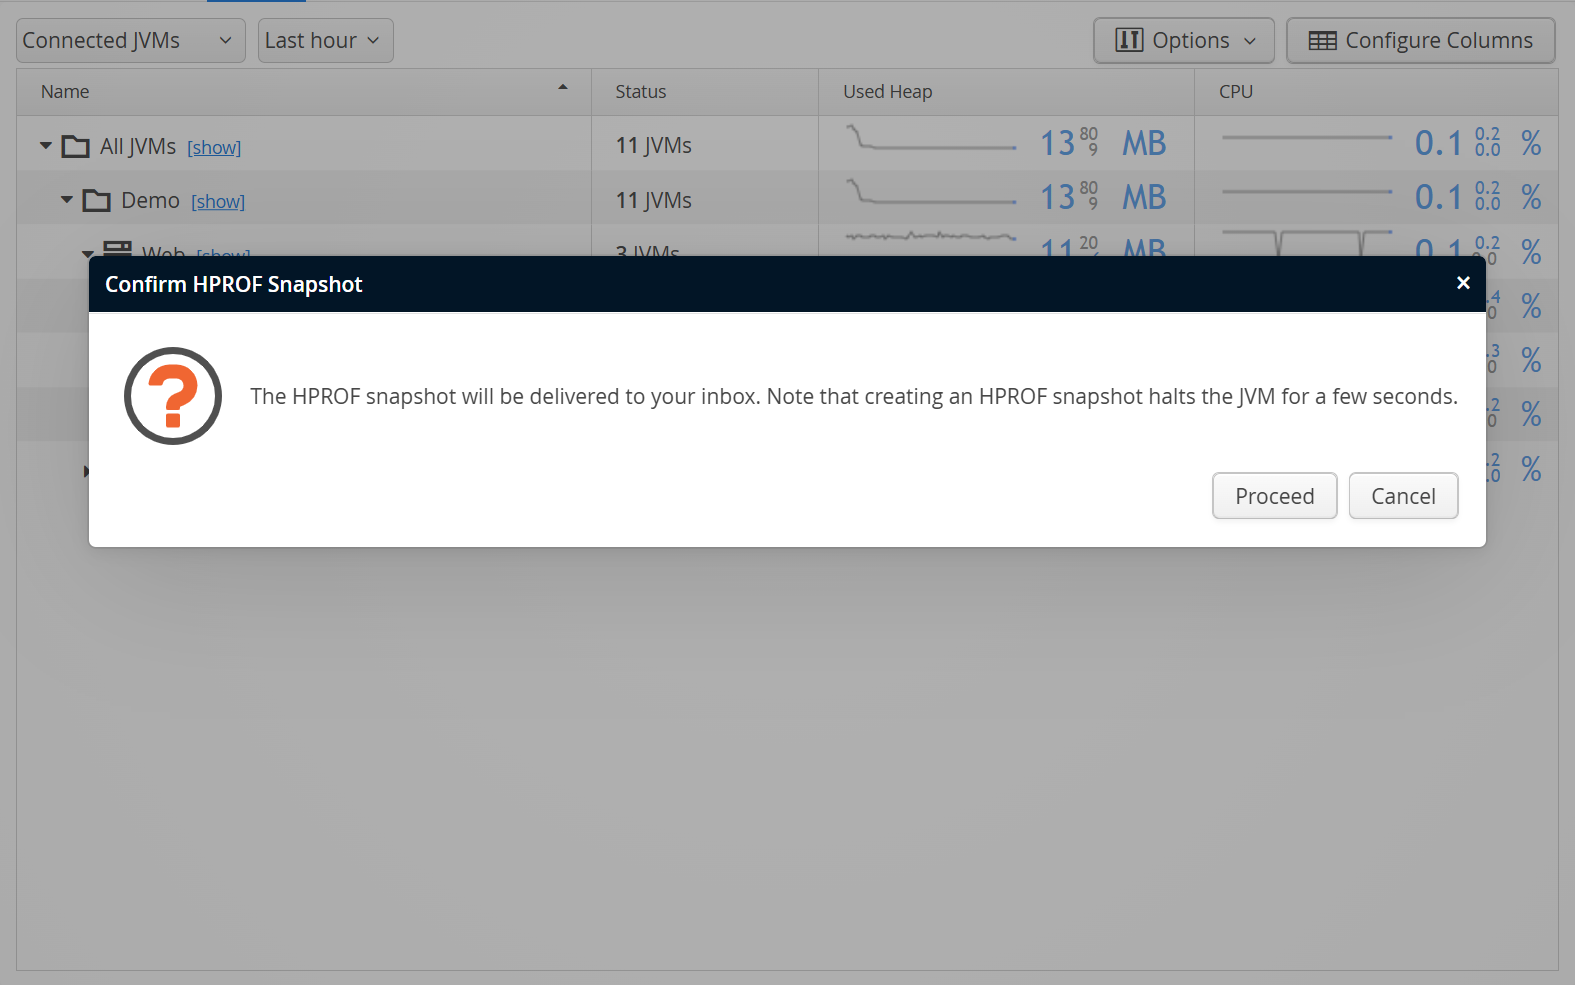
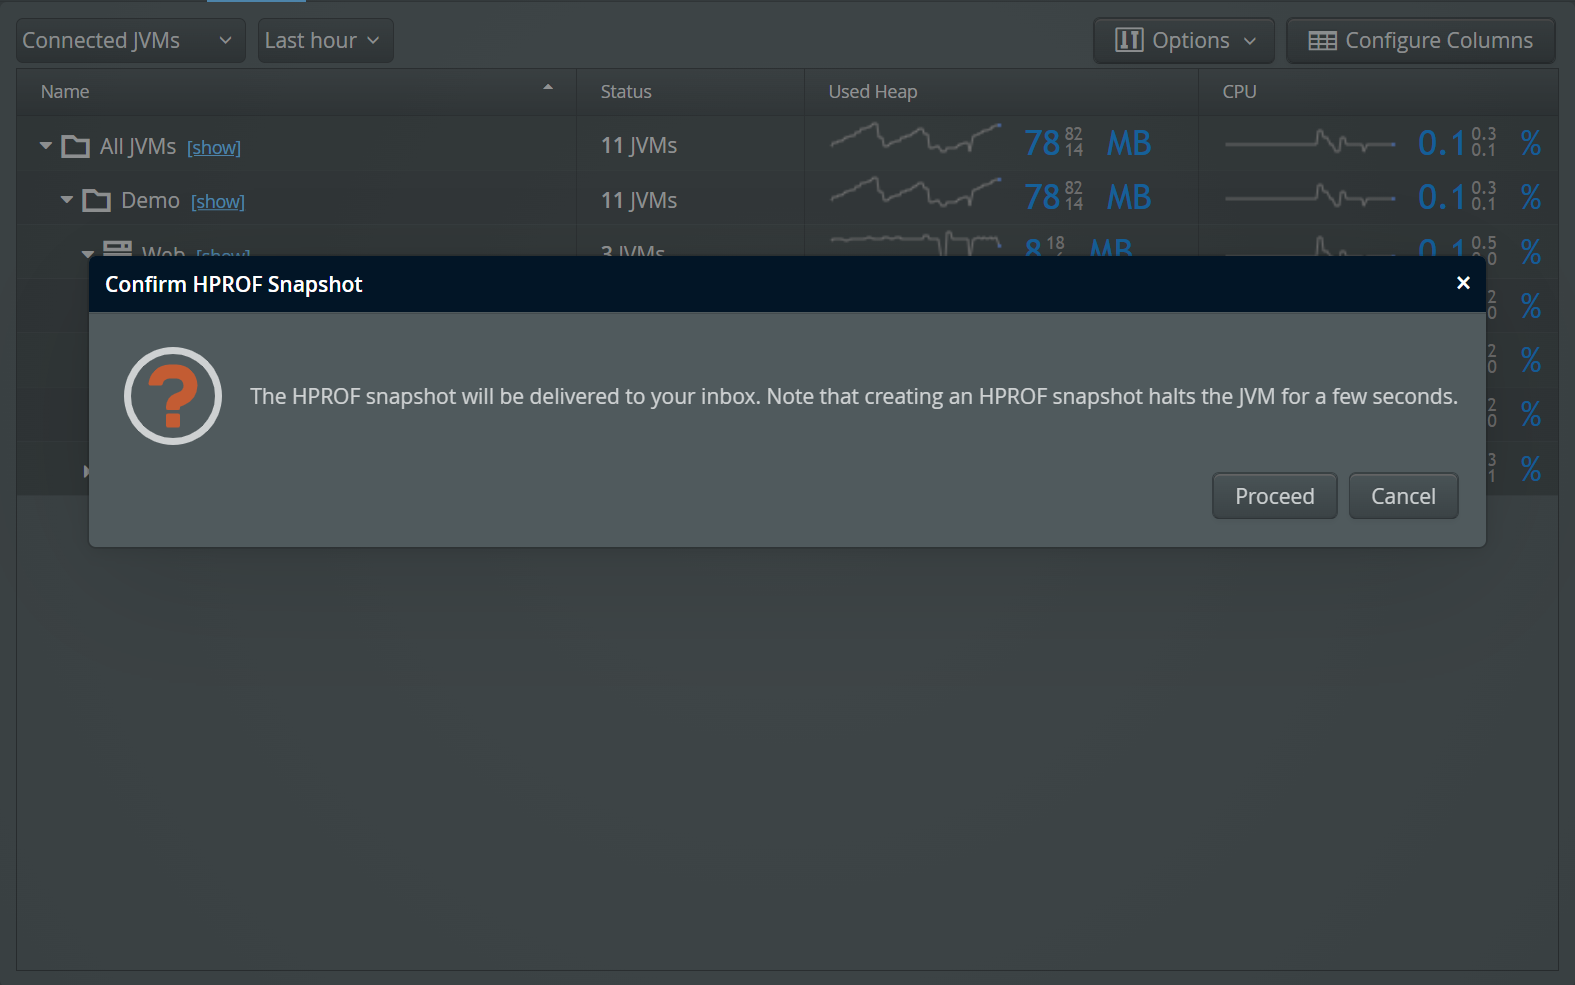
The JVM can save memory snapshots directly in a format called HPROF without the help of native JVMTI profiling agents. Saving HPROF snapshots is a low-risk operation, but during the time that such a snapshot is saved, the JVM is slowed down or temporarily halted.
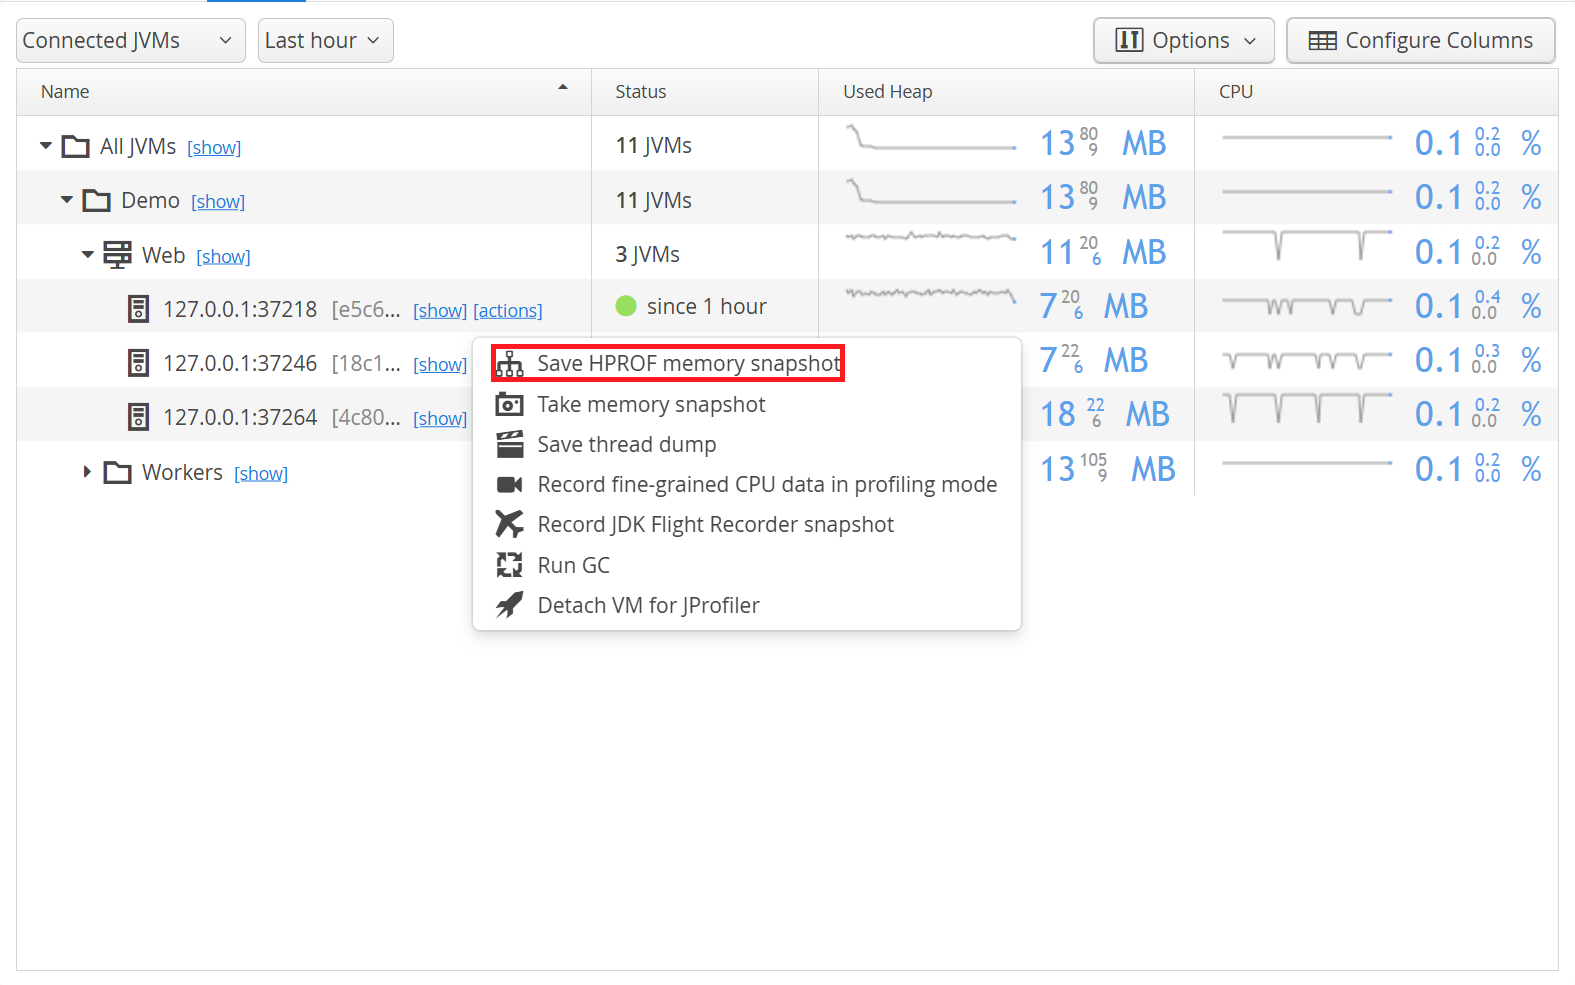
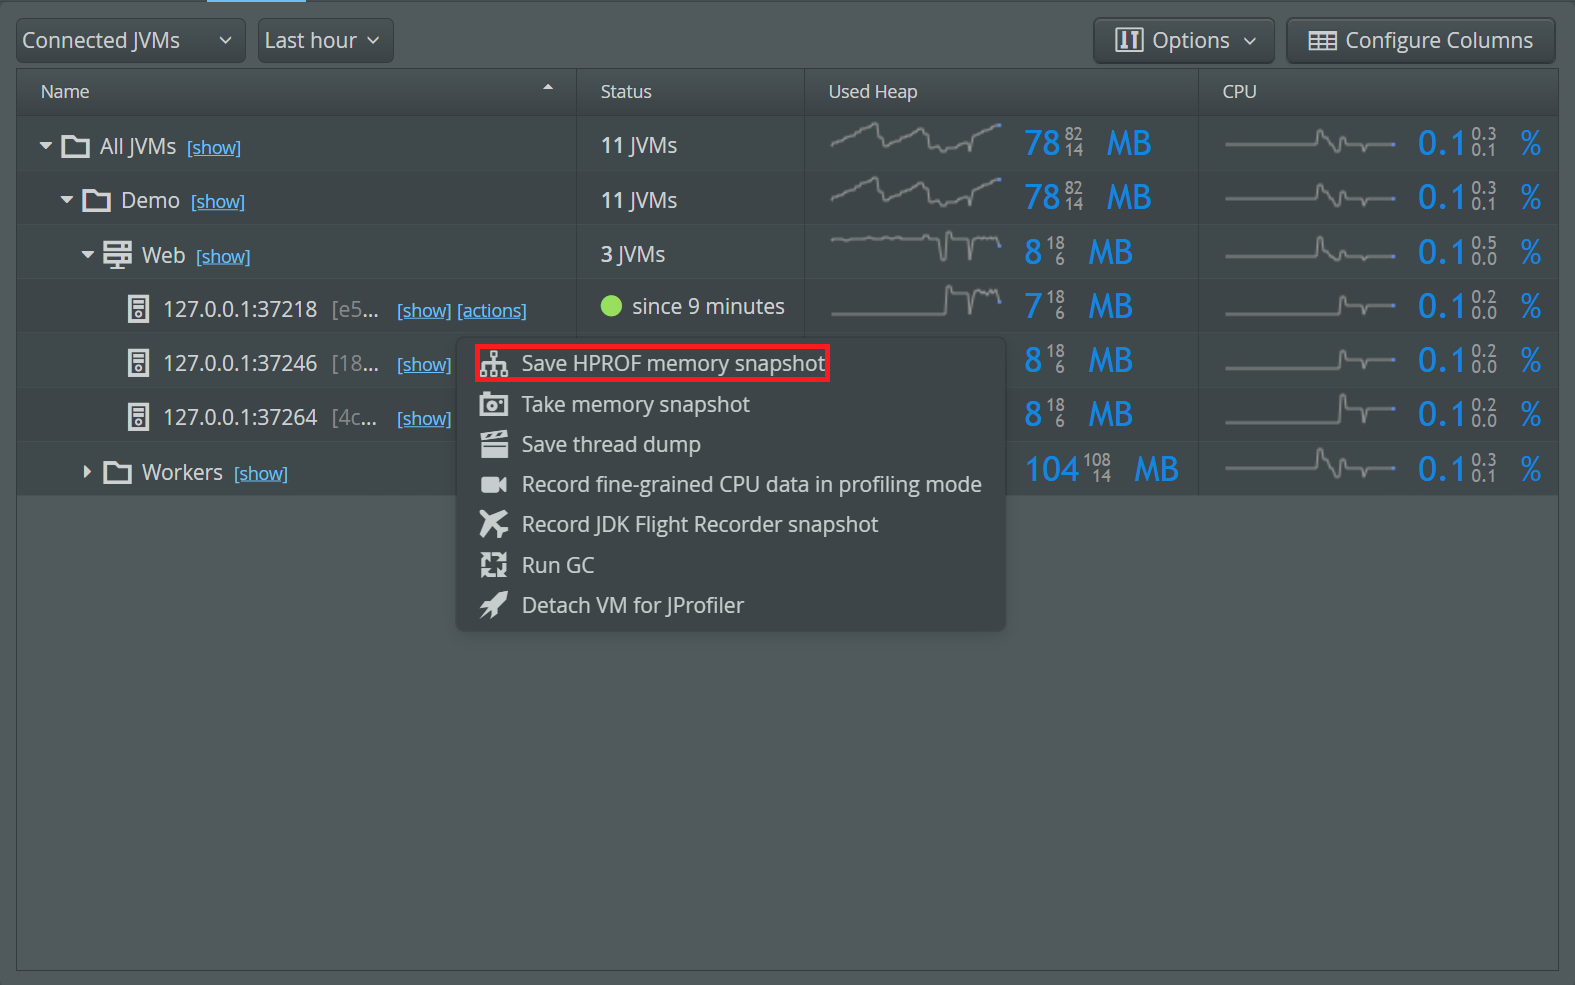
You can save HPROF snapshots with triggers or manually in the VMs view, by clicking on the "actions" link next to a VM and selecting "Save HPROF memory snapshot".
The snapshot will be delivered to your inbox when it is ready. This can take a few seconds. If the snapshot is large and the network connection between the perfino collector and the monitored VM has low bandwidth, it can also take several minutes. From the inbox, you can download the snapshot and load it with JProfiler or other Java profilers.
Note that if a sampling operation started with the "Record fine-grained CPU data in profiling mode" is currently in progress, the heap dump will only be taken after that operation has completed.
Snapshots are stored indefinitely until you delete them from the "Snapshots" view. The inbox item just notifies you about a new snapshot, deleting the inbox item will not delete the snapshot itself. In the "Snapshots" view you can select the VM group or VM to show only snapshots that have been taken for the selected VMs.
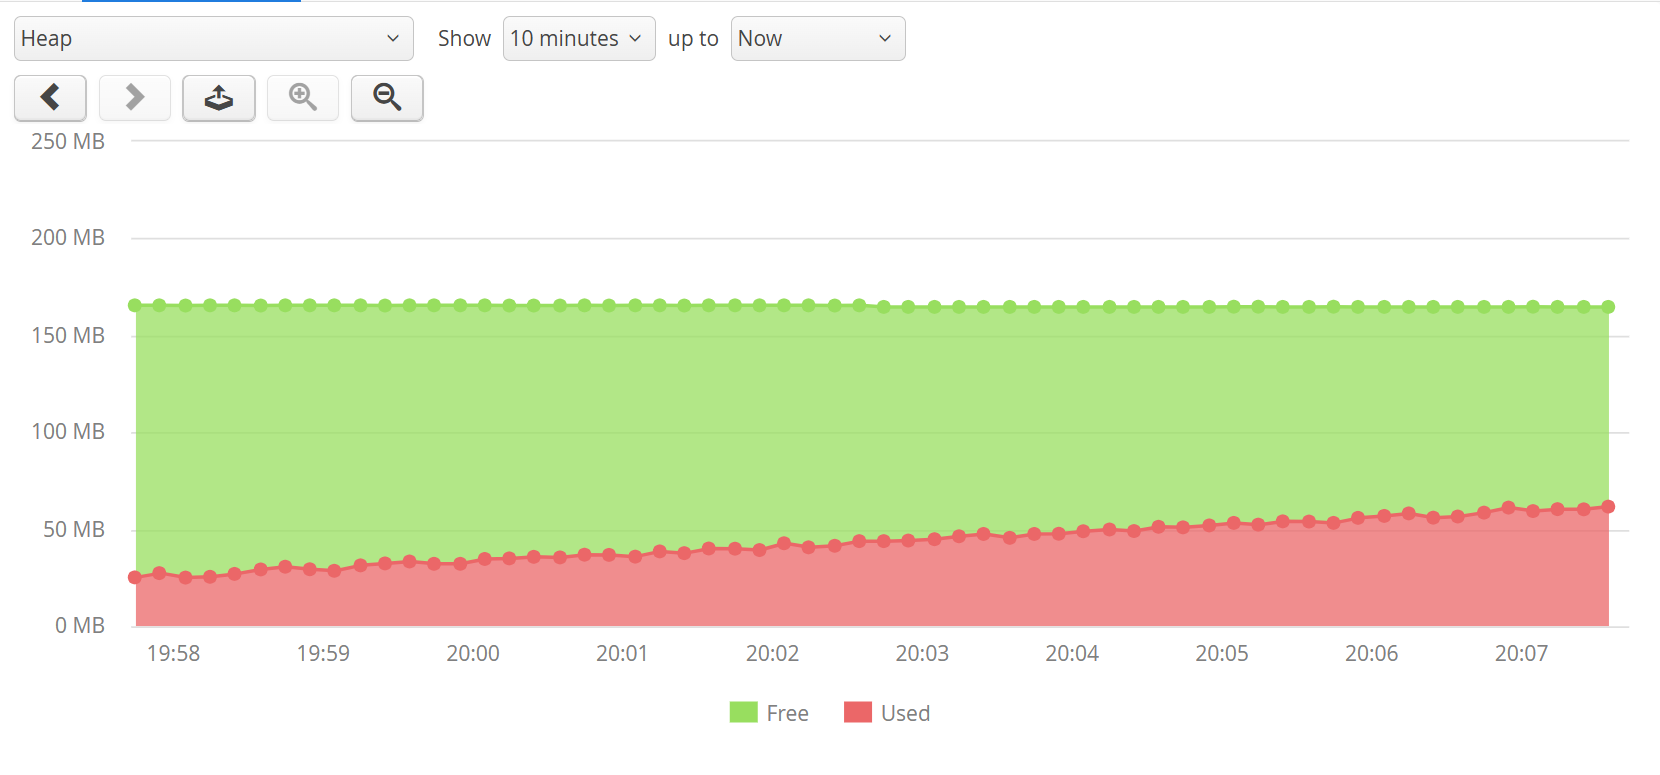
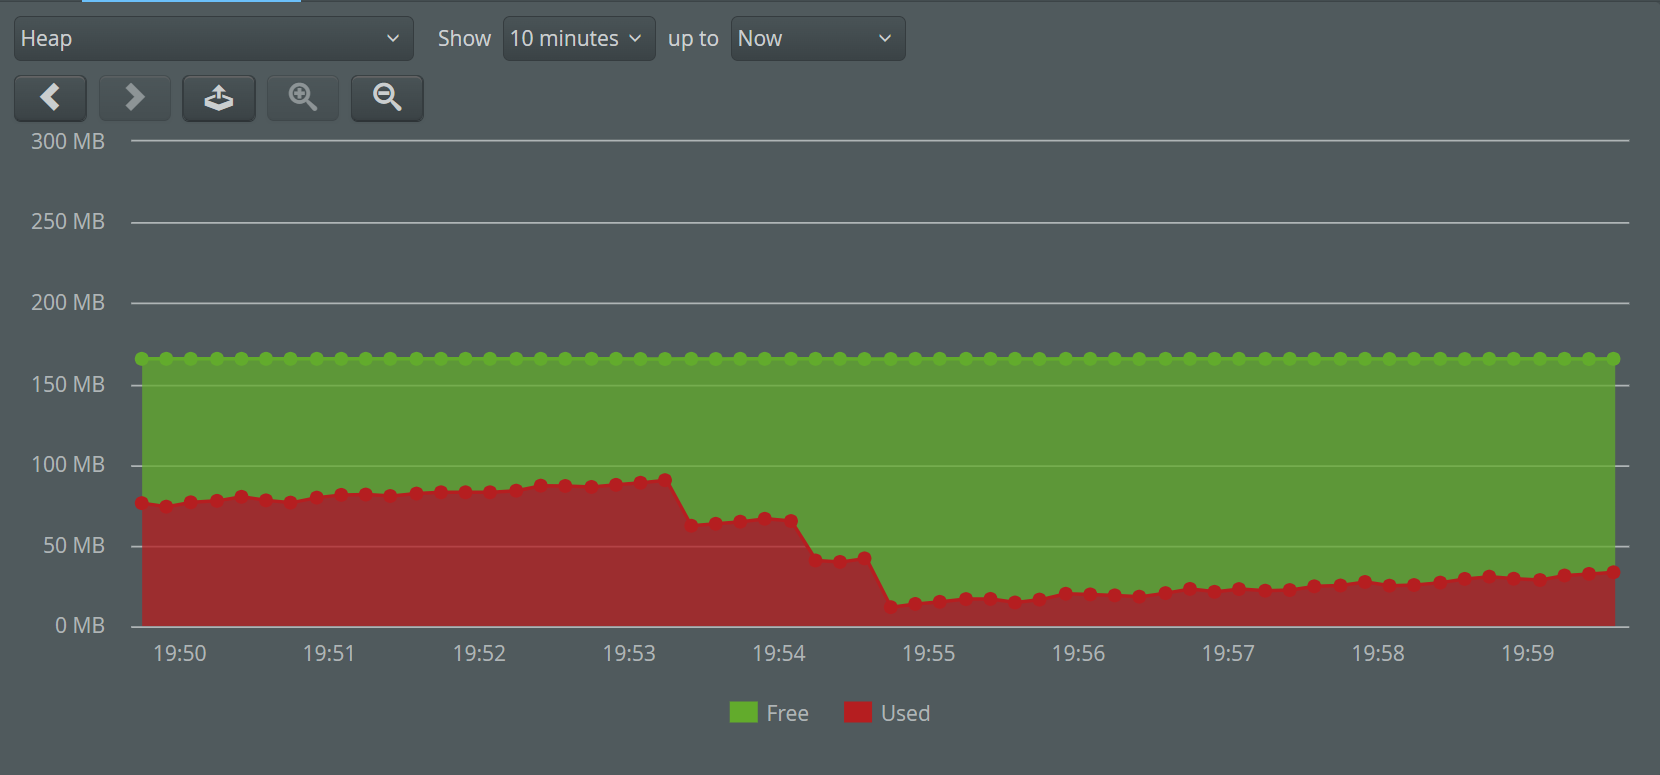
Heap telemetry
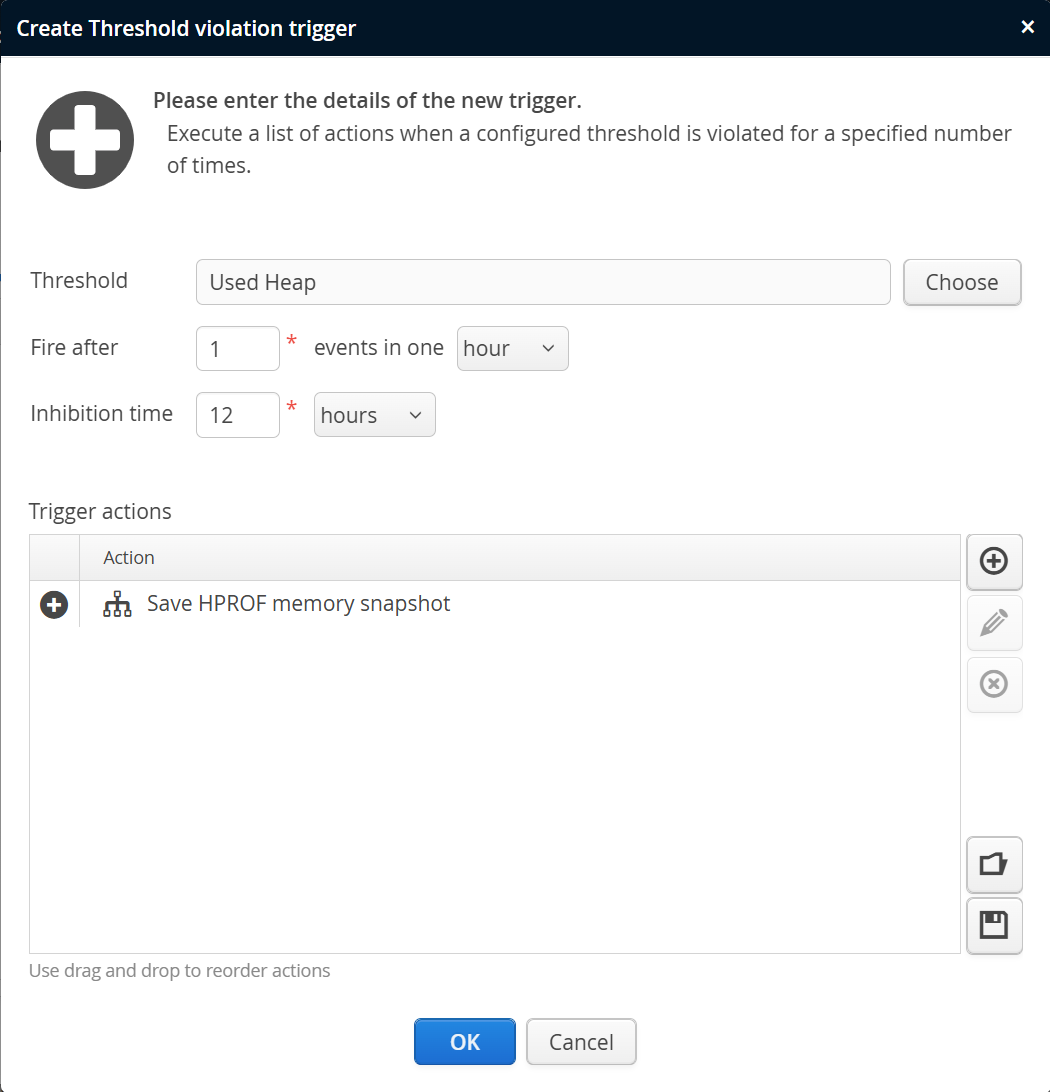
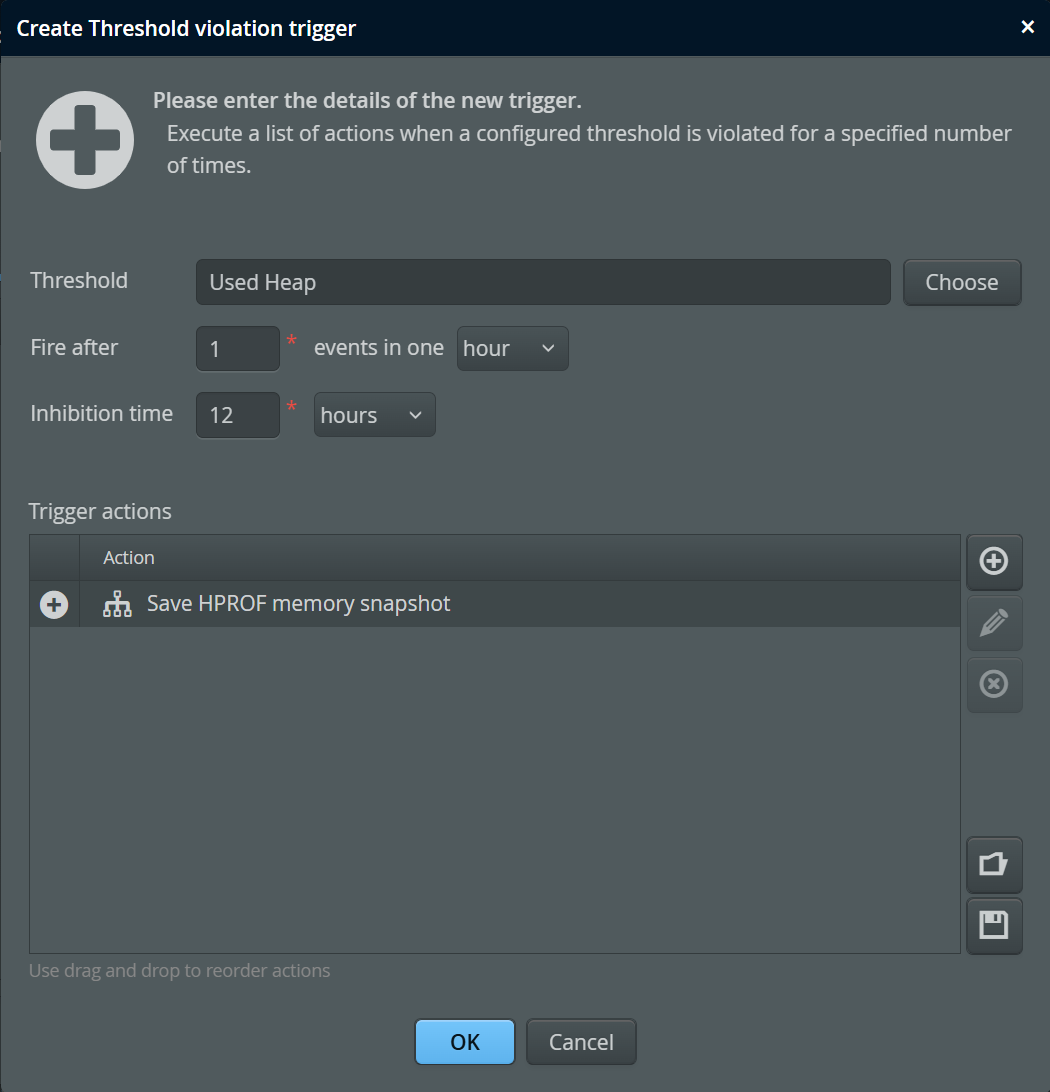
Information about free heap and used heap is always available with a fine time resolution. As such, they are an ideal basis for trigger conditions that save HPROF snapshots in case of low memory.
To do that, define a threshold for the "Free heap" telemetry with a specified lower bound in the recording settings. In the trigger settings, add a threshold trigger for that threshold and add a "Save HPROF memory snapshot" action to the trigger.
perfino only takes a memory snapshot for the last VM where a threshold violation was detected, not for all such VMs.