perfino stores data for long periods of times, in some highly aggregated forms even indefinitely. Apart from telemetries where the main content of the view already is a historical comparison by itself, the VM data views show data from a certain time interval and let you move back and forth to adjacent intervals or select arbitrary intervals in the past.
In addition to looking at this historical data to analyze it by itself, many VM data views offer facilities to make historical comparisons. There are two kinds of comparisons: Comparing all the content from two selected points in time and comparing one scalar value for many points in time.
Content comparisons
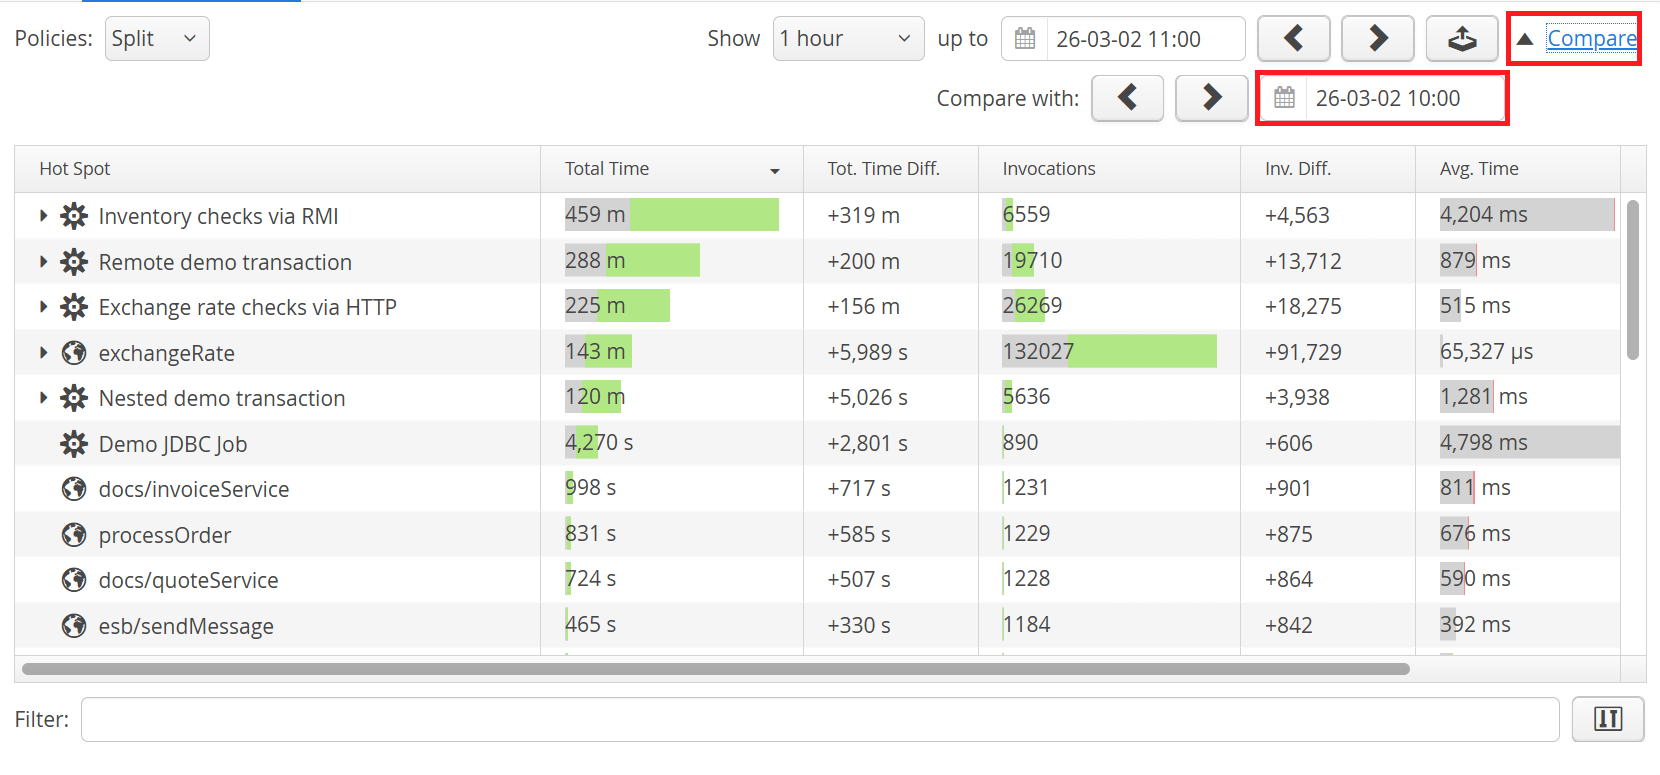
Content comparisons are available in the views that show transactions as well as the probe hot spots views. To start a comparison, click on the "Compare" link in the top right corner. This immediately shows you a comparison between the following intervals:
-
Second interval
The second interval is the interval you were looking at before clicking on the "Compare" link. You can adjust the second interval with the same navigation controls as before. -
First interval
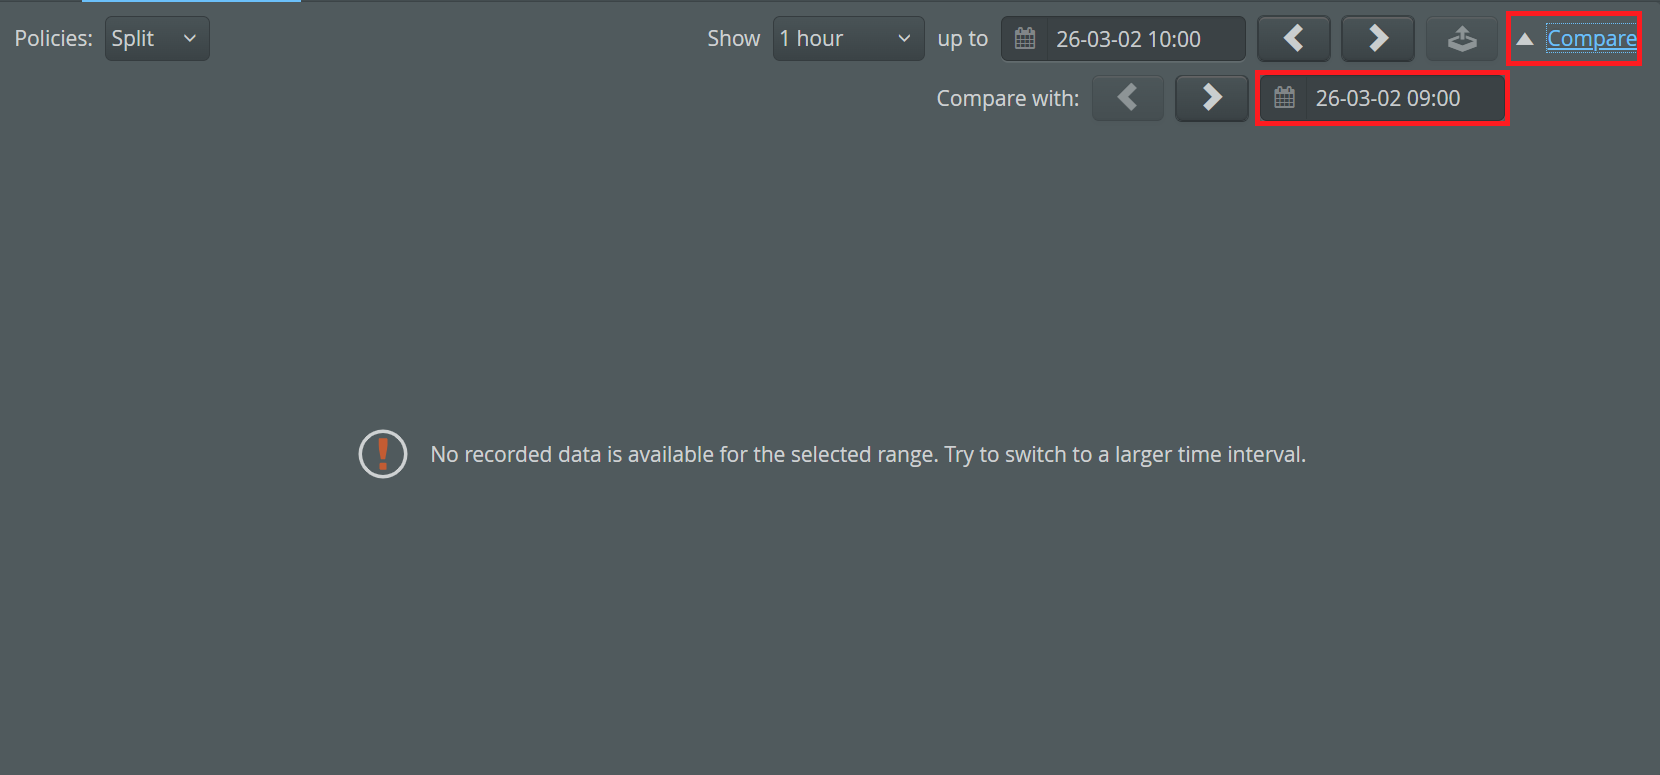
The first interval is set to the interval just preceding the second interval. New navigation buttons are shown that let you adjust the first interval as required. With the date and time chooser you can jump back to arbitrary points in time.
Transaction data is aggregated, so as you move the first interval back in time, you will hit the limit of stored data. At that point, you have to switch to a larger resolution for which data is retained longer. The available display intervals with their retention times are:
| Display interval | Retention single VMs | Retention VM groups | Retention pooled VMs |
|---|---|---|---|
| 1 minute | 27 hours | 27 hours | 12 hours |
| 10 minutes | 27 hours | 27 hours | 12 hours |
| 1 hour | 30 days | 10 days | 10 days |
| 1 day | unlimited | 120 days | 60 days |
The retention times for VM groups are lower to reduce storage requirements. Analyzing single pooled VMs is only useful for fixing a problem and not suitable for long-term analysis, so the retention times for pooled VM data are even lower.
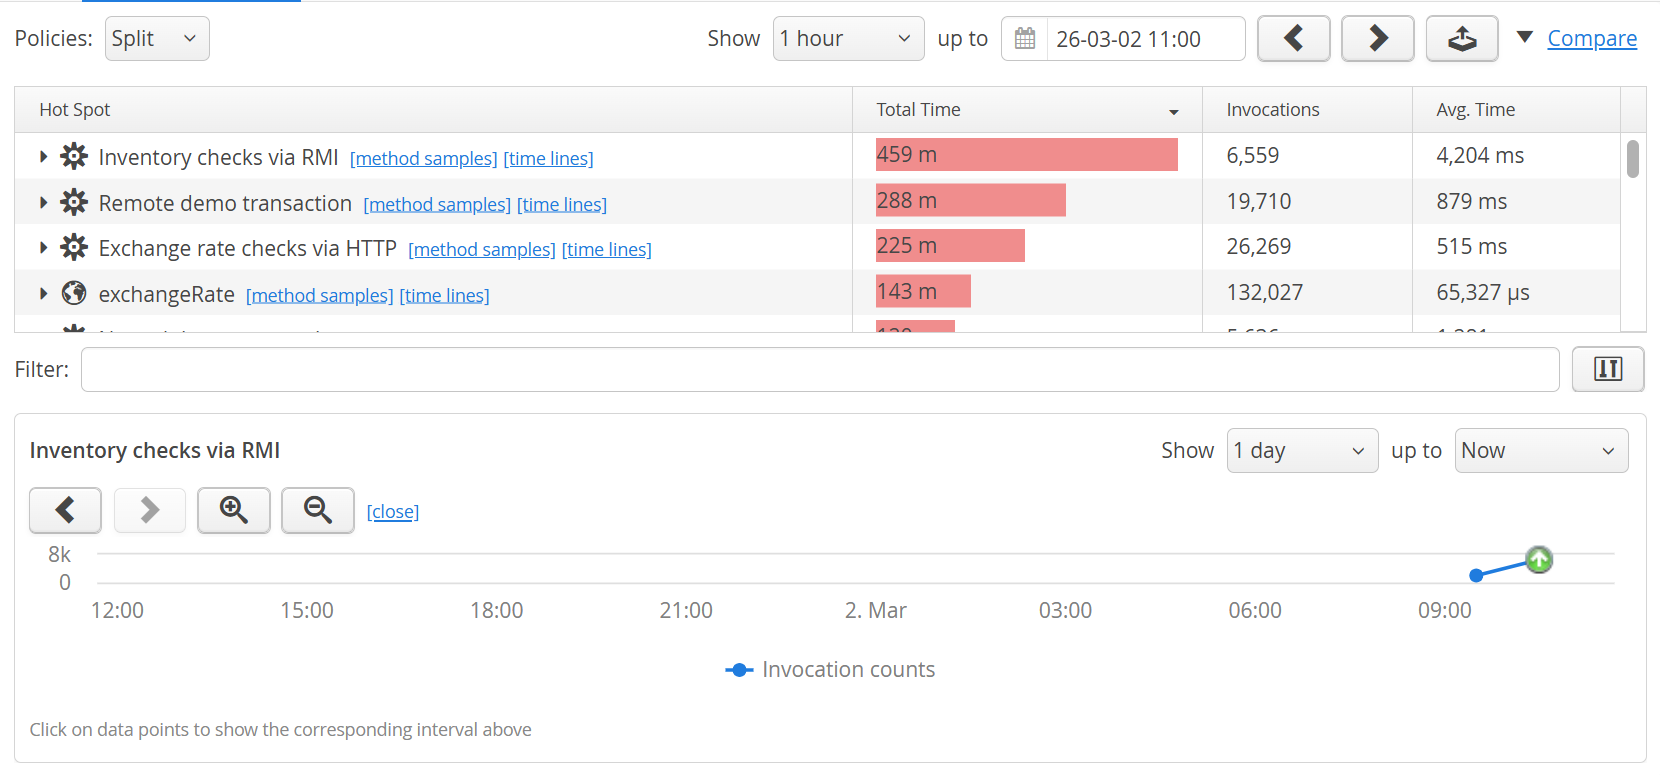
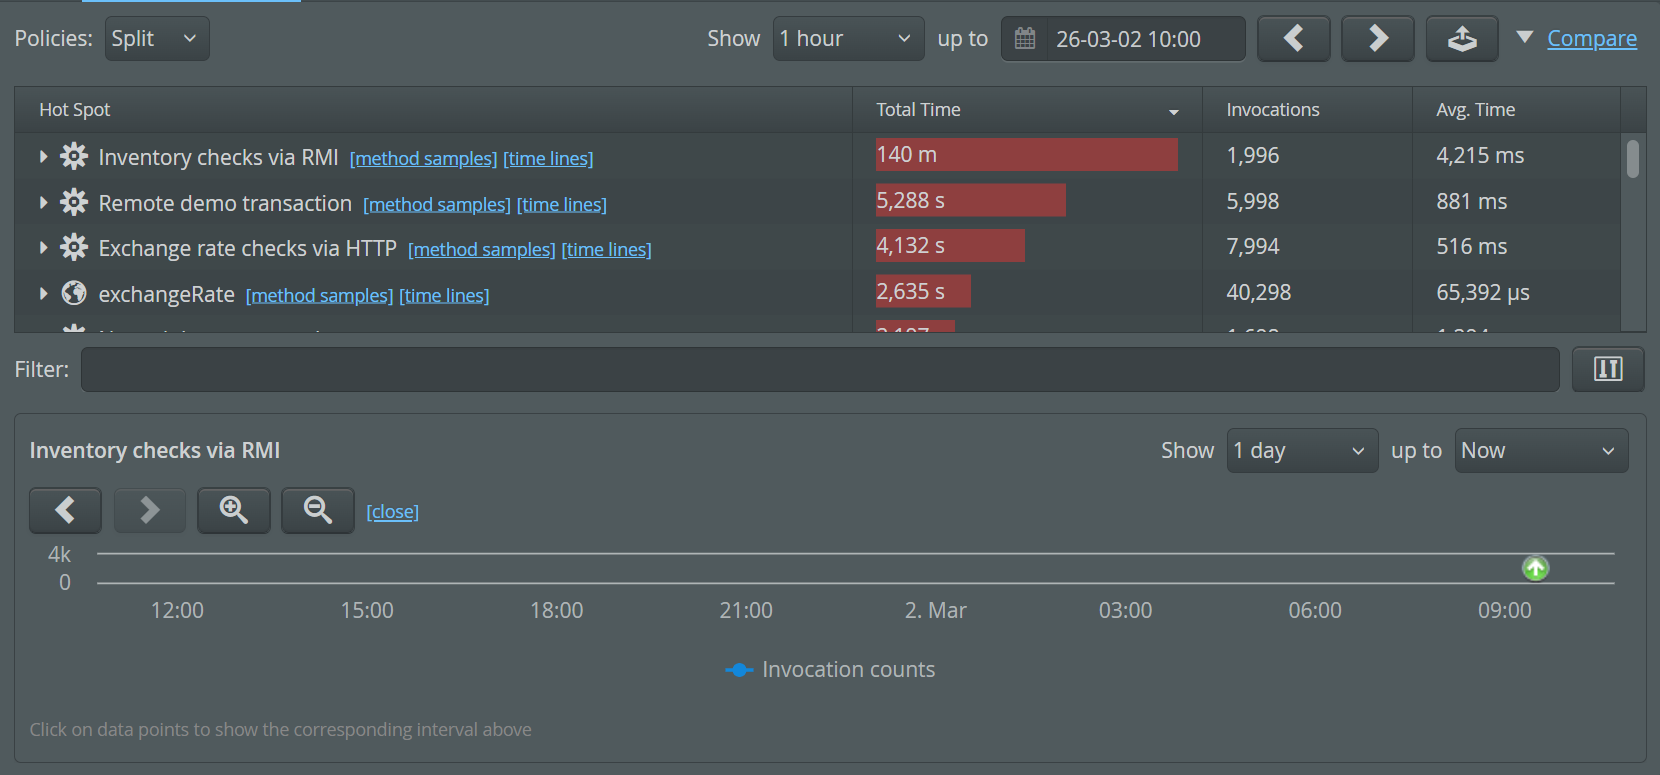
In a comparison view, all measurements that are shown in the regular view get an additional column that shows the difference between the second and the first interval. In addition, the measurement columns are shown with a difference bar in the background:
- If the value has increased, the total length of the bar corresponds to the value in the second interval, with the increase shown in green.
- If the value has decreased, the total length of the bar corresponds to the value in the first interval, with the decrease shown in red.
- The unchanged fraction is shown in gray.
Timelines
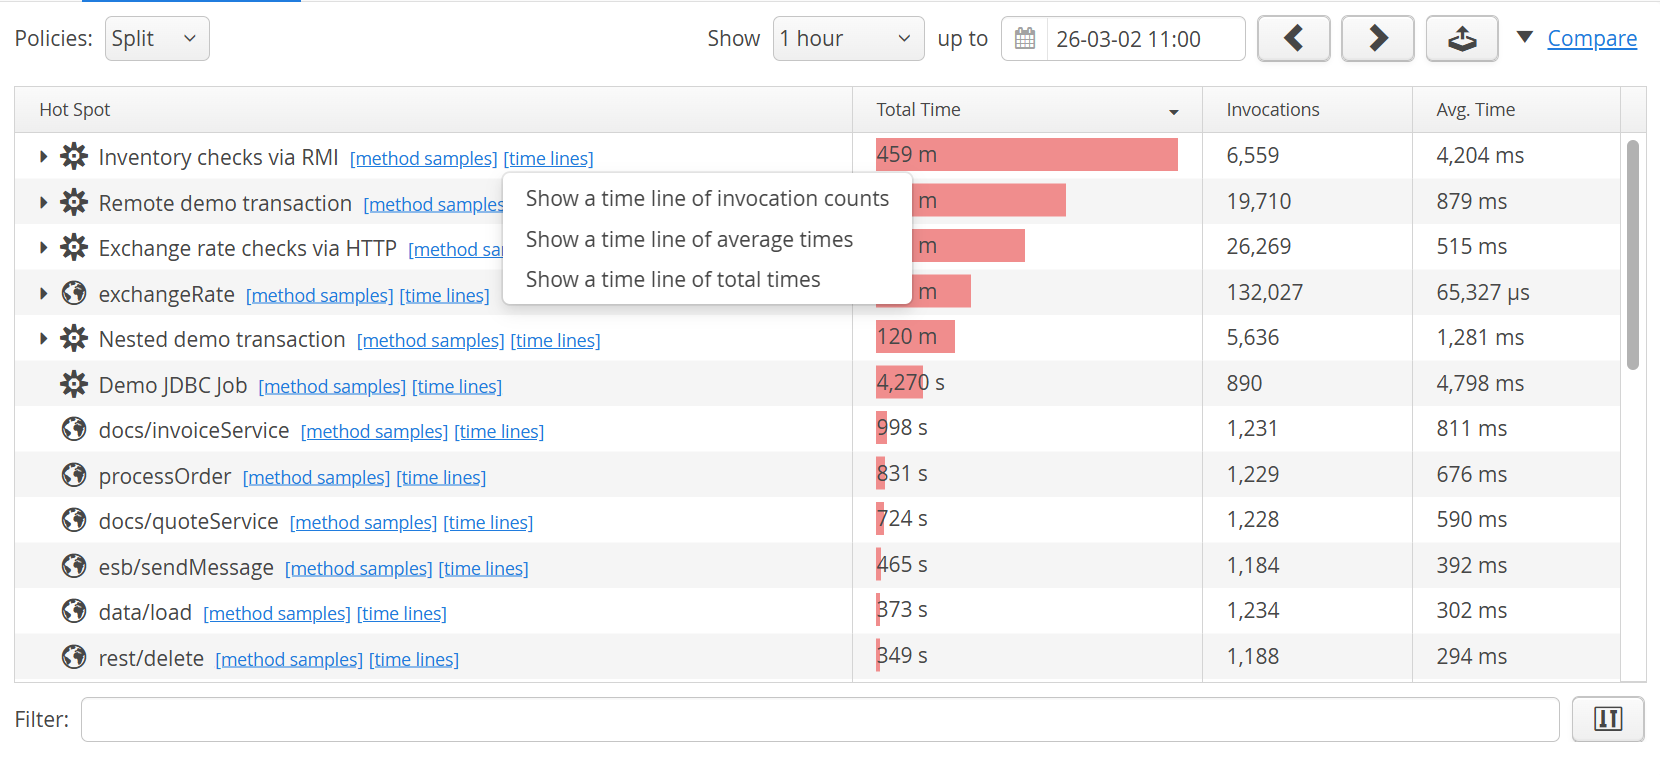
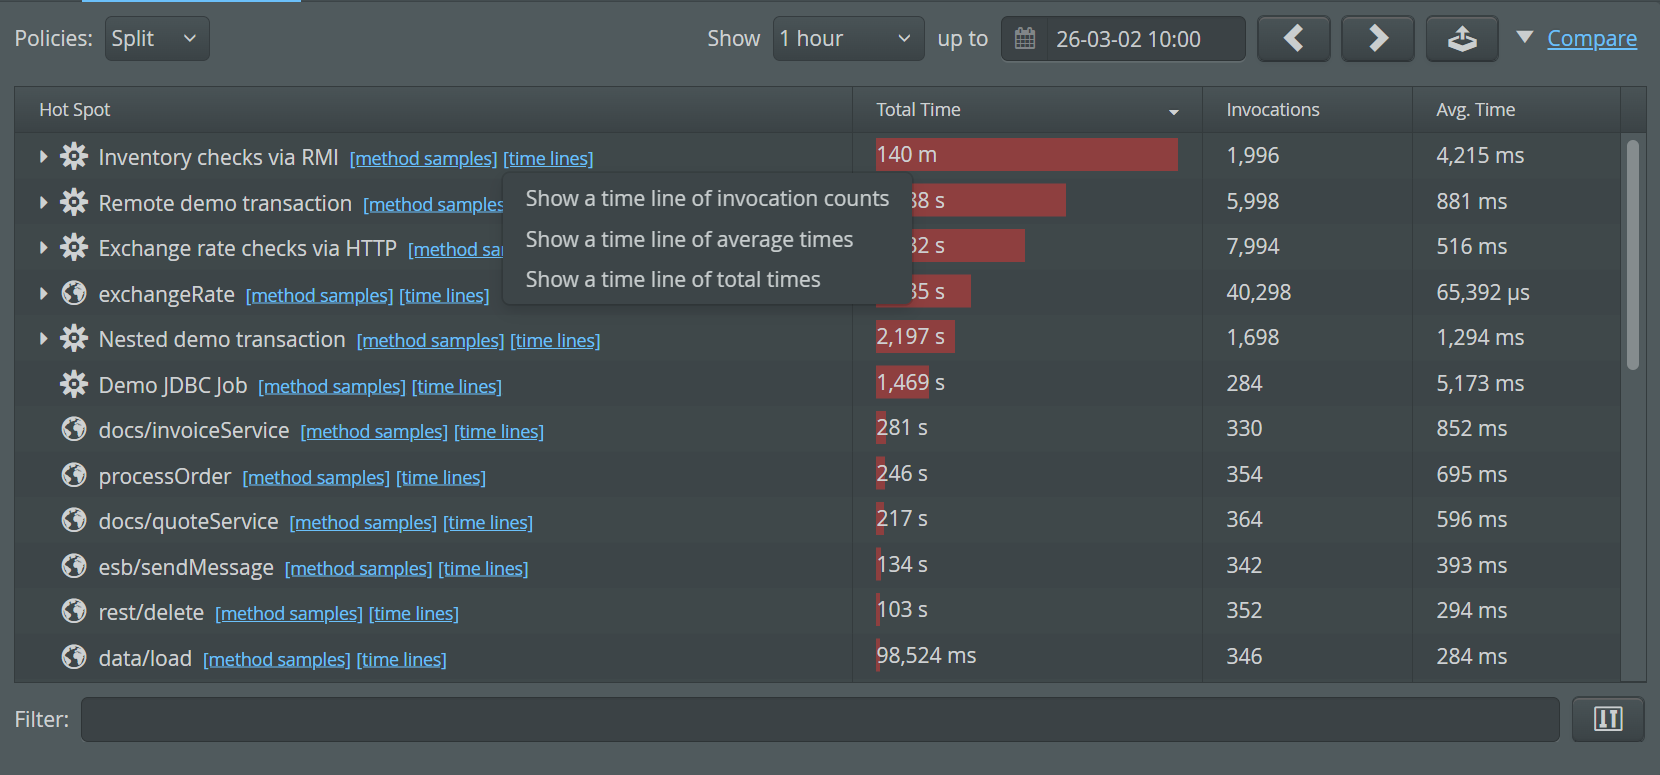
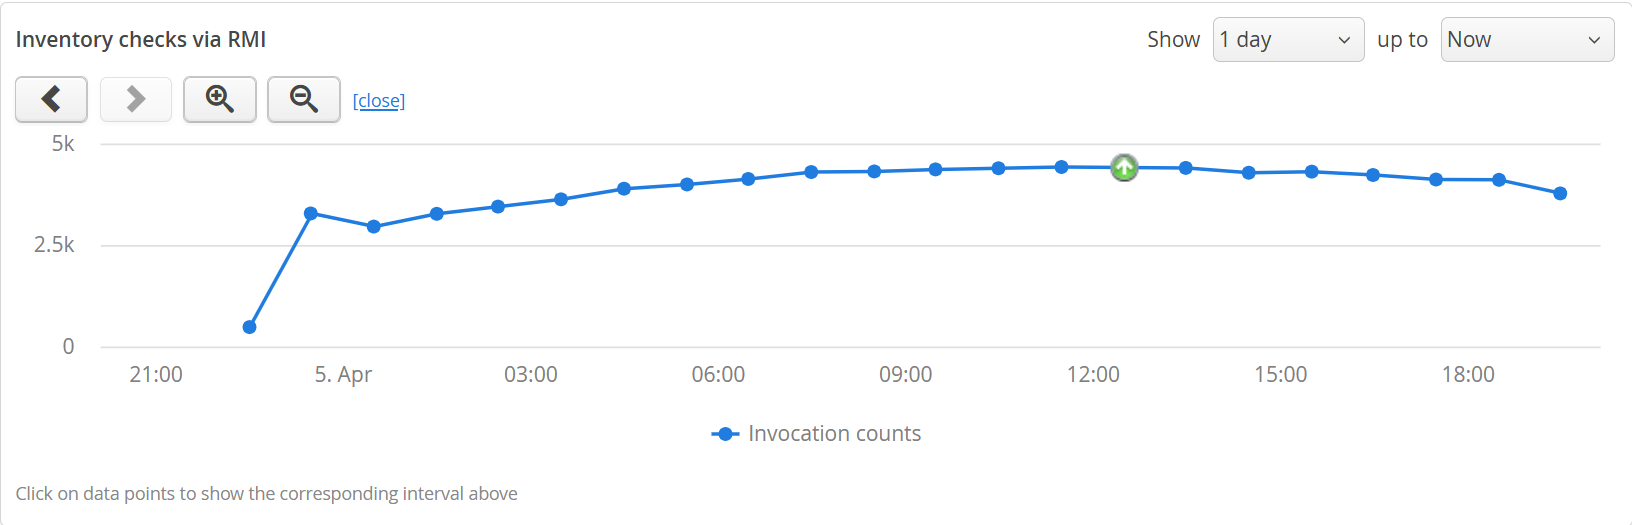
If you click on the "timelines" link next to an element in any of the transaction views, you can choose which column should be plotted over time.
The timeline will replace the default transaction telemetry in the split panel below the view. Clicking on the close button will restore the default state. Unlike the default transaction timeline that shows all transactions split into policy violation lines, these timelines are calculated from the transaction trees, and each point in such a timeline corresponds to one specific transaction interval. Instead of a highlighted time range, the currently selected transaction interval is shown as a special marker on the corresponding data point.
Time line data is not available for the one-minute resolution, so the time line links are not shown for that display interval. For other display intervals, the data points in the time line initially match the display interval in the data view, so that the numbers are comparable. The timeline has navigation buttons itself which take you to different intervals of the entire timeline, just like for telemetry views.
The following display intervals in the data view and the time line are compatible with respect to the measured intervals:
| Data view | Time line |
|---|---|
| 10 minutes | 3/6/12 hours |
| 1 hour | 1/3/6 days |
| 1 day | 12/30/60/180 days |
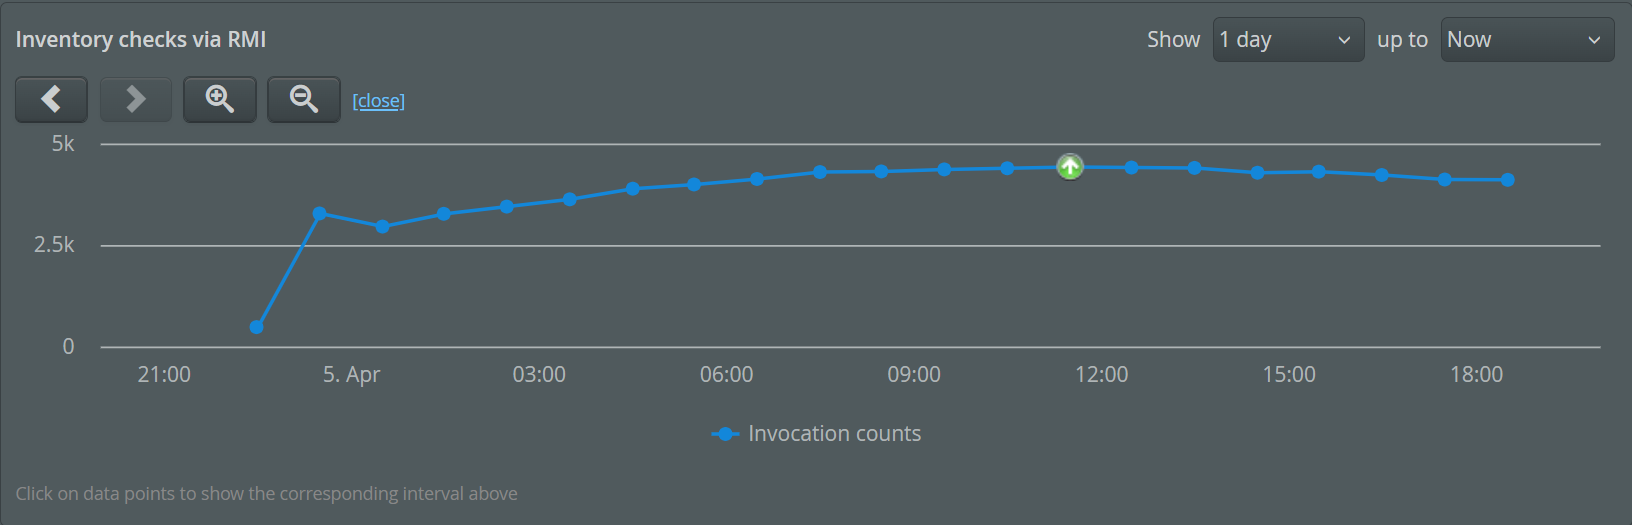
To get the chronological context for the data displayed above, look for the up-arrow icon in the timeline. You can navigate to different points in time by clicking on them.
If you change the display interval of the time line and then click on a data point in the time line, the resolution of the data view will be adjusted to be compatible with the time line. Then, the current time can be marked.
If you select a new timeline in the data view, the old timeline will be replaced. Any change in the parameters of the data view will automatically close the timeline.