For web requests, the server transaction time is shorter than the page load time in the browser. Secondary requests that are triggered by the page can lead to an unacceptable end user experience even though your server monitoring indicates that everything is fine.
perfino includes a servlet filter that injects a Javascript snippet into HTML pages and reports the page load time back to the server. In addition, a transaction ID is sent back so that perfino can correlate execution times of web transactions and the associated page load times. The snippet is very small and does not require any external libraries. The overhead is also extremely small, since the snippet only runs after the page has loaded and the Web Performance API is used to get the timing directly from the browser.
There are no cross-origin request problems with this scheme, because the browser sends the data back to the application server where the page was loaded from. A servlet filter provided by perfino reads the timing data and reports it to the perfino monitoring agent. From there it is transmitted to the perfino collector.
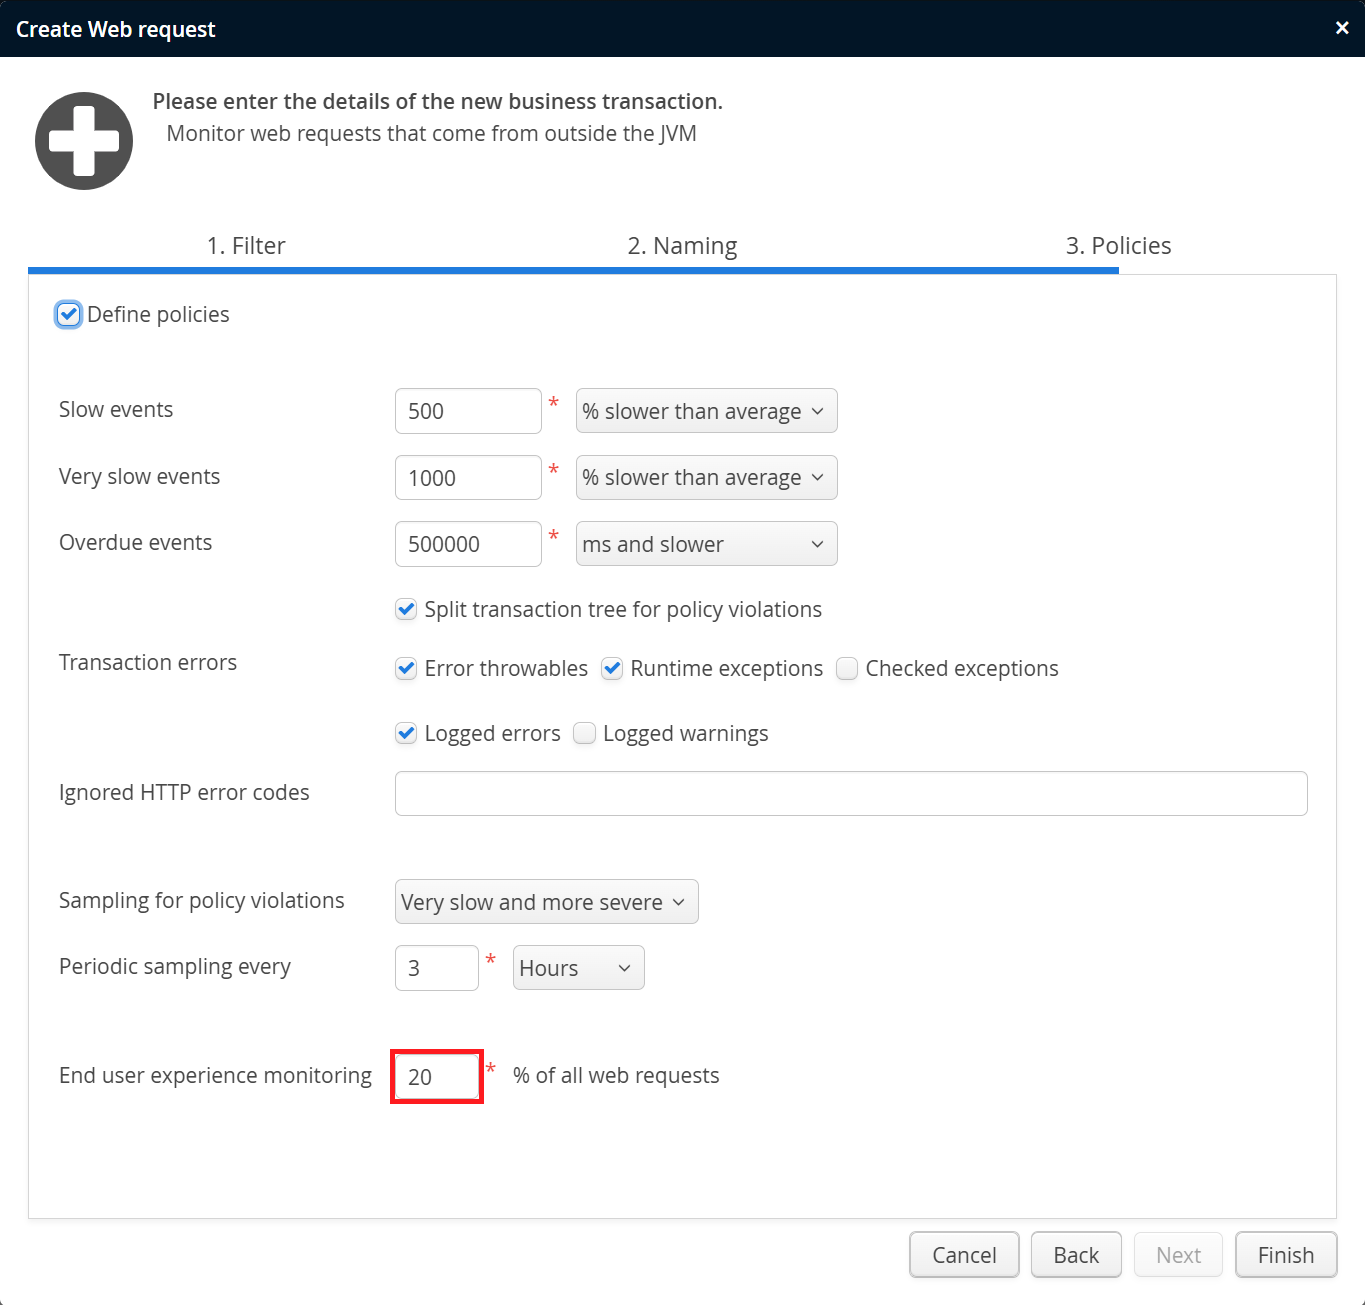
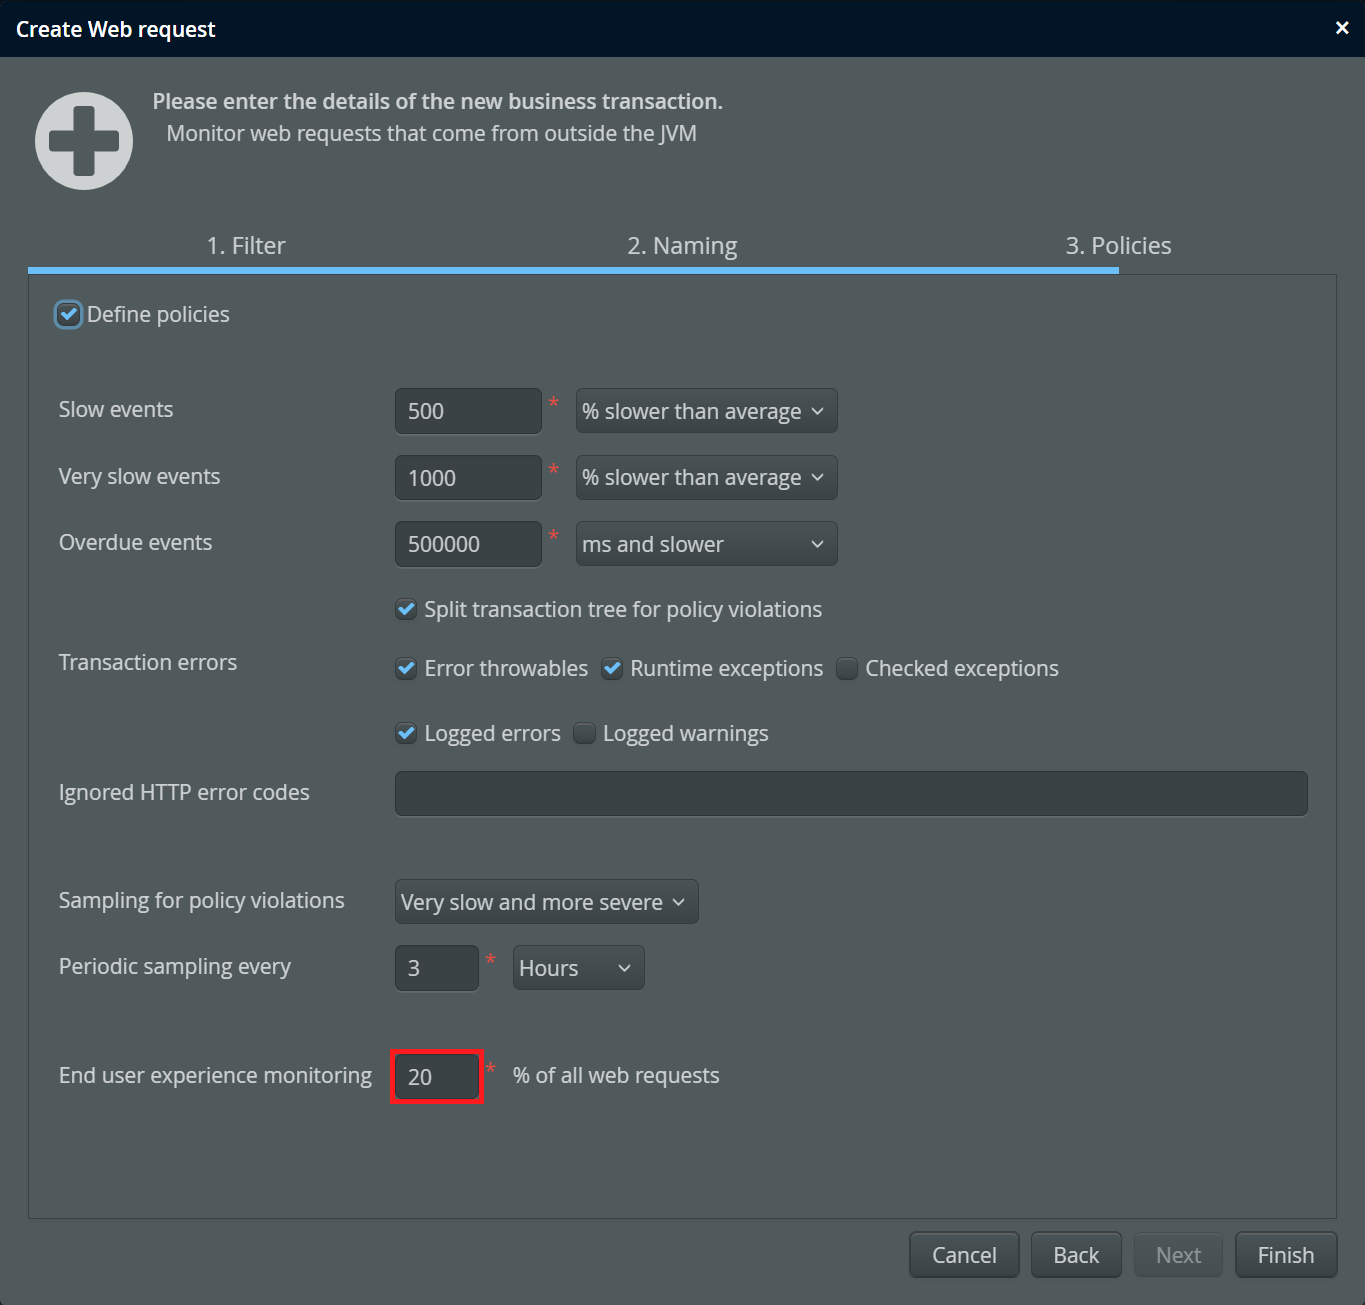
Typically, you do not need page load times from all HTTP requests that create HTML pages, so you just sample a particular percentage. This percentage value can be configured in the policies configuration of web transactions. To disable this feature, set the percentage value to 0%.
In the VM data views, the "Transactions" view category holds the "End user monitoring" view. It is structured like the hot spots view with different time ranges and navigation buttons to show previous intervals. The table lists all web transactions for which end user monitoring data has been received by the perfino collector.
From the ratio of the page load duration and the transaction execution time, an overhead column is calculated. The "Samples" column shows you how many measurements were taken, while the "Transactions" column contains the total number of transactions. Their ratio should correspond to the sampling percentage above. It can be slightly lower due to incomplete page loads and browsers that do not support the Web Performance API. To get better statistics, switch the time range to a longer interval.
Using the servlet filter
The servlet filter that injects the monitoring Javascript snippet into HTML pages is contained in the
perfino API that is located in the JAR file api/perfino-api.jar. See the javadoc overview
for how to download this JAR file with Maven, Ivy or Gradle.
To enable end user experience monitoring, you have to add a filter definition to your web.xml file:
<filter>
  <filter-name>euem</filter-name>
  <filter-class>com.perfino.filter.EndUserFilter</filter-class>
</filter>
In addition, you need at least one filter mapping that passes your HTML pages through this filter:
<filter-mapping>
   <filter-name>euem</filter-name>
   <url-pattern>/*</url-pattern>
</filter-mapping>
Only HTML files with a head tag are processed, other files are left unmodified. HTML
pages that are not generated as part of a business transaction are not injected.
If you have filters that compress your pages, you have to make sure to insert the EndUserFilter
after any such filters, so that it can detect and modify the HTML content.
The Javascript snippet is loaded from and reports back to URLs below [context path]/__perfino.
You have to make sure that URLs matching /__perfino/**
are passed to the filter. In the above example configuration, that would be the case. If the filter mapping
only handles selected URLs, the following additional filter mapping has to be added as the first mapping:
<filter-mapping>
   <filter-name>euem</filter-name>
   <url-pattern>/__perfino/*</url-pattern>
</filter-mapping>
Cached pages
If you use a filter to cache certain HTML pages, you might want to disable end user experience monitoring
for those pages by adjusting the URL pattern for the EndUserFilter. If you really want
to monitor cached pages, make sure that the sampling percentage for end user experience monitoring is set to 100%,
otherwise not all cached pages will include the Javascript snippet.
Since the load time of the page will not be correlated to the transaction time on the server in that case,
the average overhead may become negative. In that case, the perfino UI shows [Cached] instead
of the negative percentage number. In the time lines for the overheads of a single transaction, negative
overhead percentages due to caching are set to zero.
For cached pages, a dynamic change of the transaction naming configuration will not propagate to the browser. perfino uses a hashing technique to detect pages that were generated with a different configuration and ignores the reported load times.