JProfiler 16.1: AI Agents Can Now Profile Your Java Applications
Since JProfiler 1.0, profiling has been something a developer does with a GUI. You start a session, navigate views, and interpret data. In practice, this means that performance analysis only happens when a problem is serious enough to justify the context switch, and many issues ship to production without ever being profiled.
With JProfiler 16.1, we are changing how profiling works: AI coding agents can now profile your Java applications, analyze the results, and act on them. This is the biggest change in how developers use profiling since we started.
The new JProfiler MCP server, available as the @ej-technologies/jprofiler-mcp npm package, exposes JProfiler's
profiling and heap analysis capabilities through the
Model Context Protocol. It works with Claude Code, Cursor, Codex,
Gemini CLI and any other MCP-compatible AI coding tool.
The Problem: AI Agents Are Blind to Runtime Behavior
AI coding agents excel at reading code, generating implementations, and running tests. But they cannot see what happens at runtime. When you ask an agent to fix a performance problem, it can only guess based on code patterns. It cannot see which methods are actually slow, which database queries dominate execution time, or where memory is being consumed.
JProfiler 16.1 closes this gap by exposing profiling data through MCP, giving AI agents the same performance visibility that JProfiler has always provided to human developers.

From Hotspots to Root Causes
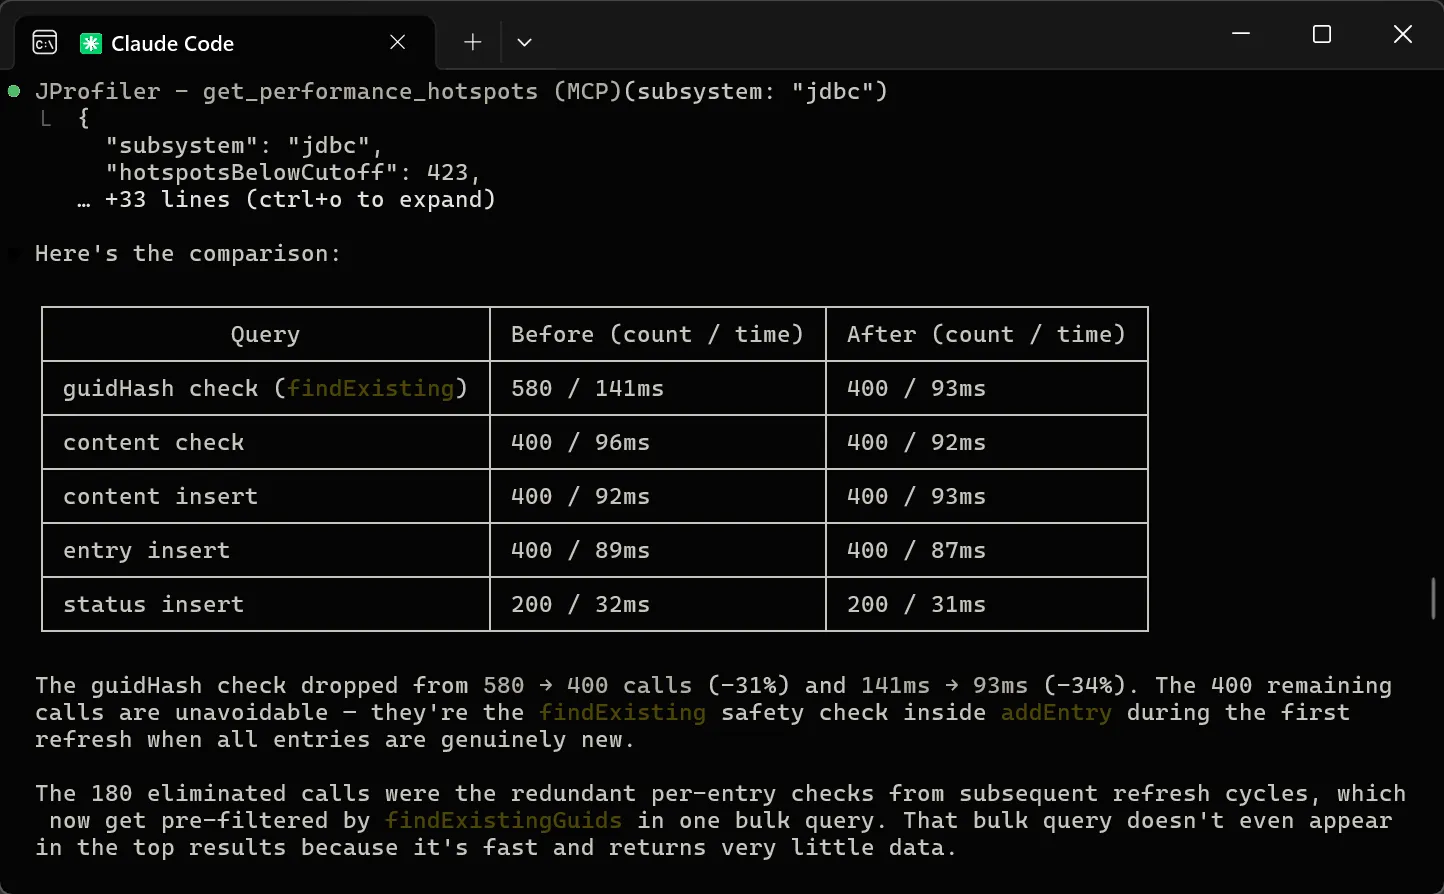
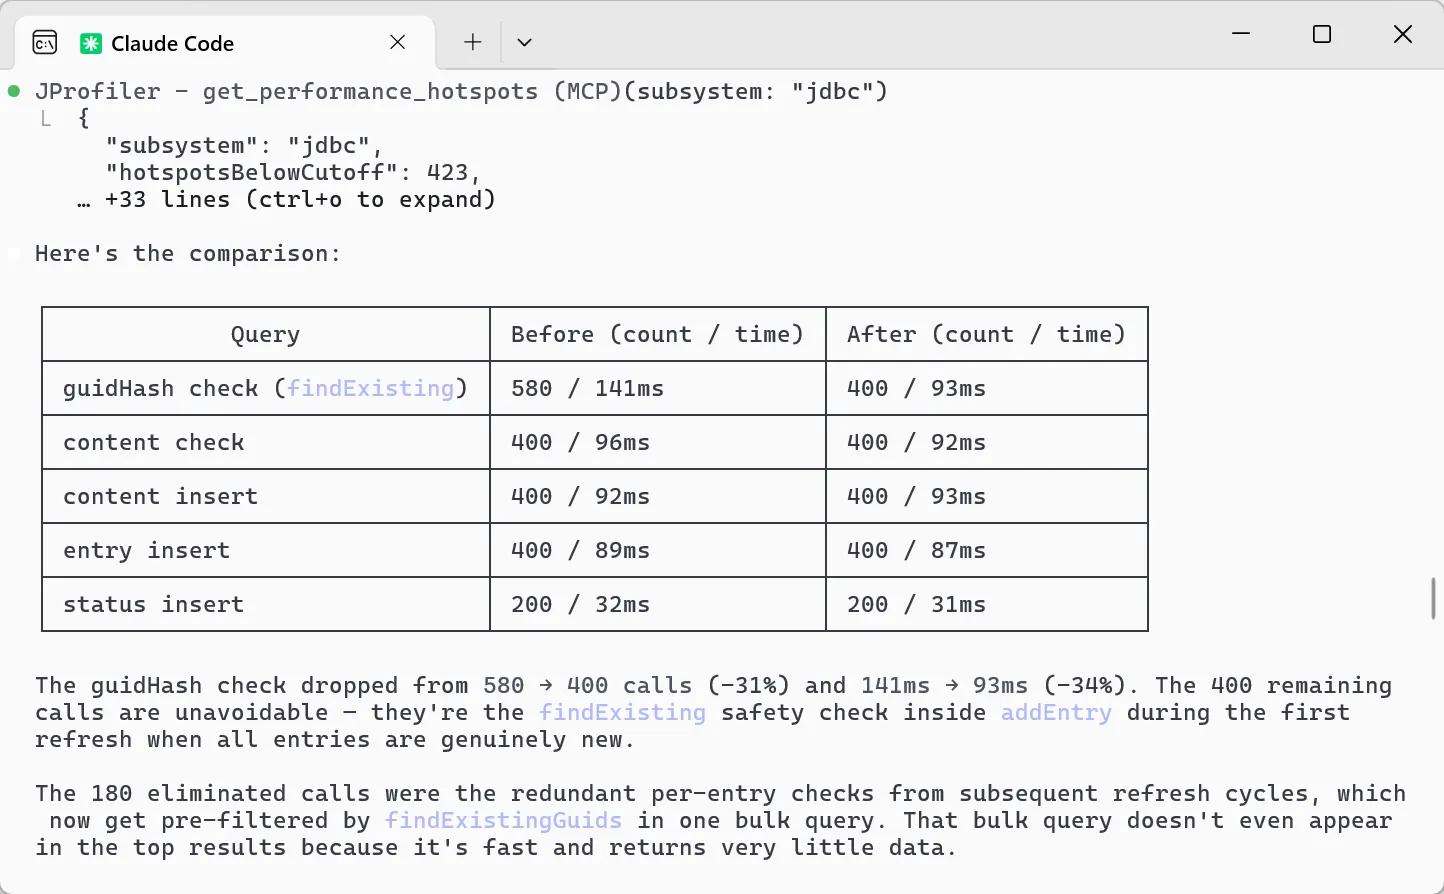
Agents can close the loop: an agent profiles an application, discovers that JDBC queries dominate execution time, and identifies the specific queries responsible. It then modifies the code to eliminate redundant database calls, re-profiles to verify the improvement, and presents a before-and-after comparison with concrete numbers. A complete performance engineering cycle, from diagnosis to verified fix, without the developer having to open the JProfiler GUI.
The agent works with actual runtime data and not by guessing. And because it can compare snapshots, it can prove that its fix actually worked.
A Guided Workflow That Agents Actually Follow
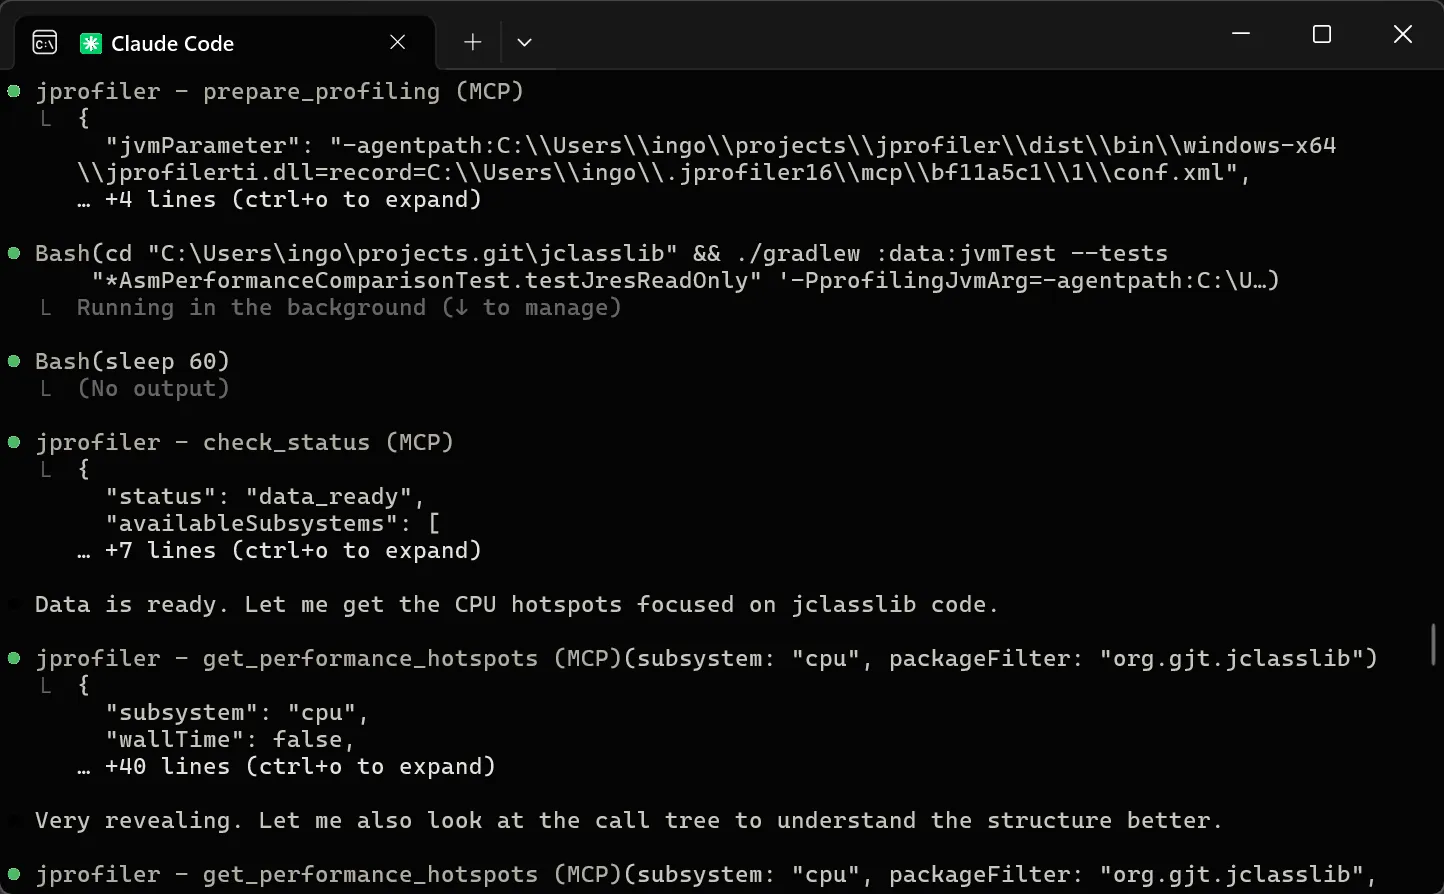
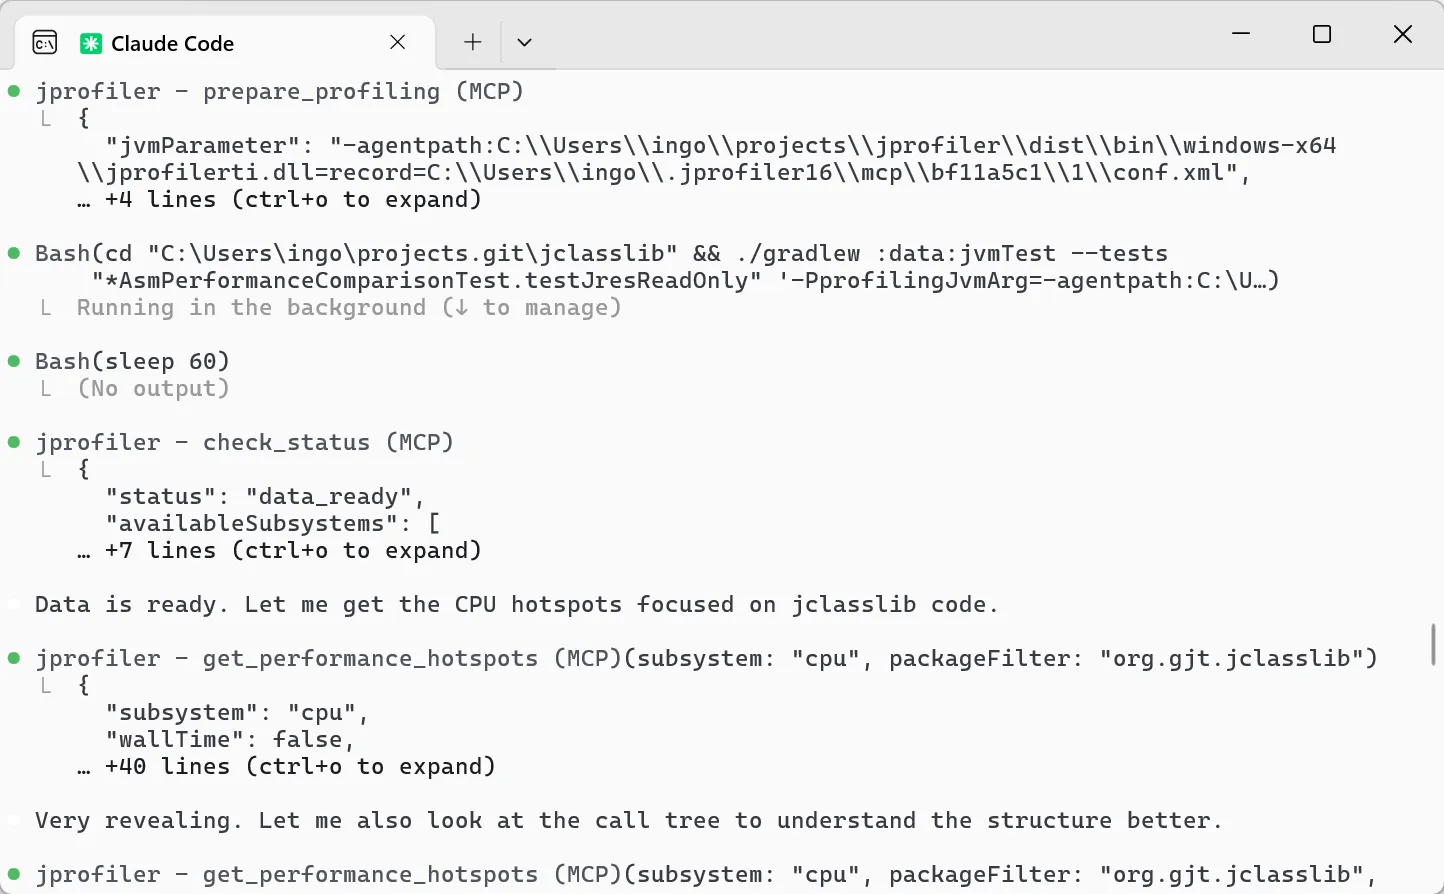
Building an MCP server that agents use correctly is harder than it looks. We have carefully crafted and tested the tools so that agents reliably follow a profiling workflow that mirrors how an expert would use JProfiler. The agent first sets up profiling for the target application. After the test run completes, it checks for data availability. Then it retrieves the initial aggregated hotspot view to understand where time is being spent. From there, it drills into specific hotspots, following the call chain to the root cause. Each step naturally leads to the next.
The data at each step is carefully filtered so agents see what matters without being overwhelmed, whether they are analyzing CPU hotspots, JDBC and JPA queries, HTTP calls, MongoDB operations, or heap dumps. Beyond live profiling of local and containerized JVMs, agents can also load existing JProfiler, HPROF, or JFR snapshots for analysis.
Getting Started
The setup is zero-friction: the MCP server auto-installs the JProfiler binary on first use and handles licensing through the MCP protocol. For Claude Code, it takes a single command:
claude mcp add jprofiler -- npx -y @ej-technologies/jprofiler-mcp@latest
The MCP setup page has instructions for Codex, Gemini CLI, Junie and other MCP-compatible tools.
Performance problems have always demanded that developers leave their flow, switch tools, and build up context from scratch. With JProfiler 16.1, your AI agent does this for you. It profiles, diagnoses, fixes, and verifies, in the same conversation where you described the problem. We will be publishing detailed walkthroughs of real profiling sessions in upcoming posts.