JProfiler 16: Profiling Agentic Java Applications
Why AI Needs Profiling
Traditional profiling focuses on the JVM's internal execution, like method durations, memory allocation, and thread synchronization issues. One of JProfiler's main innovations of the past is grounded in its probes: Measurements of higher-level systems, like HTTP, JDBC, and RPC calls. With LLM frameworks like LangChain4j and Spring AI, a new performance challenge has emerged. LLM interactions introduce highly non-deterministic latency and substantial resource costs that standard CPU profiling cannot put into context. JProfiler is in a unique position to bridge this gap by treating AI interactions as a data source for a new probe.
The AI Probe: Observability for LLM Workflows
The centerpiece of JProfiler 16 is the new AI Probe. It provides a way to observe how your application interacts with LLMs, and delivers context-aware metrics that help you optimize two important problems: performance and cost.
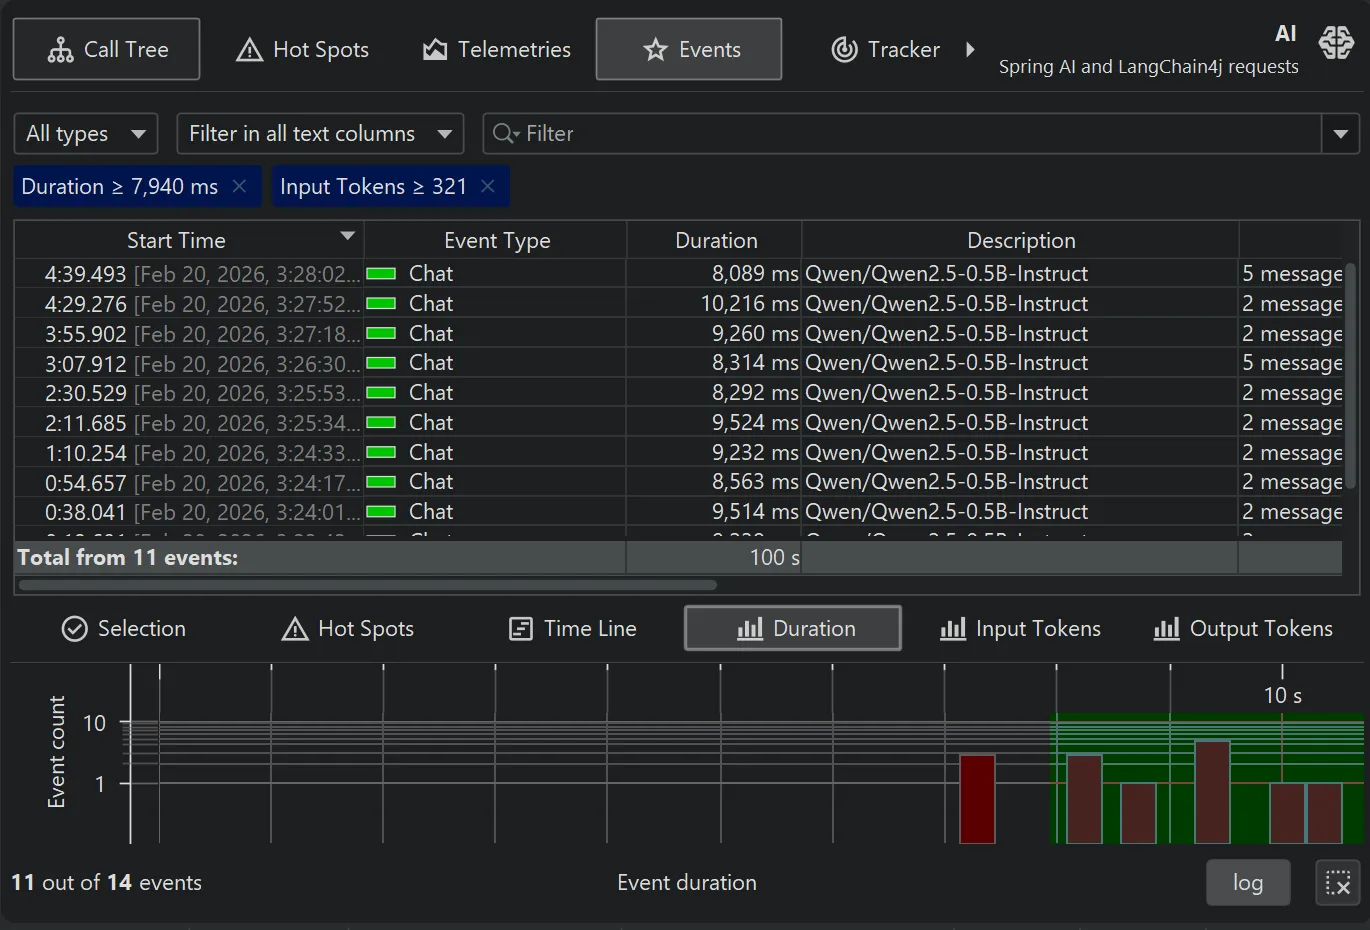
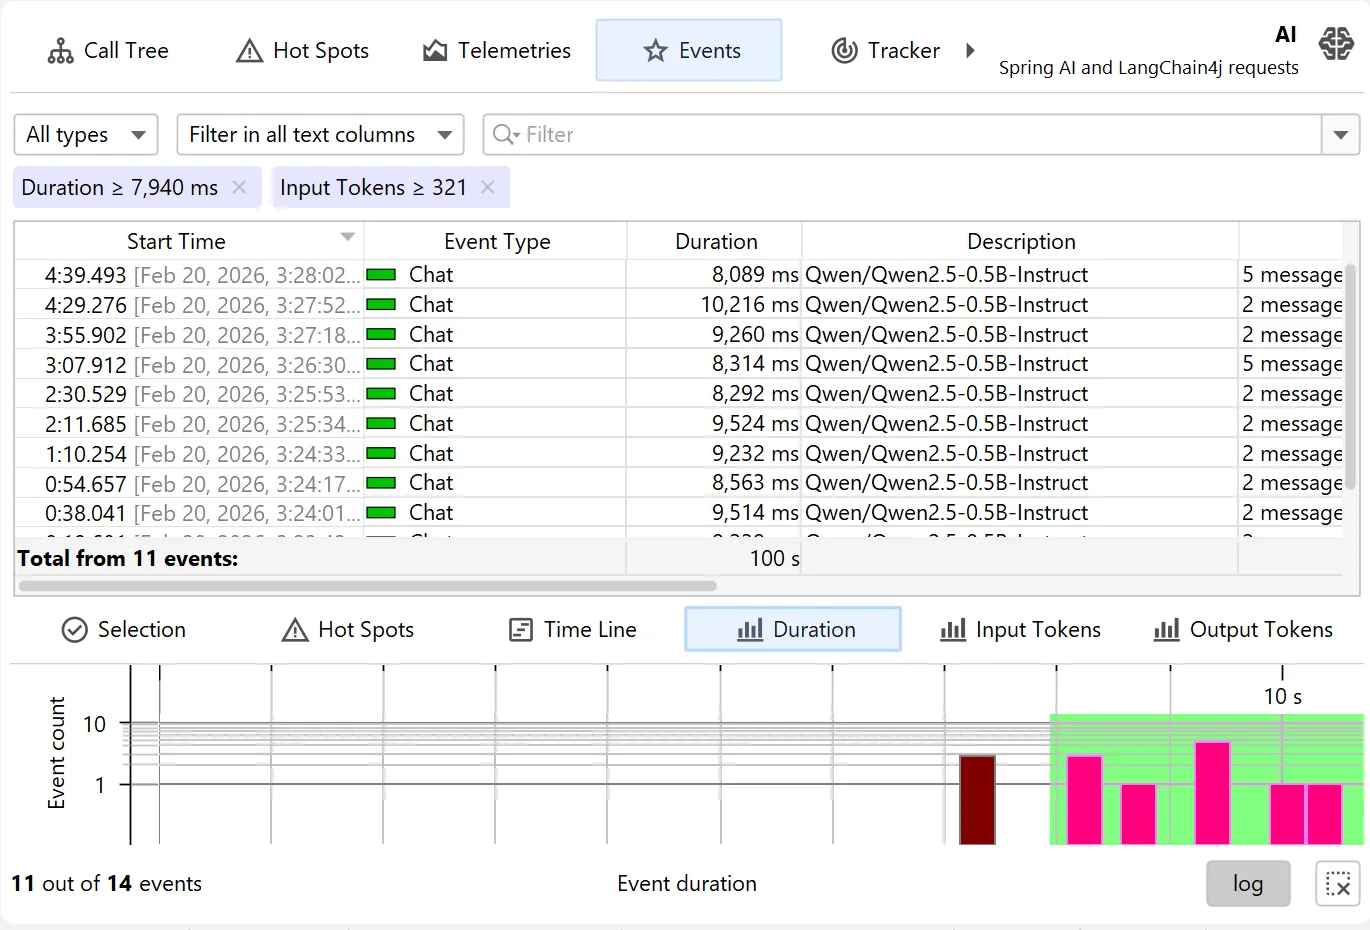
While probes have previously only focused on duration of events, JProfiler 16 introduces switchable primary metrics. With the AI probe, these include input tokens and output tokens. This allows you to identify which prompts are driving up costs or causing latency spikes.
In the probe events view, you can inspect the entire contents of each prompt. This is potentially a massive amount of data. We've used this opportunity to advance JProfiler's event system from the original role as a debugging helper to a file-backed high-performance data store in this release. This enables event-centric views such as the AI probe and benefits all other existing probes.
The events view can now be the control center when working with a probe: With its advanced filtering capabilities you can trim the set of events across multiple dimensions and use the secondary views at the bottom to inspect hot spots, call trees, distribution histograms and timelines.
Scripting and Custom Hot Spots
For many probes, the most useful perspective is to look at its hot spots. For example, the JDBC probe shows you cumulative data for all measured prepared statements. With the AI probe, it is less obvious how to extract a "hot spot" string for multiple concurrent requests and how to name them.
By default, JProfiler shows the model name. This is a valid hot spot perspective, especially if you work with multiple models, but falls short for many other use cases and problem scenarios.
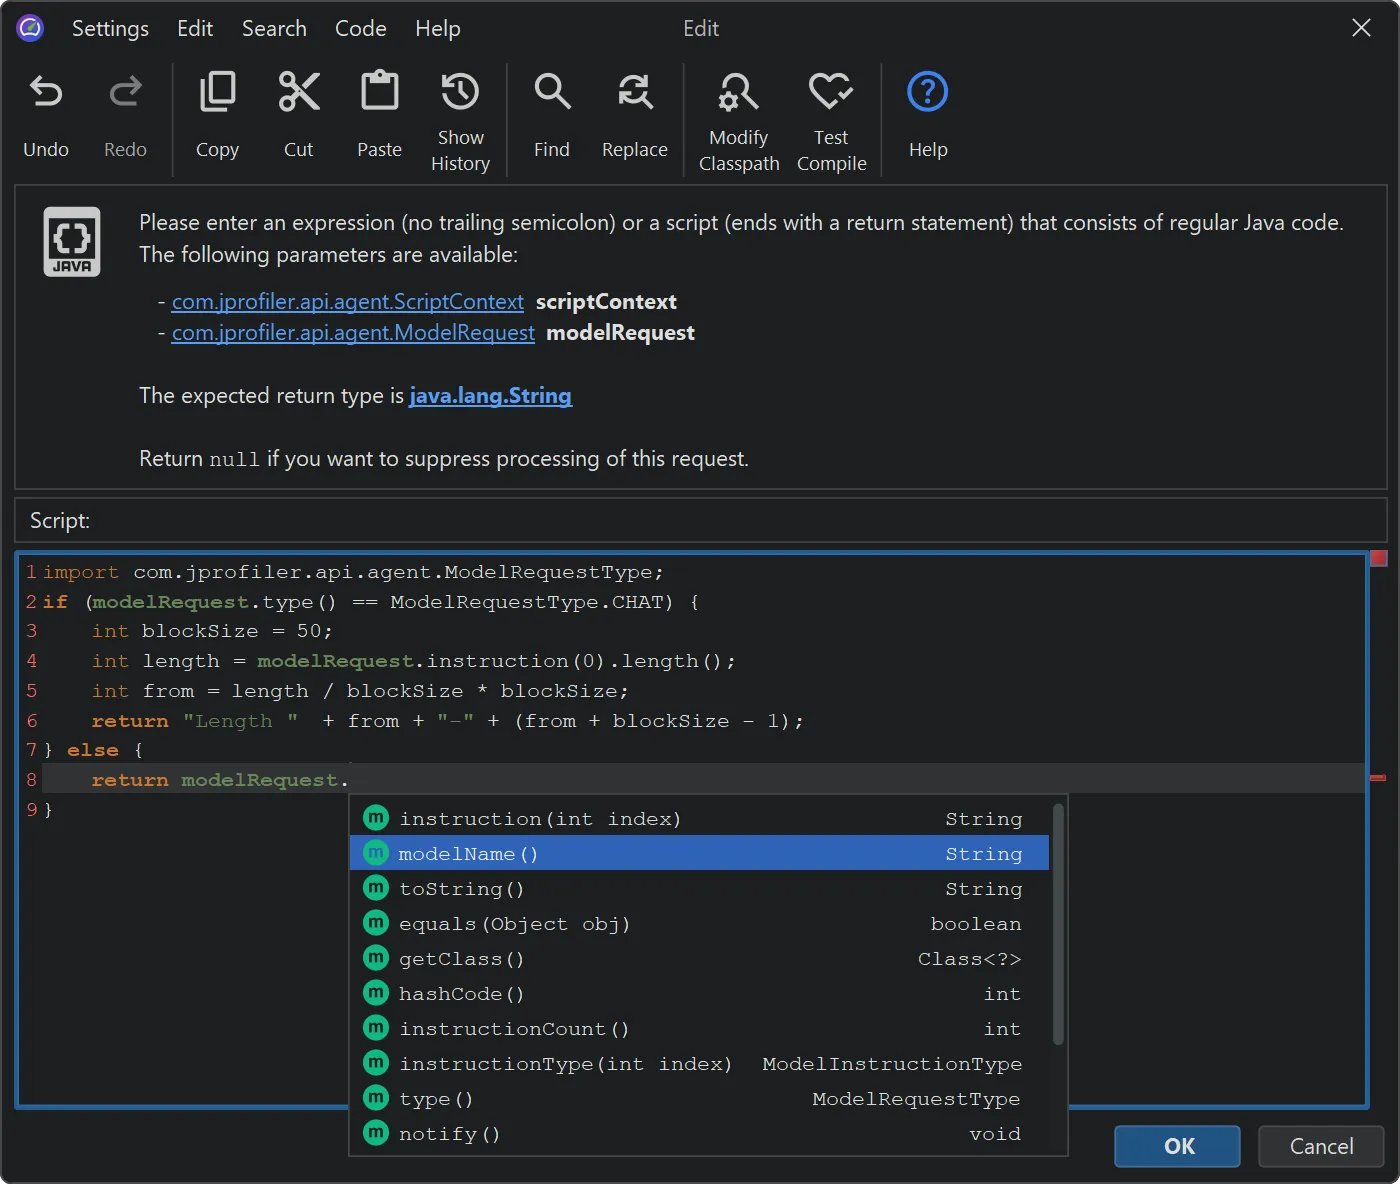
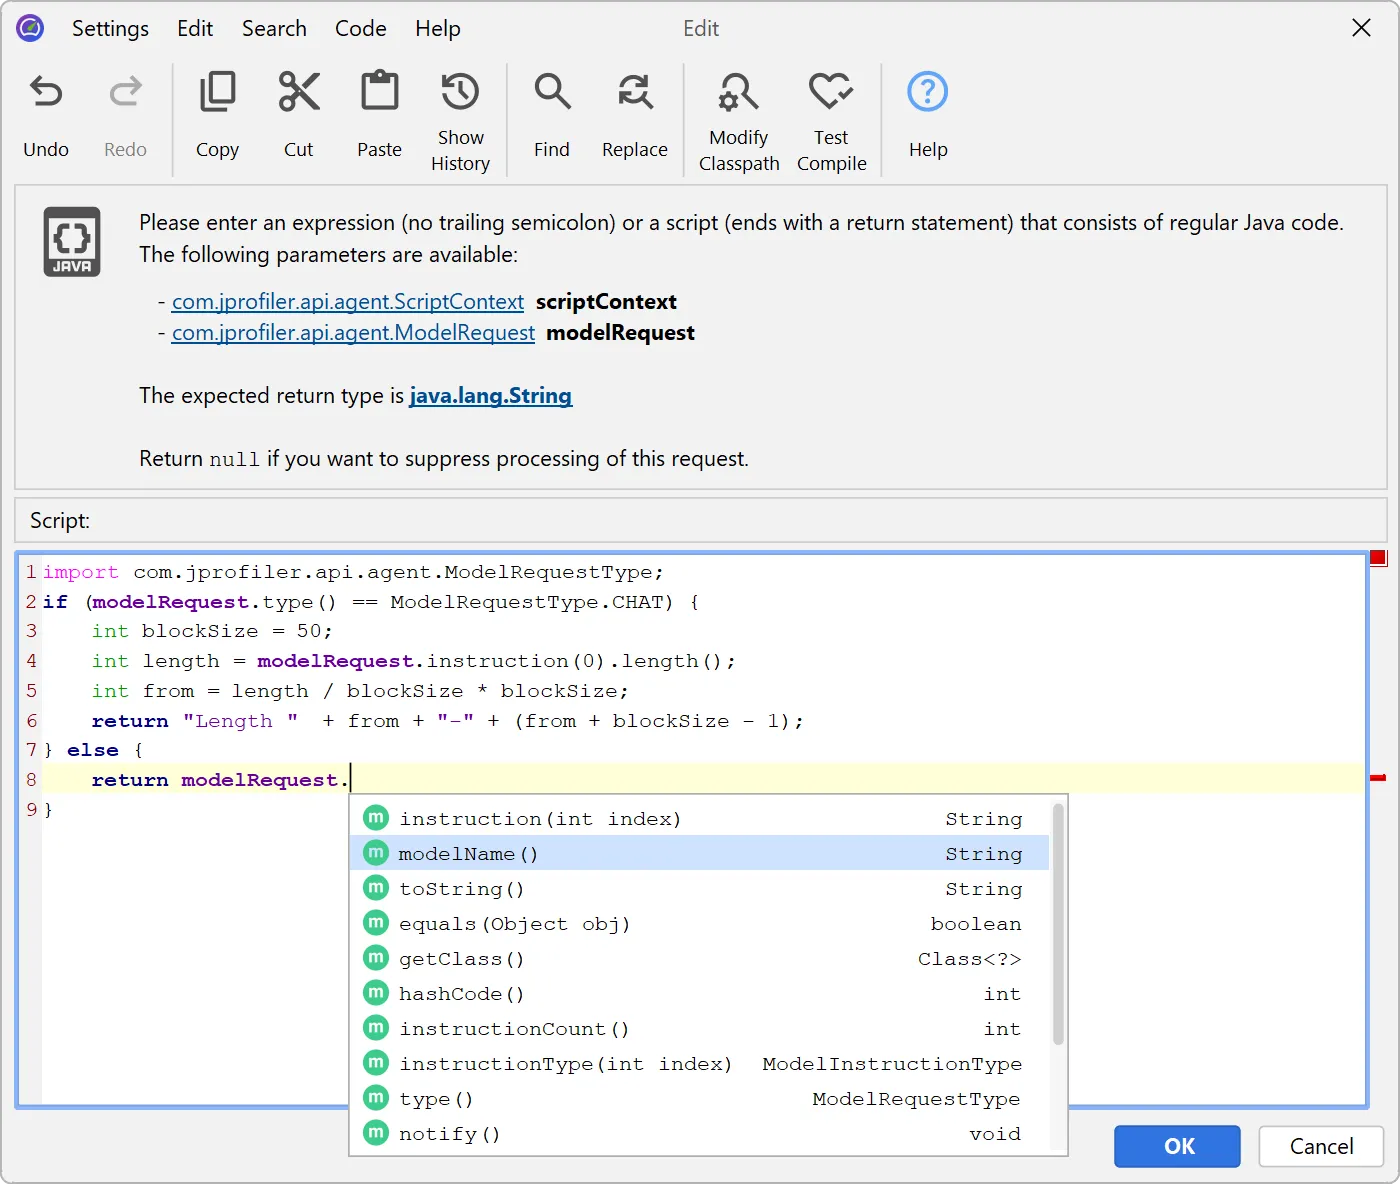
Once again, JProfiler's extensive support for scripting comes to the rescue: In a modern Java editor with code completion, inspections, quick fixes and refactorings, you can enter a script to extract a string that classifies the LLM request. To help you extract the required data, JProfiler includes an API that models the request.
JProfiler will compile the script and transfer it to the profiled JVM. Each time a call is made, the script will be run and data for the cumulative hot spots view will be calculated.
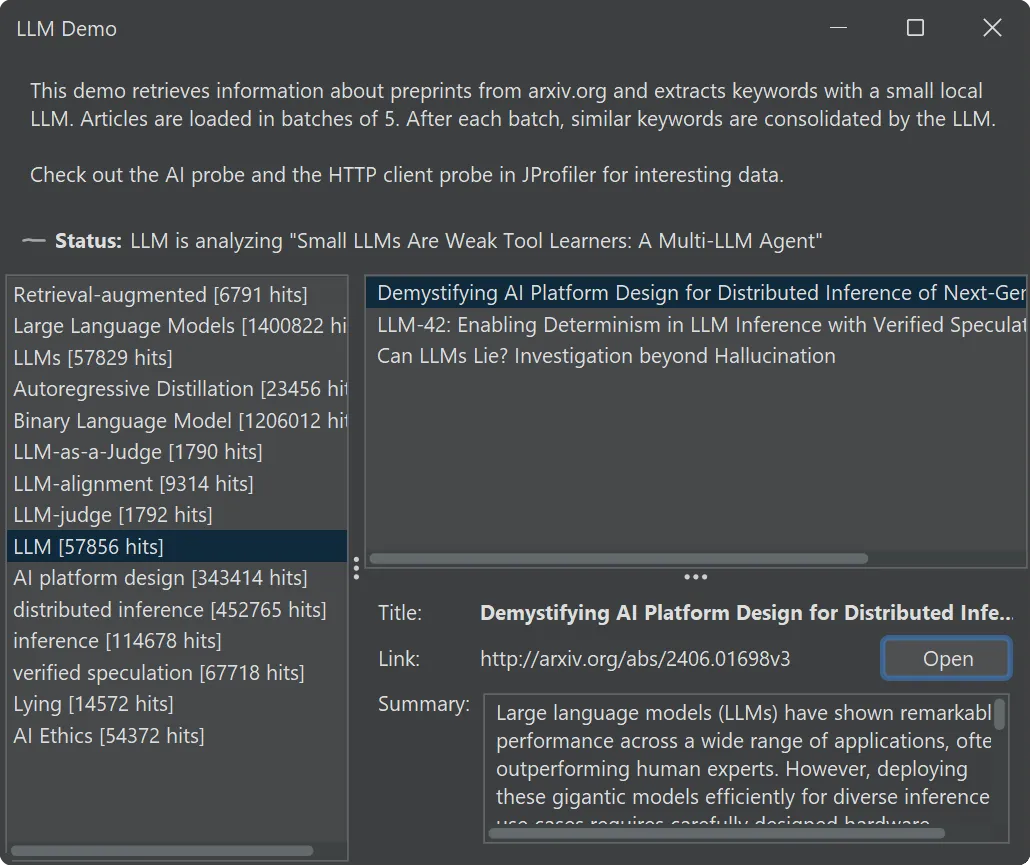
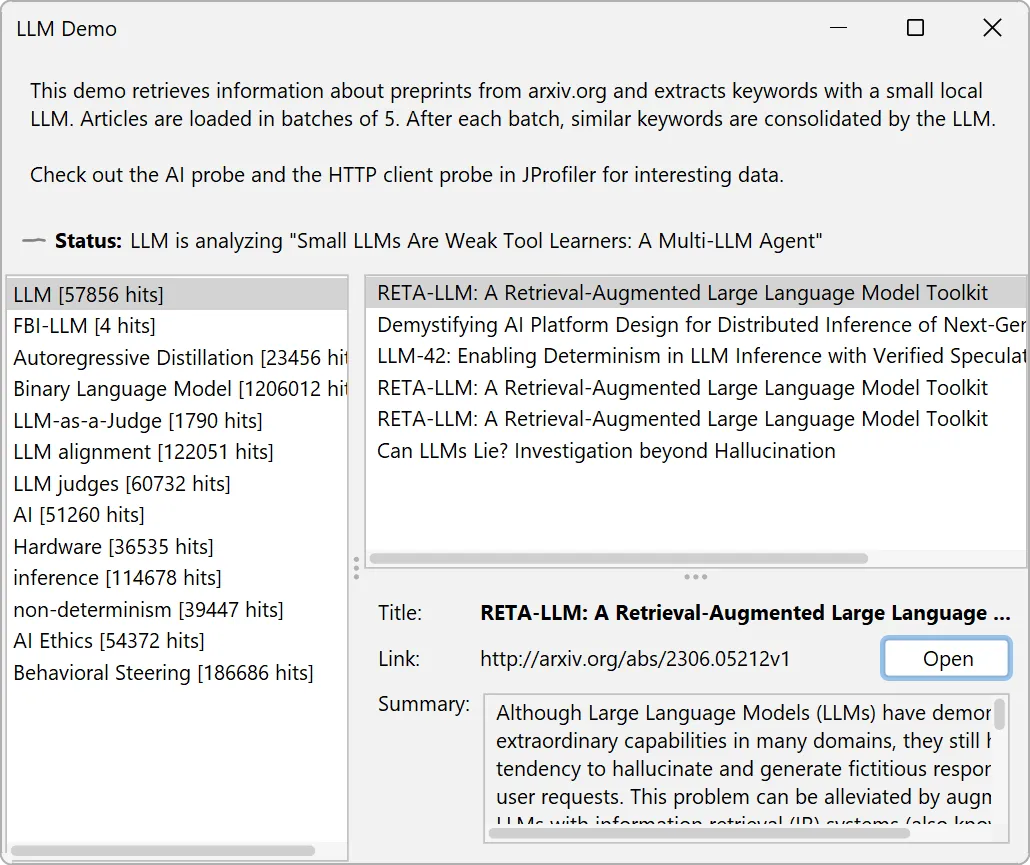
Practical Exploration: The LLM Demo
For developers who are considering working on agentic applications, we have included a demo app in this release. It allows you to explore the features of the AI probe without access to a real-world application.
Matching the theme of the AI probe, it downloads article summaries from the arXiv pre-print server and extracts keywords from them. After processing a batch of articles, it consolidates similar keywords.
With this demo, you can also see how to use the HTTP Client probe in tandem with the AI probe to inspect a workflow at different processing stages.
Foundations for the Future
The three main topics of this release are AI observability, massive scalability for probe events, and deep support for modern JVMs.
But we don't stop here. With JProfiler 16, our innovation has accelerated and it will continue to do so. Today, JProfiler provides the raw visibility needed to interpret the interactions between deterministic code and probabilistic models. Behind the scenes, we are laying the groundwork for future versions to move from pure observation to automated, AI-assisted performance heuristics. Stay tuned!