The power of async tracking in JVM profiling
Async operations can speed up applications and improve responsiveness, but they also introduce complexity. Especially in the context of profiling, understanding what really happened and why can be surprisingly tricky. This post shows how JProfiler's async tracking feature helps fix hard performance problems in your application.
Why are async calls important?
Unless you are fortunate enough to have virtual threads at your disposal, making async calls is the only way to stop blocking the current
thread while a task is being executed. Many systems and frameworks have a canonical way of doing this, such as submitting a
CompletableFuture to an ExecutorService. In an async call, the task is executed by a different thread, and the result
(if one is even needed) can be processed by a callback.
UI systems are typically built in such a way that there is a single event dispatch thread that can modify and repaint UI components. Web browsers are built this way, but also all common JVM UI toolkits, like Swing, SWT and JavaFX.
The problem
A common problem with async calls is that a stack trace from the deferred task has no connection to the thread that initiated the task. This makes debugging notoriously difficult ("callback hell"), and it's an even greater problem for profiling. In most cases, you don't look at methods in isolation, but you always want to attribute the cumulative measured time of any method to the parents in the call stack. In this way, you find out who is responsible for a performance problem which helps you to fix it.
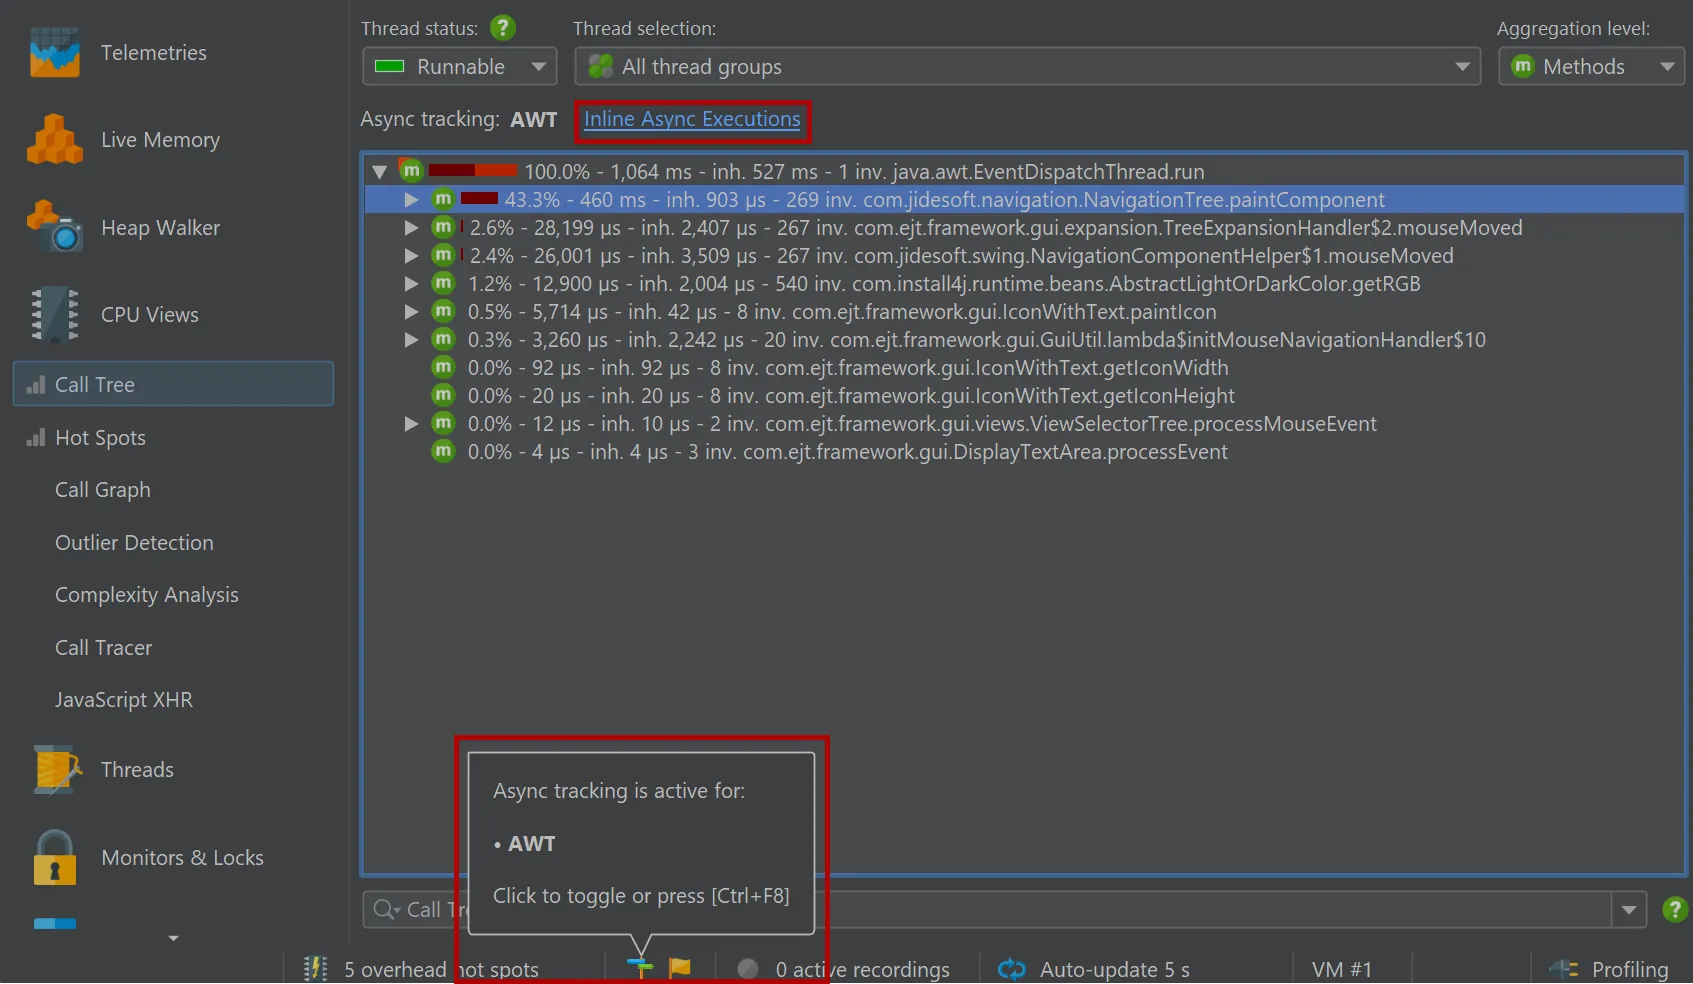
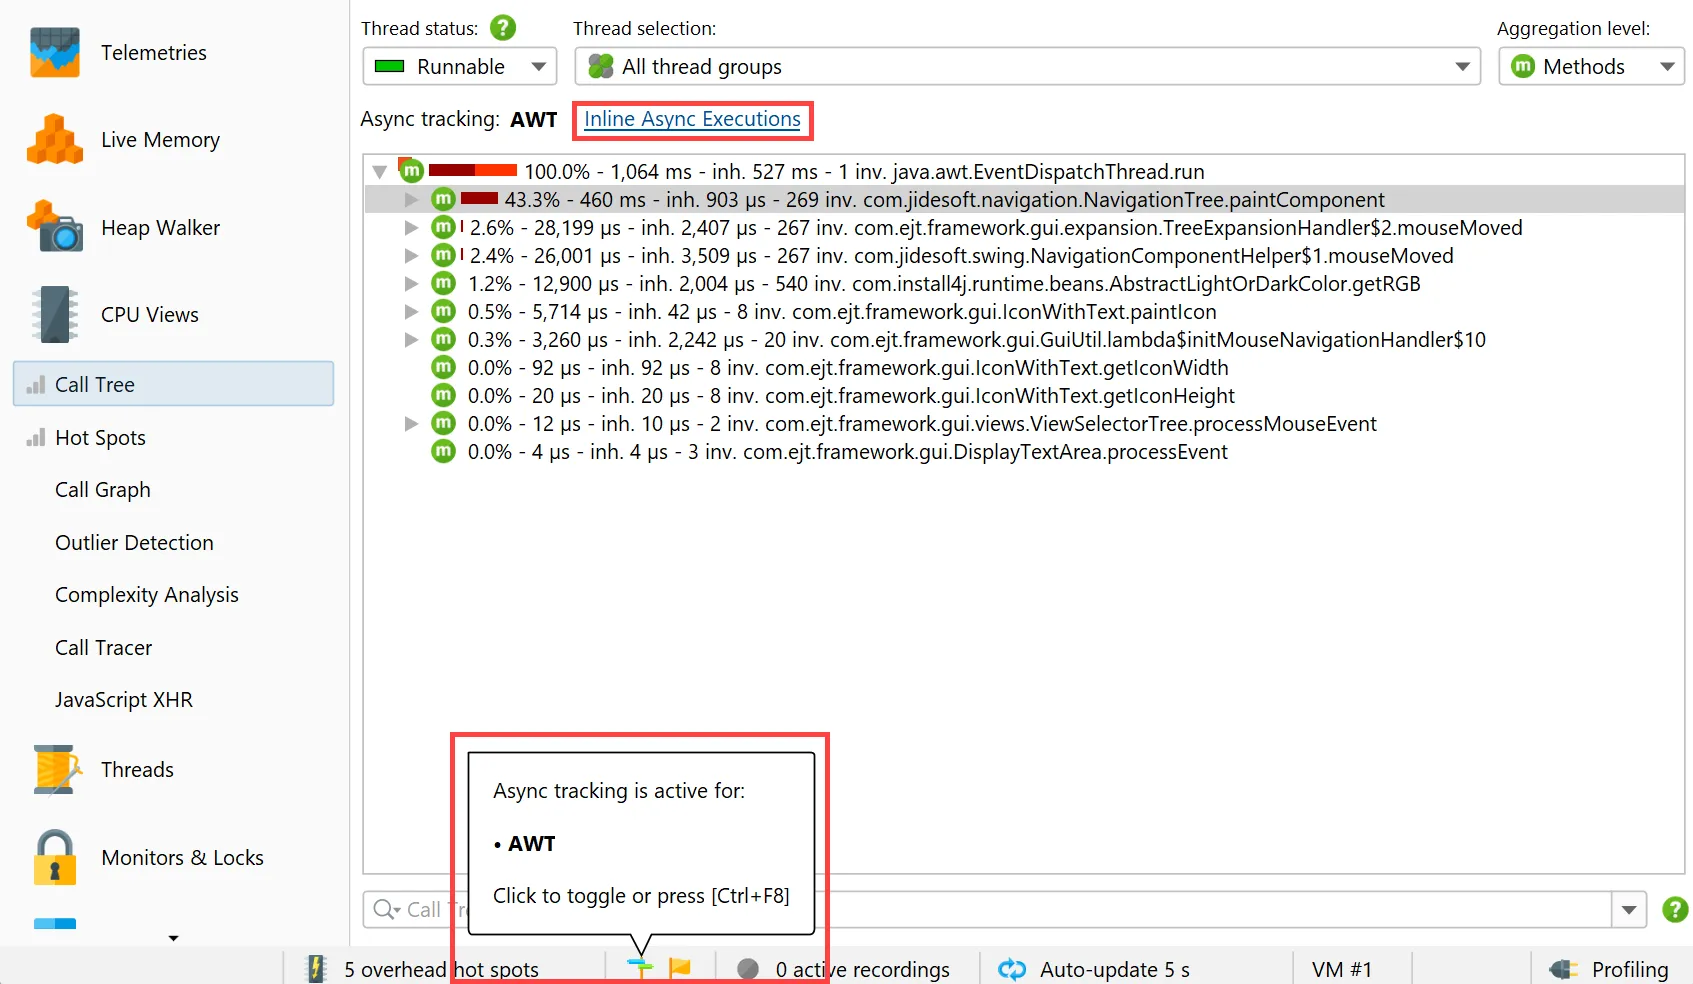
Let's look at an example. The call tree below shows the install4j UI while the user hovers over a single item in the view selector without any
visual change. The consumed times are quite a bit more than we would expect. The root node in the call tree is the event dispatch thread
and contains unprofiled classes in its internal machinery. Below it, we directly see the NavigationTree.paintComponent method
that runs on the event dispatch thread. There is no indication of who triggered this method, either via an EventQueue.invokeLater or
an EventQueue.invokeAndWait call.
Enter async tracking
With JProfiler, you have a tool at your disposal that can stitch together async call sites with async execution sites. In the profiled example, async tracking for AWT was active. This is off by default, so you need to switch on the particular kind of tracking that's useful for your application by clicking on the tracking icon in the status bar or showing it in the "Profiling" menu.
When async tracking is enabled, a hyperlink label is shown above the call tree. When you click on it, JProfiler calculates a call tree where all tracked async calls are inlined.
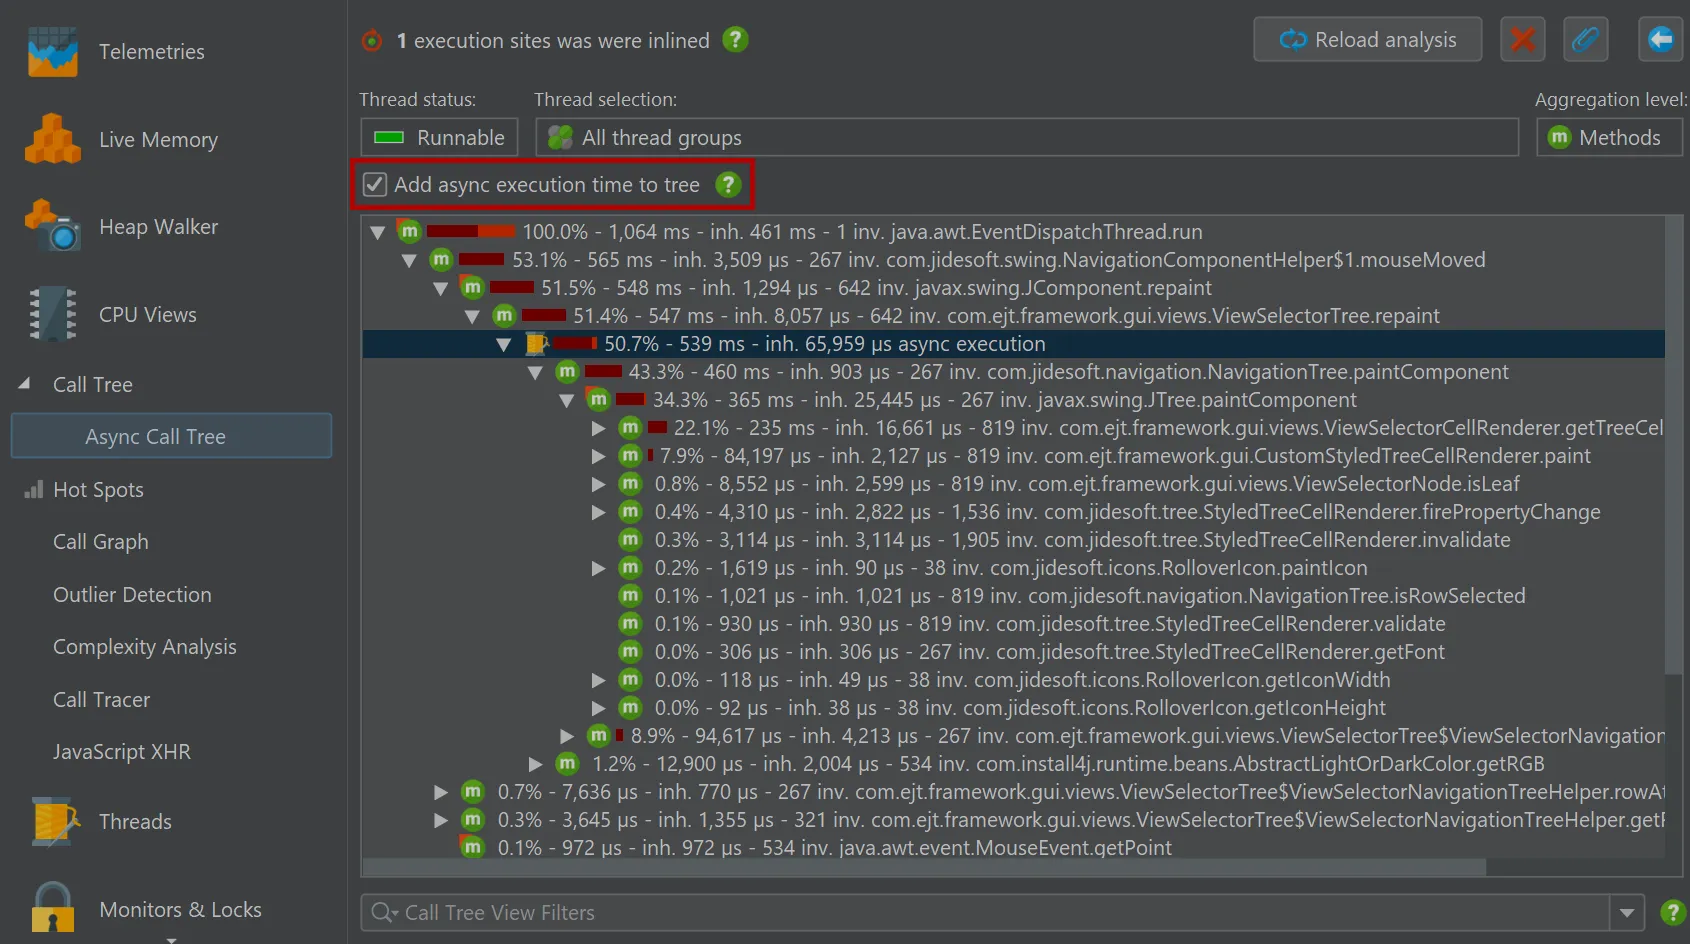
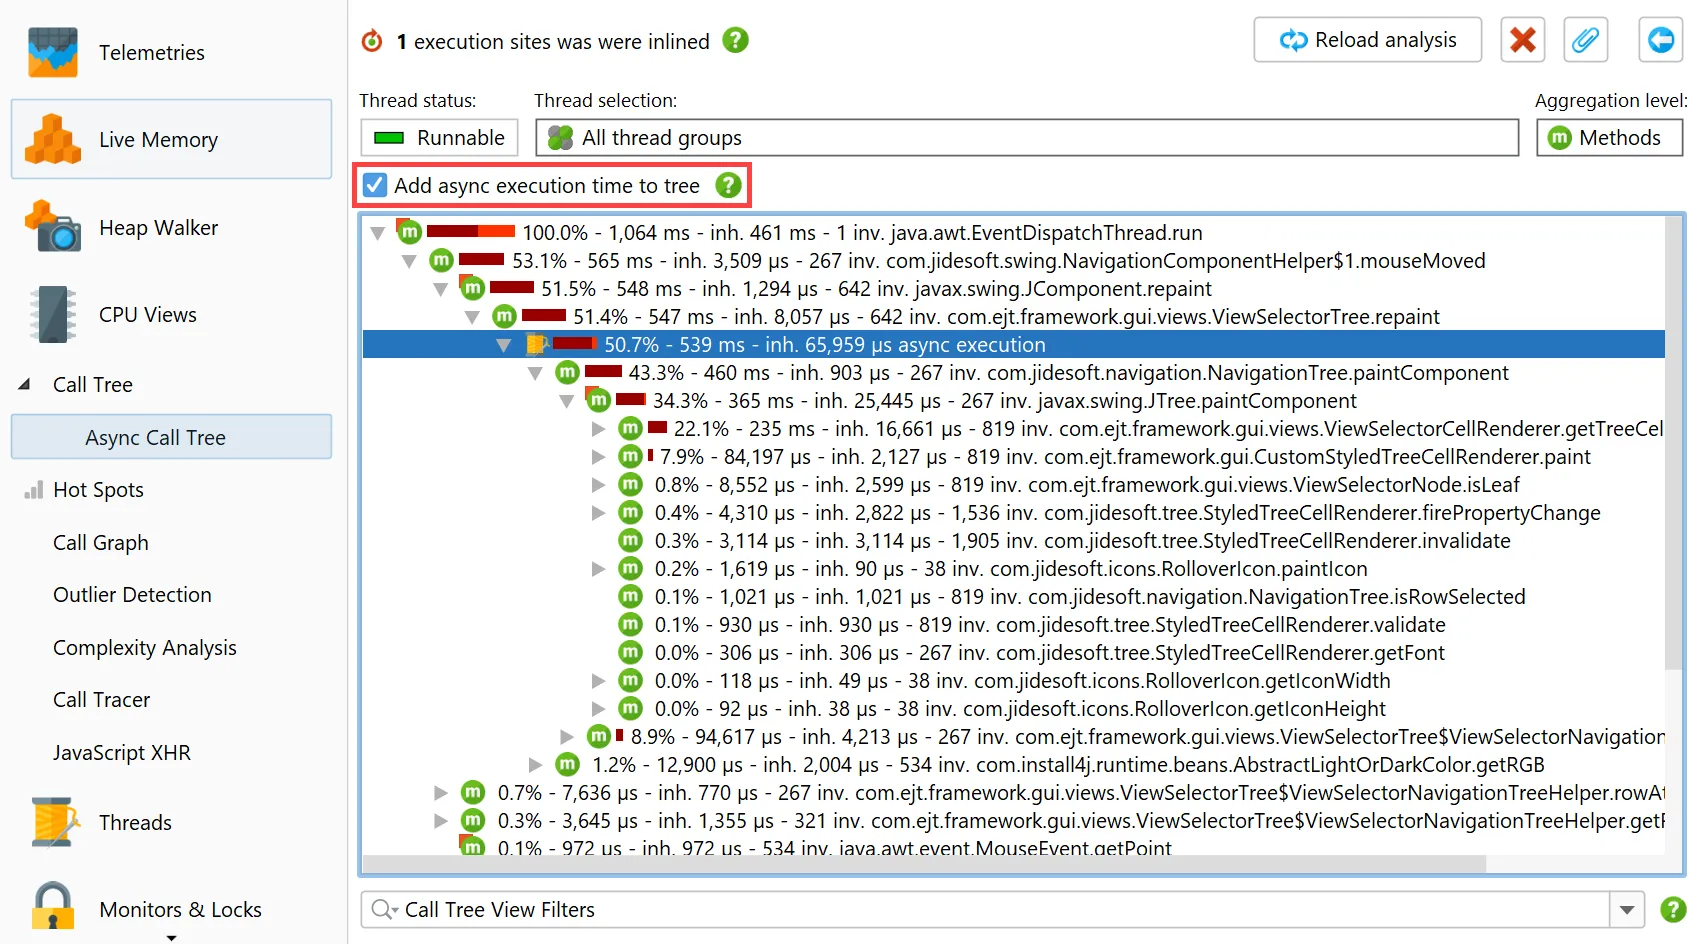
The "Add async execution time to tree" checkbox above the call tree is important. If you select it, the time spent in the async execution is added to the parent node in the call tree. It then effectively treats async calls as if they were blocking calls. This is very useful to find hot paths in the async execution sites by starting from the top of the tree.
Fixing the problem
In the async call tree, we see that the mouseMoved method of the MouseMotionListener in
NavigationComponentHelper issues a lot of repaints. We can now check the source code of that method and prevent unneeded repaints
where the visual representation of the view selector does not change.
This example translates to many real-world scenarios with the other supported tracking types. Async support in your profiling tool is a crucial feature that enables you to productively fix performance problems in your application. Try it out with the latest JProfiler version and convince yourself of the power of async tracking!