JProfiler tips roundup May 2025

I regularly share practical advice and insights on JProfiler and install4j on social media, covering features, shortcuts, and use cases. This blog post collects everything shared in May 2025. Each section rewrites the original thread in plain text.
Follow me on to catch future tips as they’re posted.
1. Correlating XHR calls with backend activity in JProfiler
JProfiler supports correlating JavaScript XMLHttpRequest and fetch() calls with backend server activity through
XHR origin tracking. This feature helps identify which user interaction triggered a particular backend request.
To enable this functionality, install the JProfiler origin tracker Chrome extension. When active, it intercepts XHR calls in the browser and links them to the running JProfiler session. In JProfiler’s JavaScript XHR view, you’ll find a combined call tree of all tracked XHR calls handled by the profiled JVM.
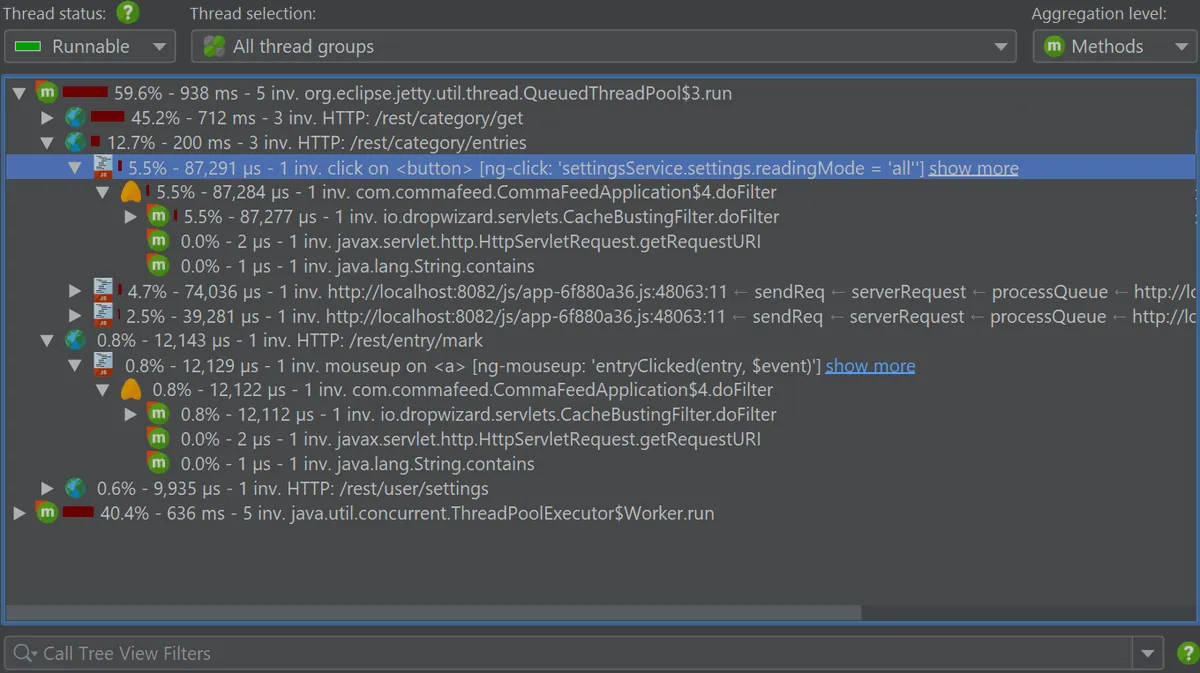
This view shows JavaScript stack traces with source files and line numbers and hyperlinks to the corresponding server-side call tree.
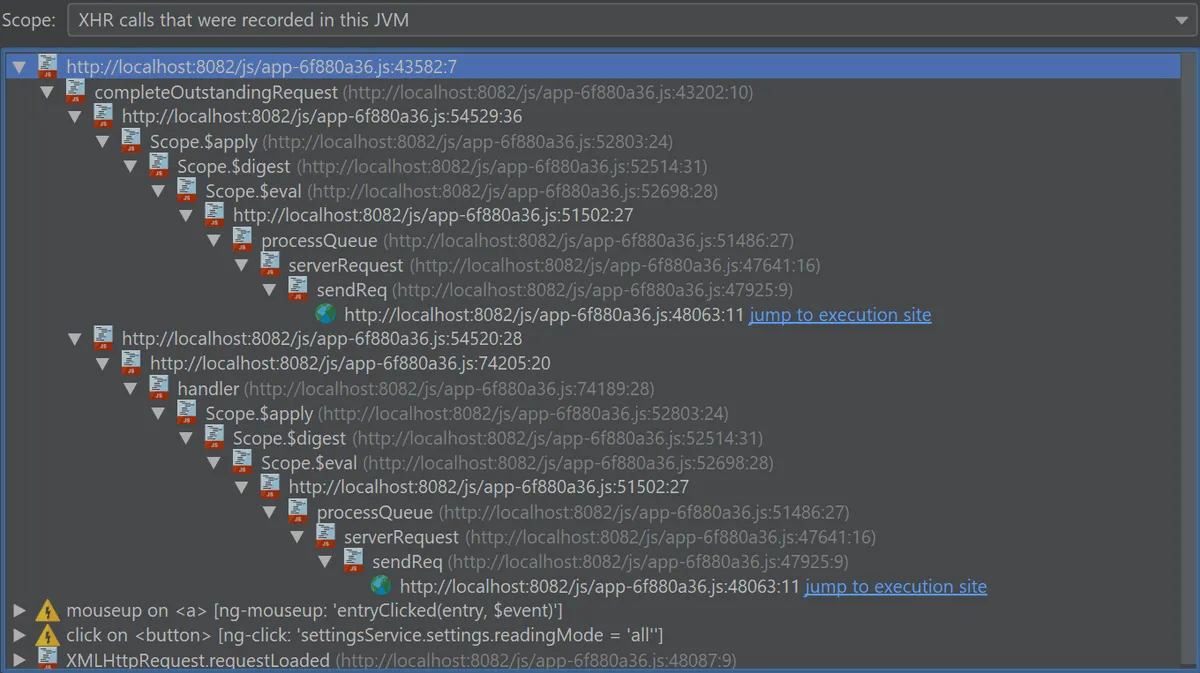
In the call tree, XHR nodes are grouped by the triggering browser event (e.g., click, submit), the DOM element, and the JavaScript call stack.
For projects using popular JavaScript frameworks, the extension traverses the DOM tree to locate meaningful splitting attributes.
You can also manually specify an attribute by adding data-jprofiler="..." to any DOM element.
2. JProfiler’s integrated MBean browser
JProfiler includes a built-in MBean browser that allows you to explore, edit, and visualize JMX data directly, without needing remote JMX access.
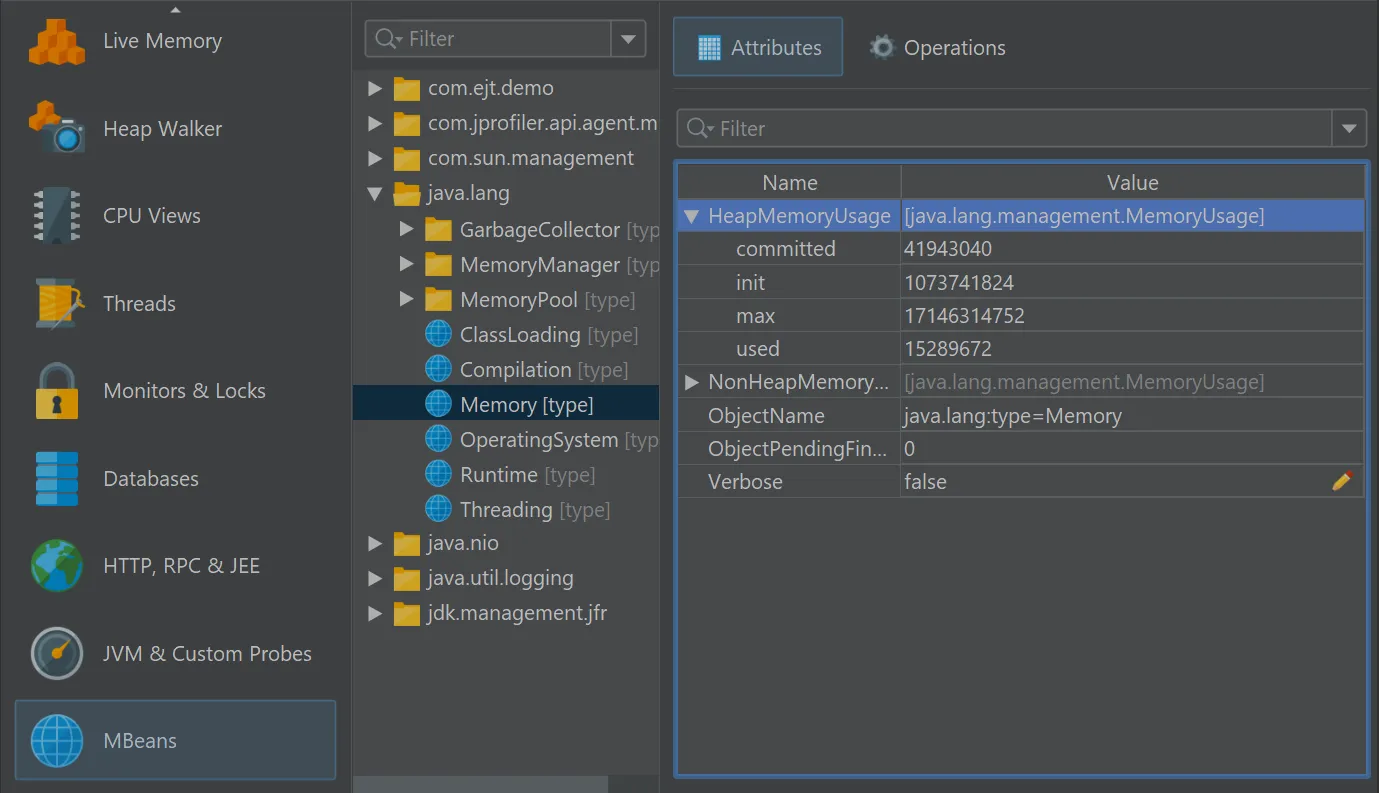
MBeans provide a standard way to expose runtime data and modify configuration in Java applications. They are published by app servers like Tomcat, frameworks like Apache Kafka, or by internal JVM metrics. JProfiler’s MBean browser automatically discovers all MBeans registered in the JVM being profiled.
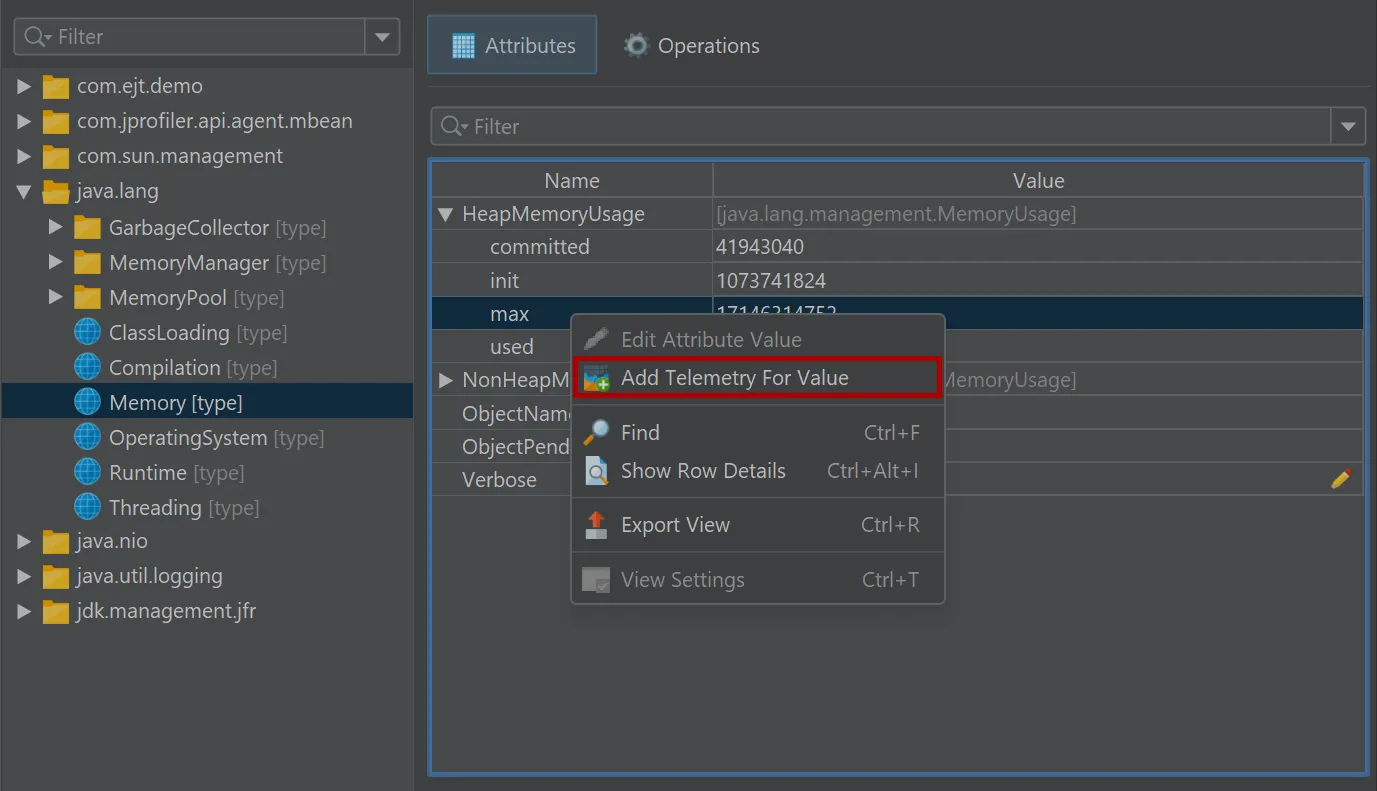
If an attribute is editable, an edit icon allows direct modification of arrays or simple types.
JProfiler also supports defining custom telemetries from numeric MBean attributes. A custom telemetry can be created for any numeric value via the context menu, including nested fields in composite or tabular data.
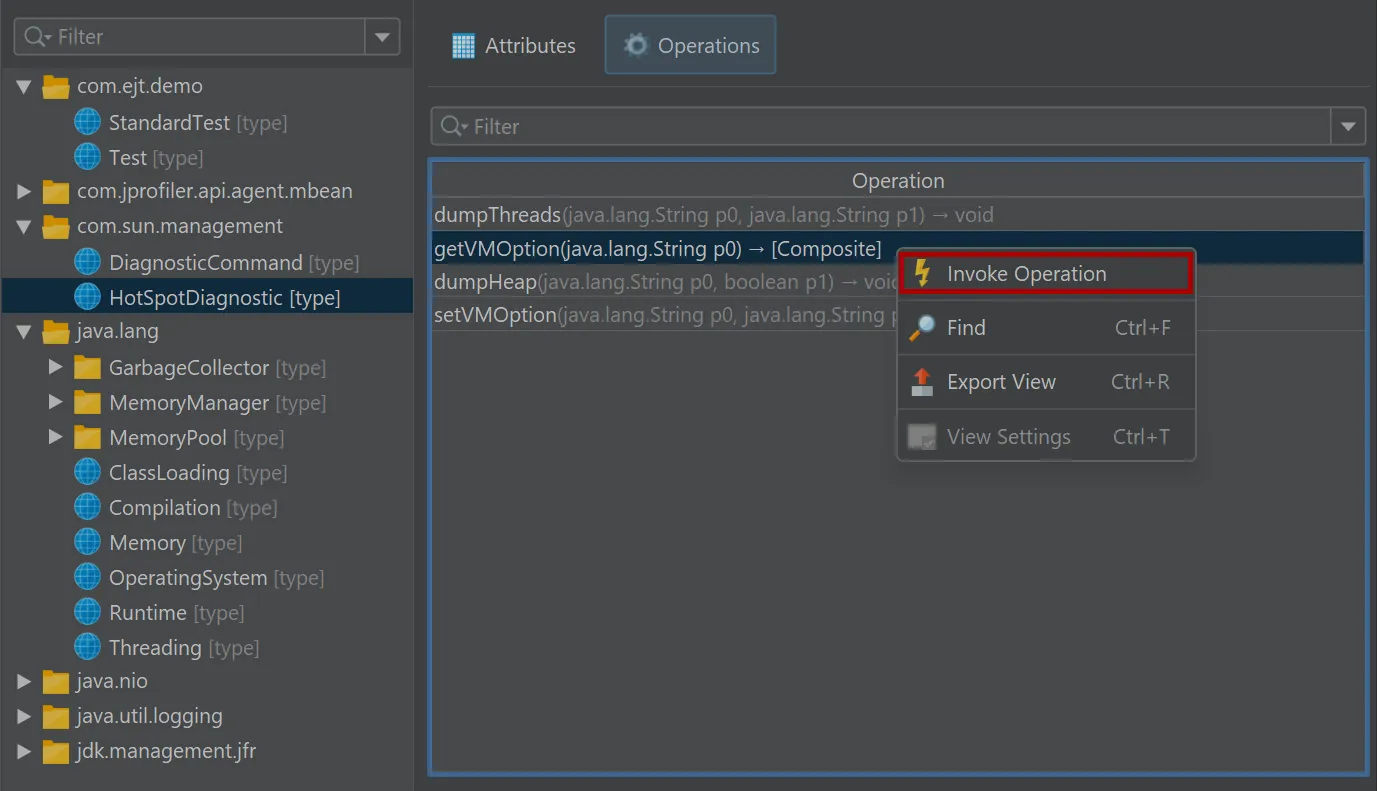
MBean operations are available too. You can invoke operations with parameters and see the structured return value.
3. Analyzing native HPROF and PHD heap snapshots in JProfiler
JProfiler can open native HPROF and PHD heap snapshots from any JVM, including HotSpot, Android, and IBM J9.
Use Session -> Open Snapshot in JProfiler to analyze HPROF or PHD files. The heap walker is fully available for
in-depth memory analysis.
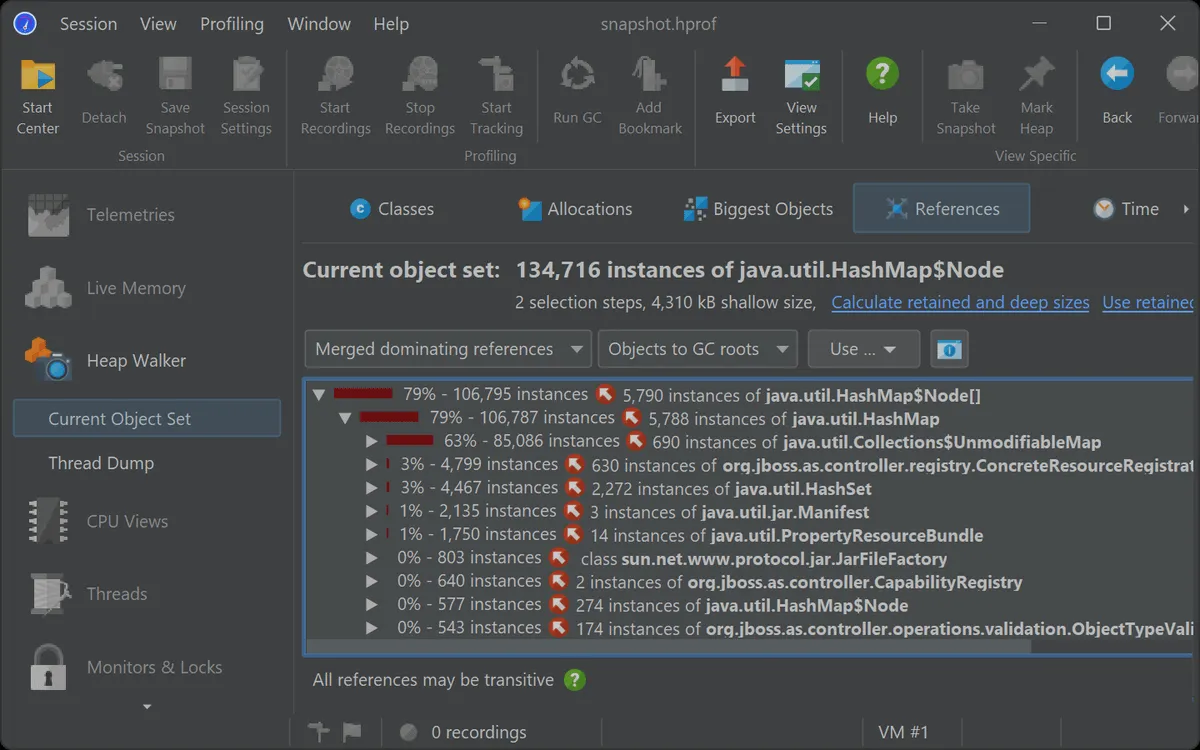
These native heap snapshots are saved directly by the JVM or command-line tools, allowing you to capture the heap state without attaching the JProfiler agent. This is helpful in production environments where agents are not allowed.
Note that native heap snapshots support fewer features than JProfiler snapshots. Allocation call stacks are not available, and only the heap walker is enabled. All other sections are grayed out.
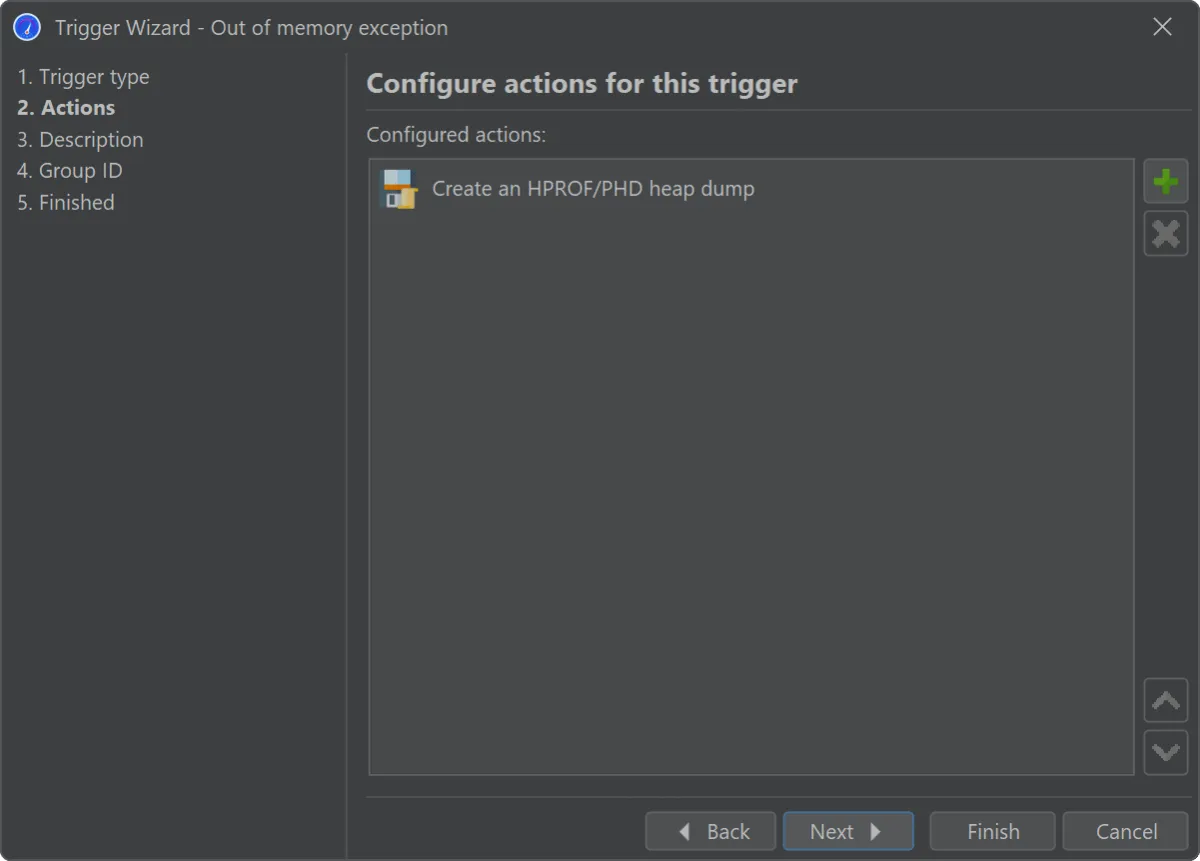
You can also create HPROF or PHD heap snapshots from a live session in JProfiler, either through the menu or by setting up trigger actions.
A common use case is saving a heap snapshot automatically on OutOfMemoryError.
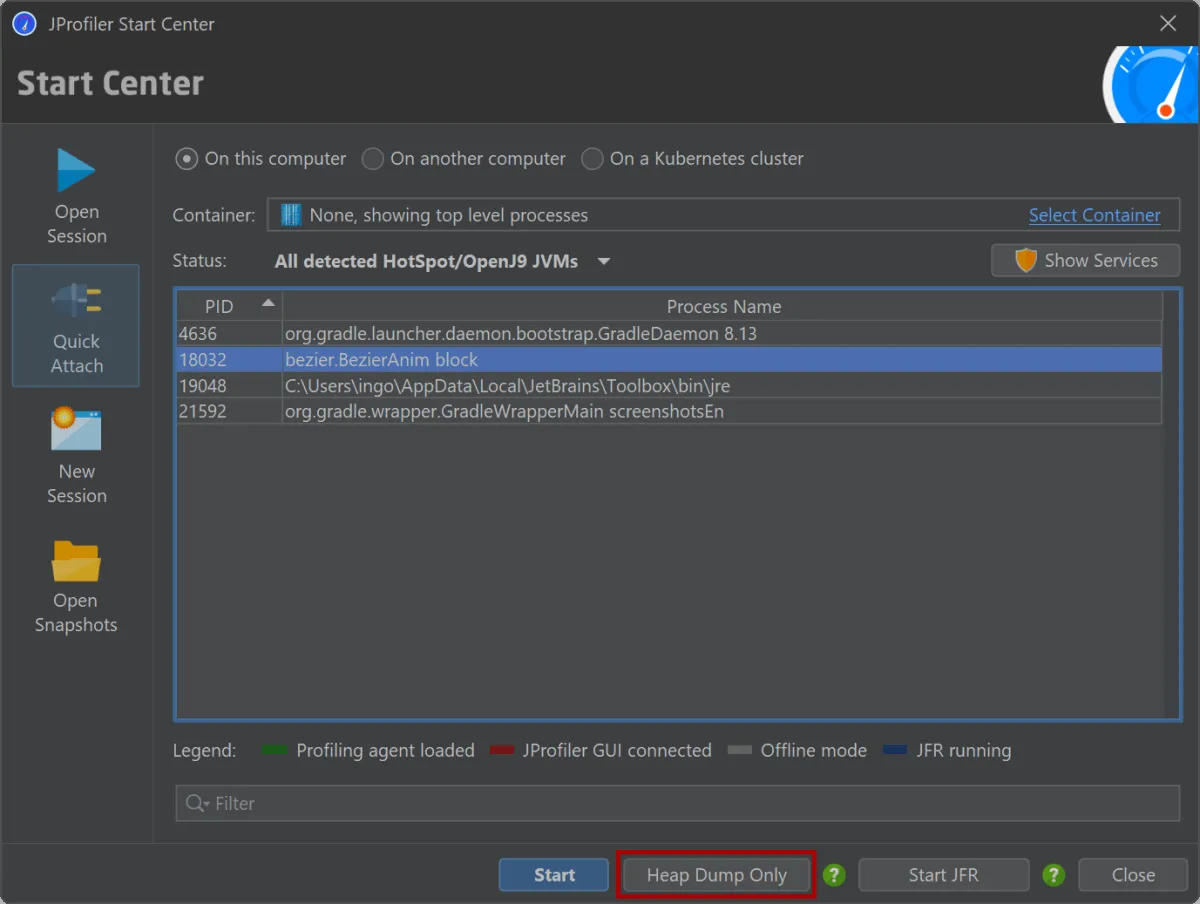
JProfiler supports taking HPROF snapshots without loading the profiling agent, both locally and remotely, directly from the attach dialog.
For command-line workflows, JProfiler ships with bin/jpdump, an alternative to jmap that handles process selection,
Windows services, mixed 32/64-bit JVMs, and auto-numbers files.
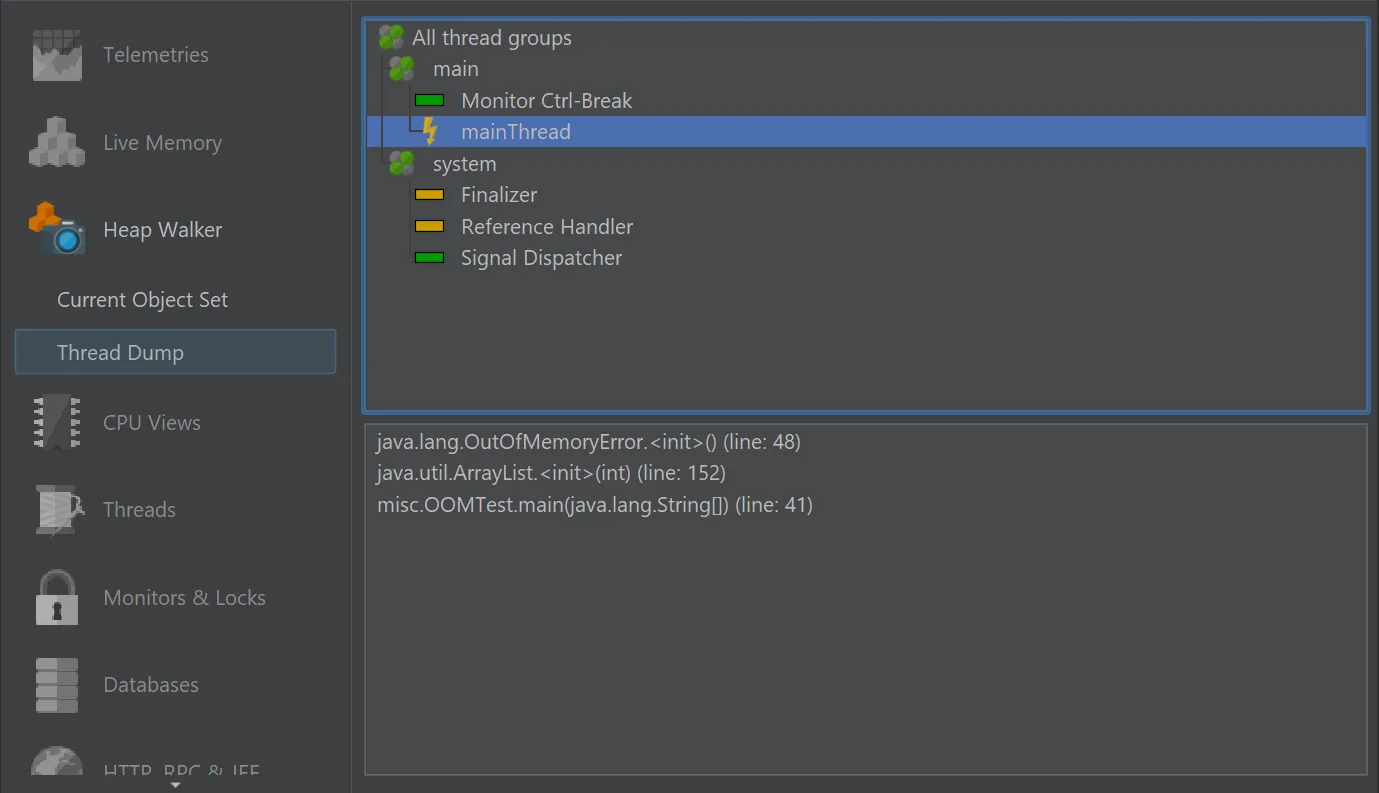
HPROF snapshots can include thread dumps. If the dump was triggered by an OutOfMemoryError, JProfiler highlights the responsible
thread, making it easier to identify what was happening at the time.