JProfiler tips roundup April 2025

I regularly share practical advice and insights on JProfiler and install4j on social media, covering features, shortcuts, and use cases. This blog post collects everything shared in April 2025. Each section rewrites the original thread in plain text.
Follow me on to catch future tips as they’re posted.
1. Comparing snapshots to explain performance changes
Snapshot comparisons in JProfiler help you answer questions like whether memory usage increased, I/O operations became more frequent, or a specific method slowed down.
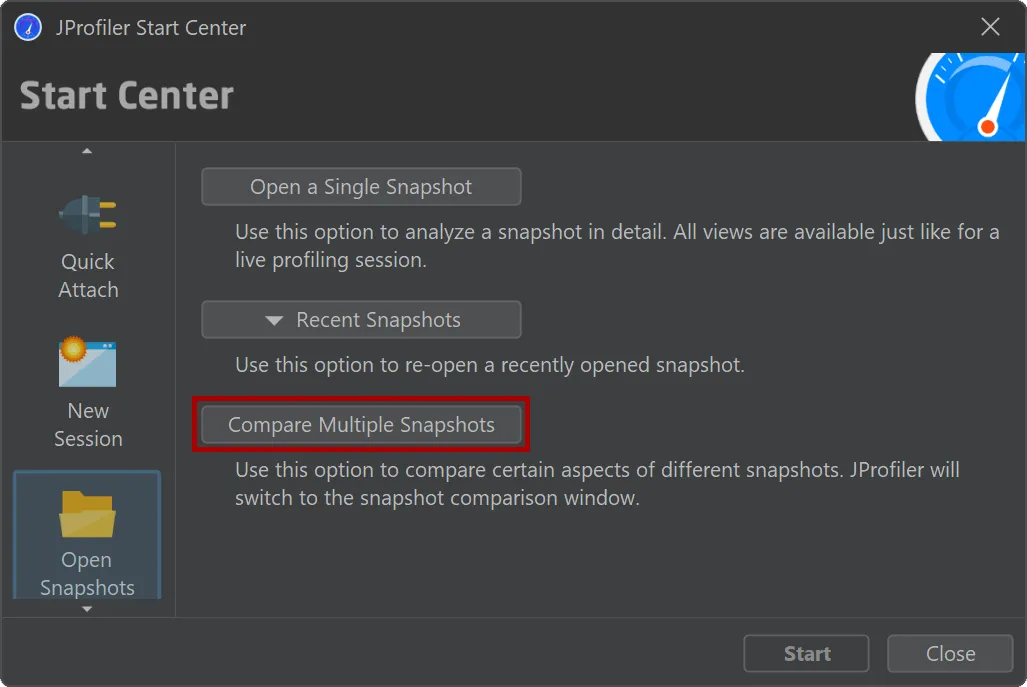
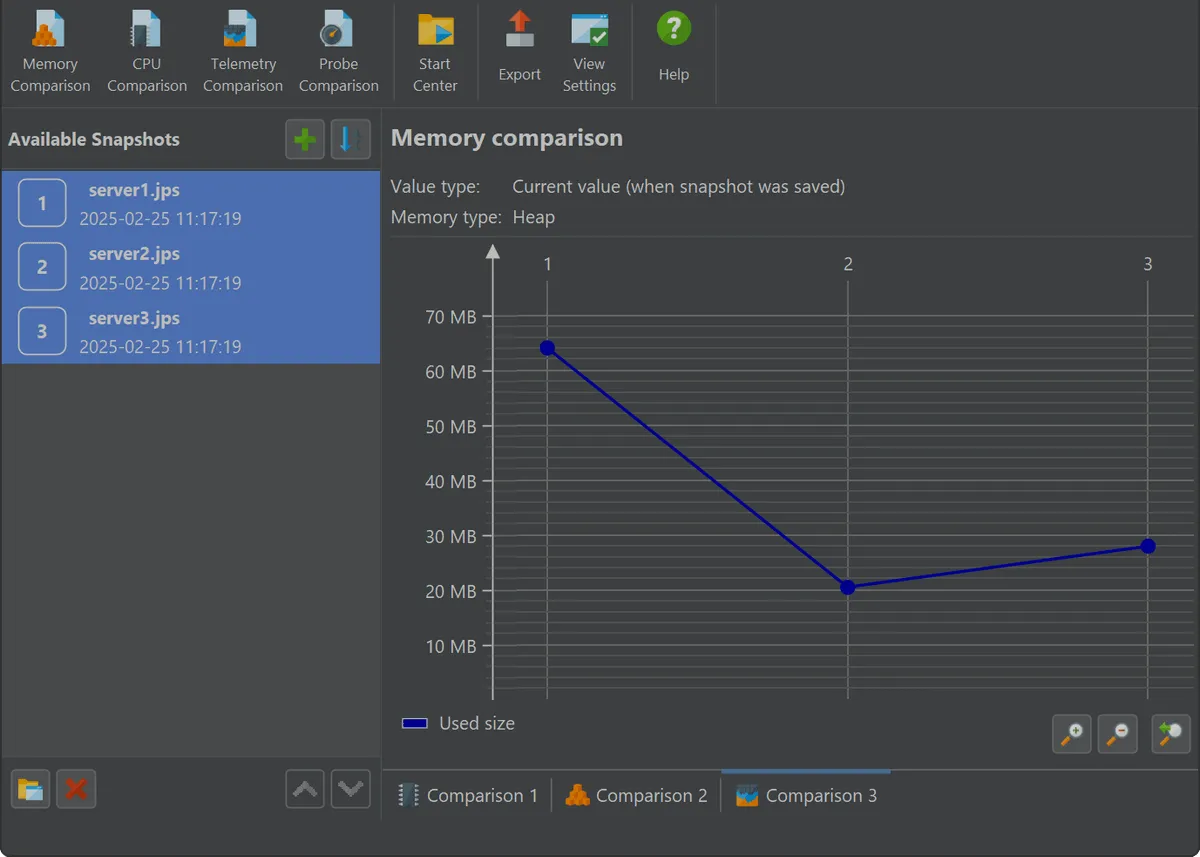
JProfiler provides four dedicated comparison views: CPU, memory, probe, and telemetry. These views let you analyze performance regressions or behavior differences between snapshots.
Each comparison type has its own wizard to help configure the baseline and target snapshots. Once set up, JProfiler presents a tailored UI for each case. For example, telemetry comparisons graph time series data such as heap usage across snapshots, making it easy to correlate metric shifts with changes in application behavior.
2. Visualizing Java locking behavior in real time
JProfiler offers a real-time view into Java synchronization by recording and analyzing both intrinsic locks (synchronized) and
java.util.concurrent locks. Locking events include blocking durations, involved threads, and the specific monitor or lock objects,
making it easier to debug deadlocks or optimize concurrency.
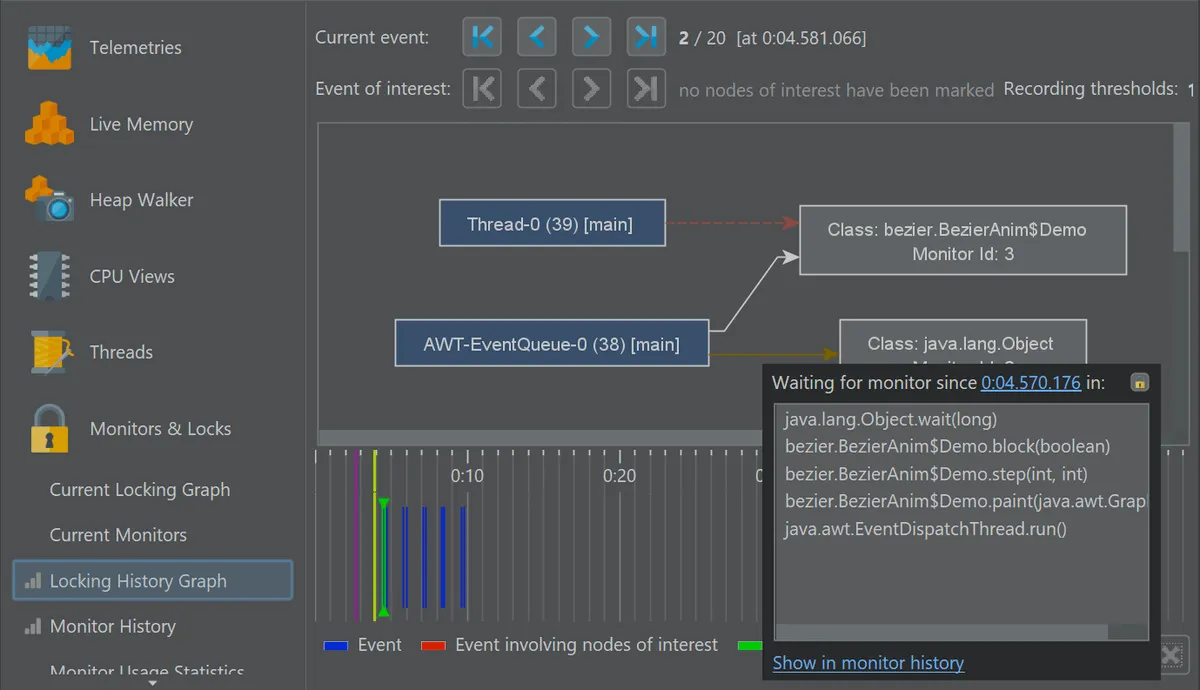
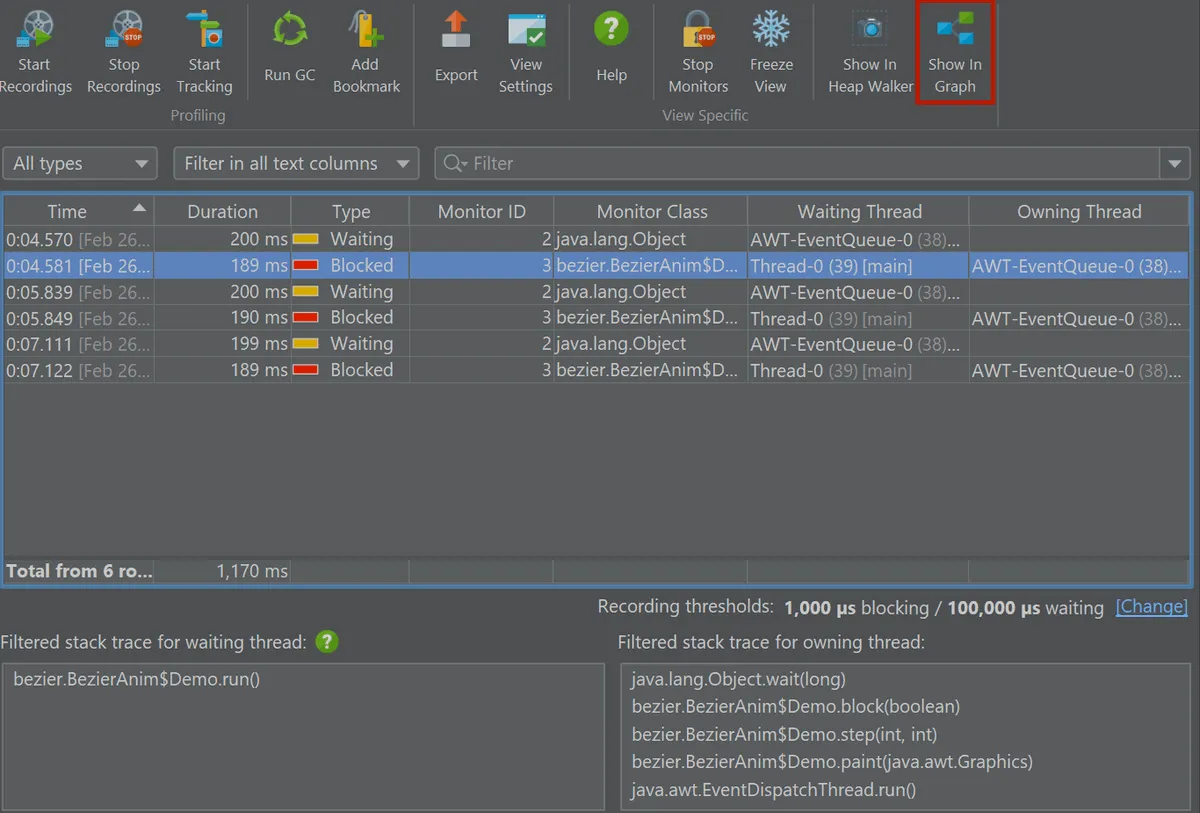
To reduce noise, JProfiler applies configurable thresholds so that only events above a certain duration are recorded.
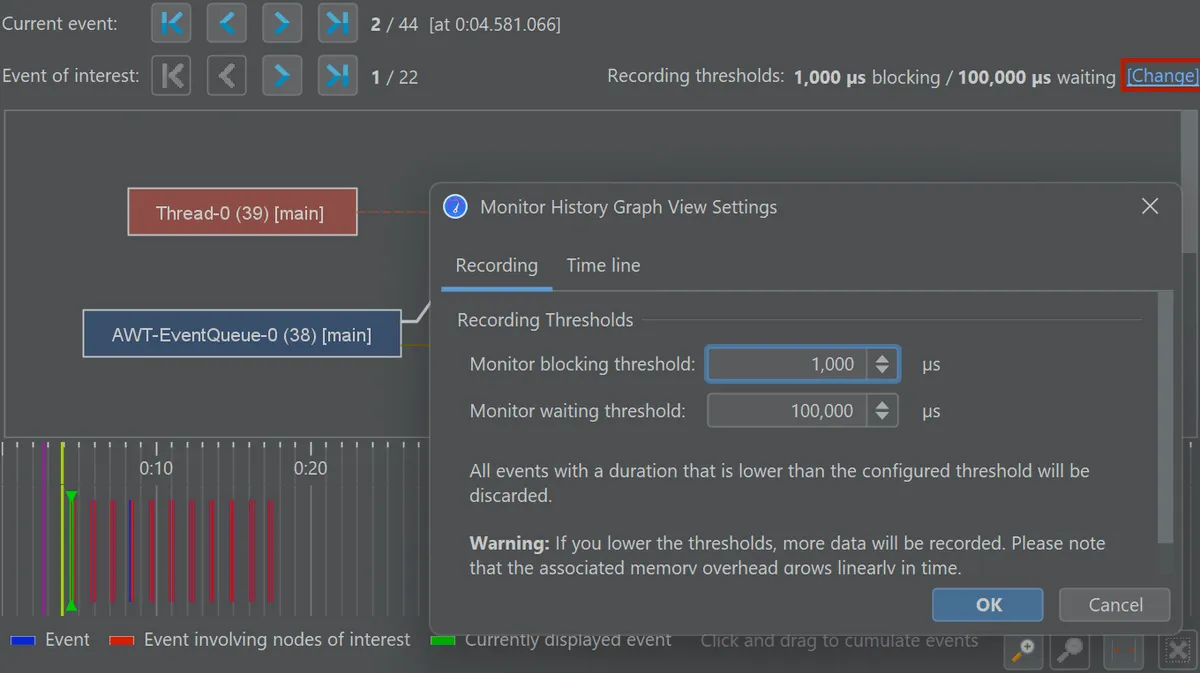
The monitor history view provides a searchable table with durations and stack traces for both the waiting and owning threads.
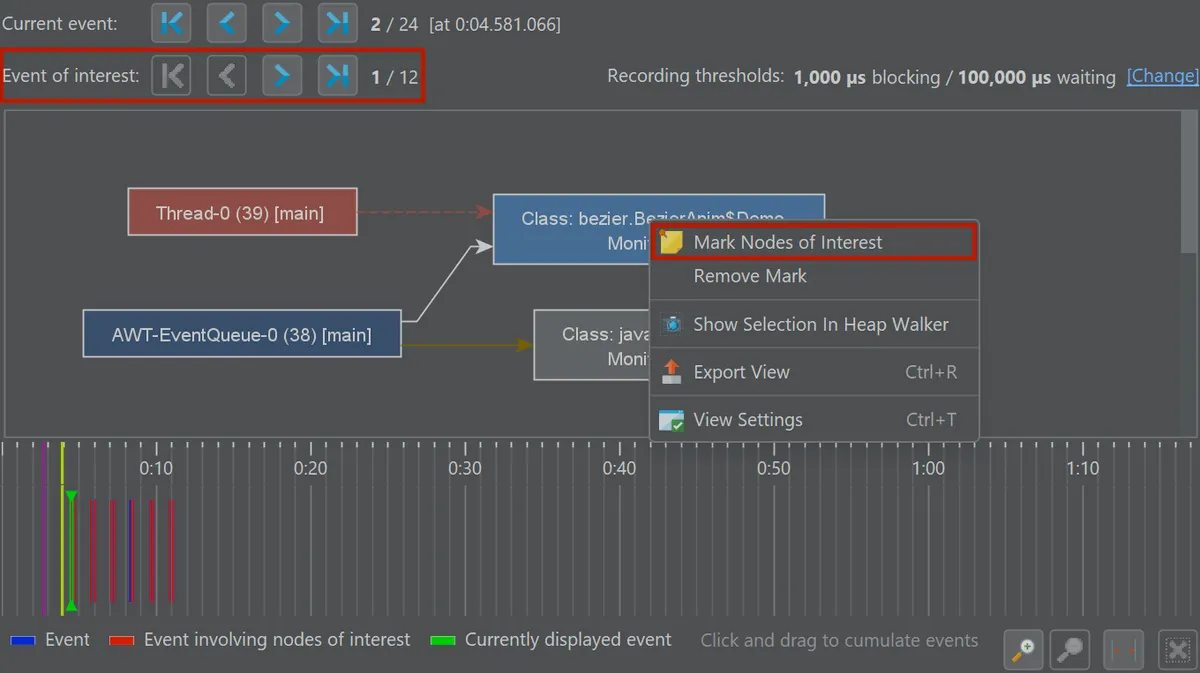
The locking graph is a visual representation of thread interactions via monitors and locks. Nodes represent threads or locks, and edges show the interactions. You can mark specific threads or locks to restrict navigation to relevant events using the event switcher.
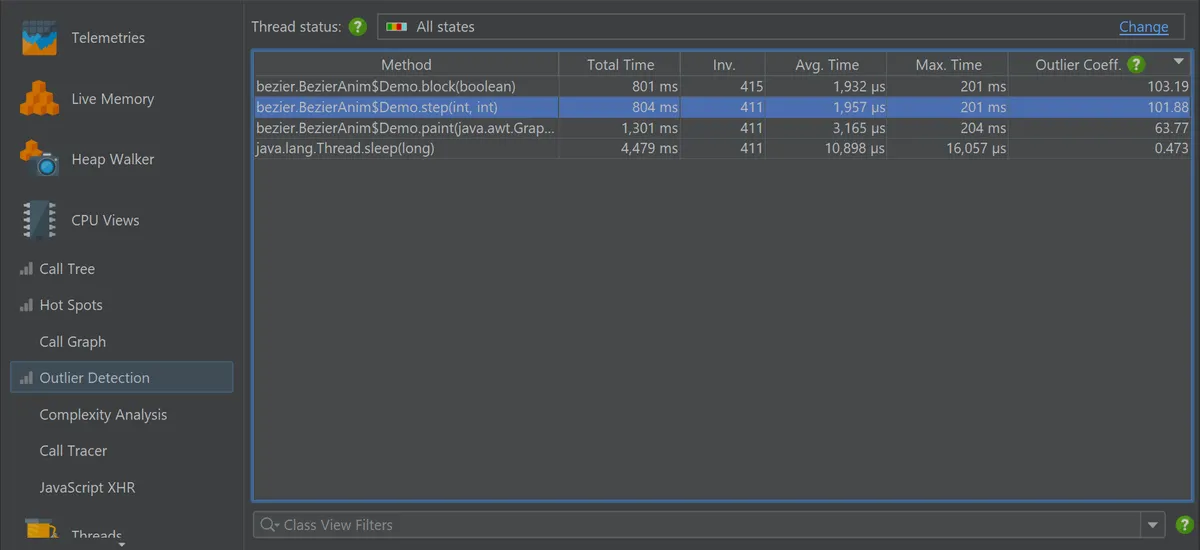
3. Detecting runtime spikes with the outlier view
JProfiler’s outlier detection view highlights methods with rare but significant runtime spikes, cases that can be missed when focusing only on total or average execution time. Instead of just aggregating performance data, it computes an outlier coefficient:
(max time - avg time) / avg time
This lets you find methods that usually behave well but occasionally take much longer. Typical examples include intermittent network latency, caching failures, or blocking I/O in rarely used code paths.
The view filters out low-impact cases by default, showing only methods with more than 10 invocations and a maximum duration above 10 ms. These thresholds are configurable.
Start CPU recording, open the outlier detection view, and sort by the outlier coefficient to pinpoint erratic behavior.