Until now, we have only looked at live sessions where the JProfiler GUI obtains the data from the profiling agent that is running inside the profiled JVM. JProfiler also supports snapshots where all profiling data is written to a file. This can be of advantage in several scenarios:
- You record profiling data automatically, for example, as part of a test so that connecting with a JProfiler GUI is not possible.
- You want to compare profiling data from different profiling sessions or look at older recordings.
- You want to share profiling data with somebody else.
Snapshots include data from all recordings, including heap snapshots. To save disk space, snapshots are compressed, except for heap walker data which has to remain uncompressed to allow for direct memory mapping.
Saving and opening snapshots in the JProfiler GUI
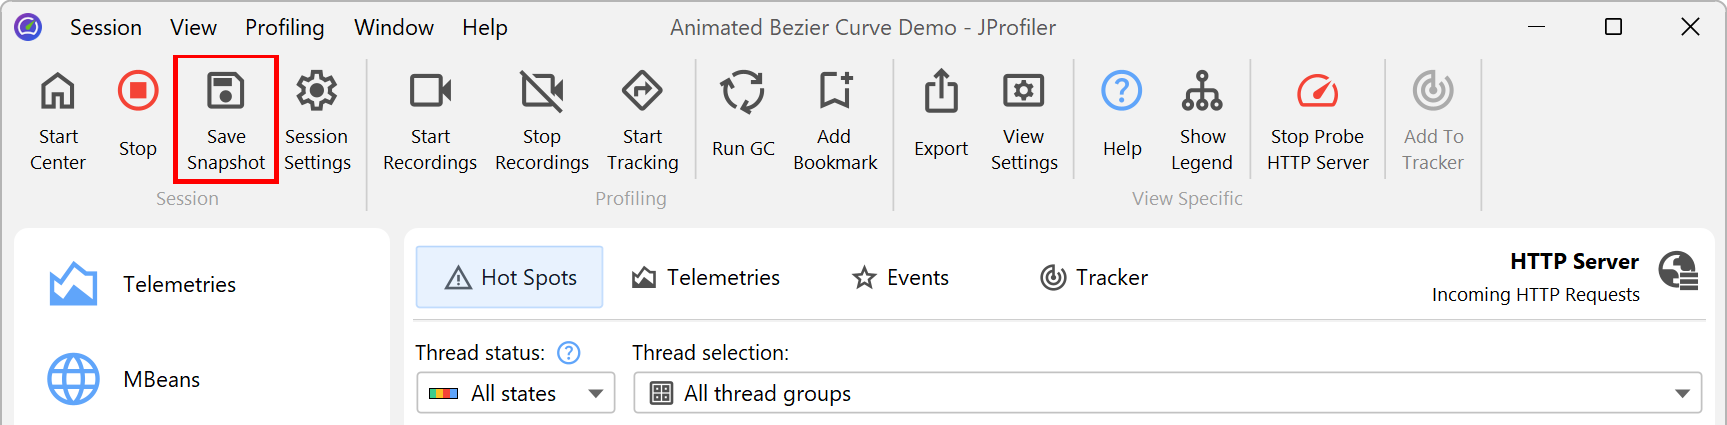
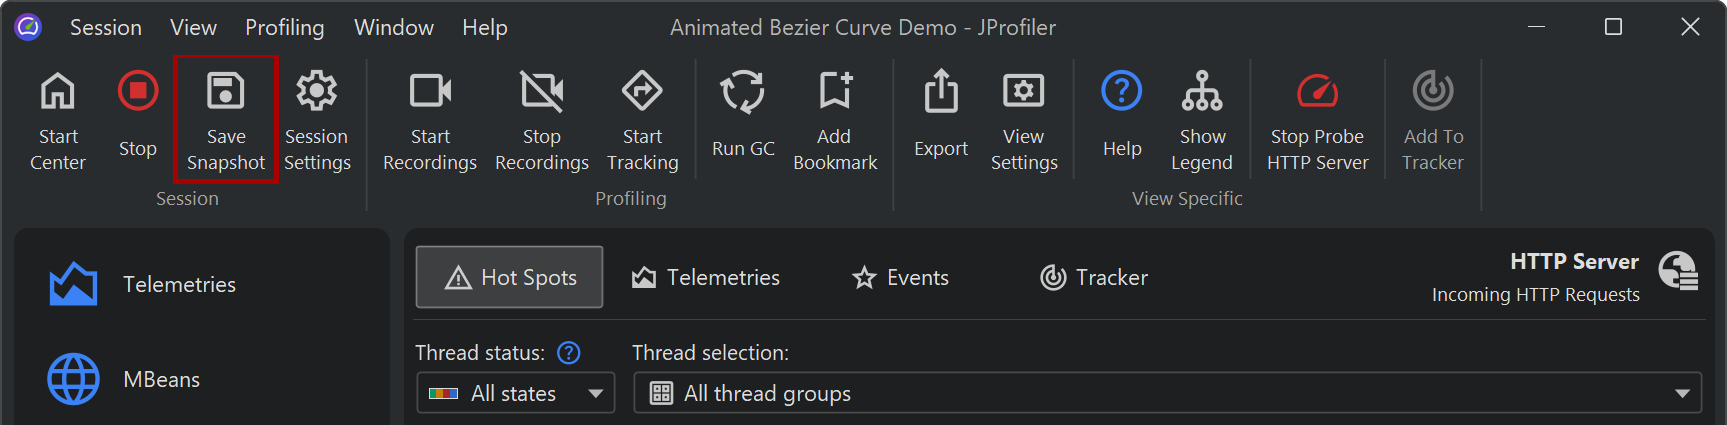
When you are profiling a live session, you can create snapshots with the Save Snapshot toolbar button. JProfiler pulls all profiling data from the remote agent and saves it to a local file with a ".jps" extension. You can save multiple such snapshots during the course of a live session. They are not opened automatically and you can continue to profile.
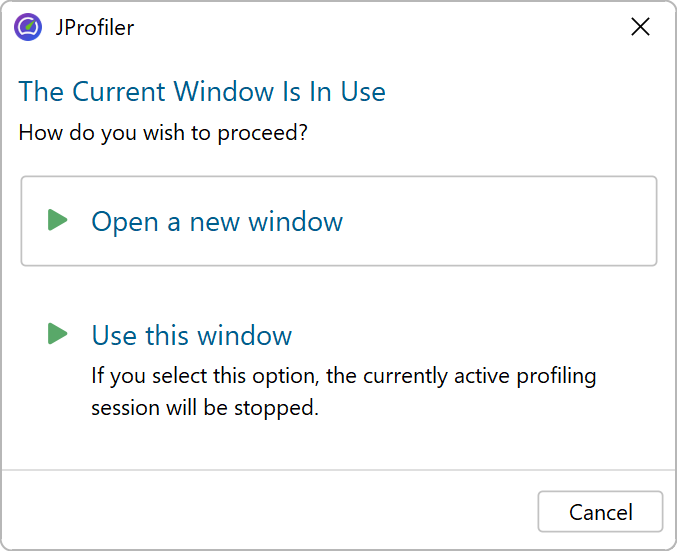
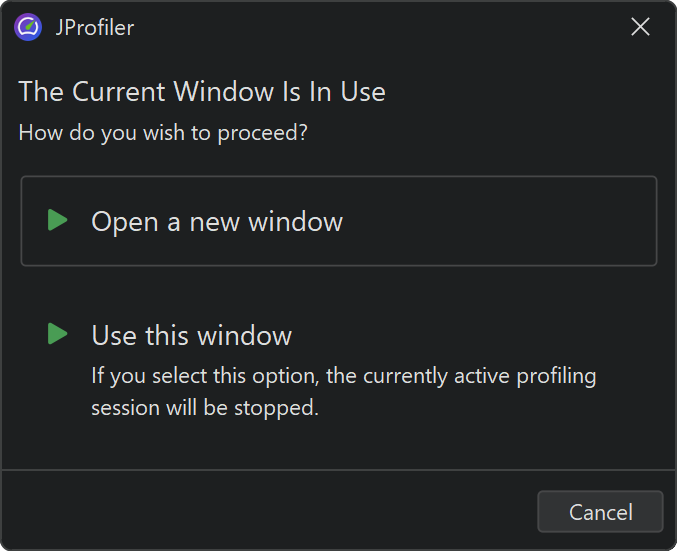
Saved snapshots are added automatically to the File→Recent Snapshots menu, so you can conveniently open a snapshot that you have just saved. When opening a snapshot while the live session is still running, you have a choice of terminating the live session or opening another JProfiler window.
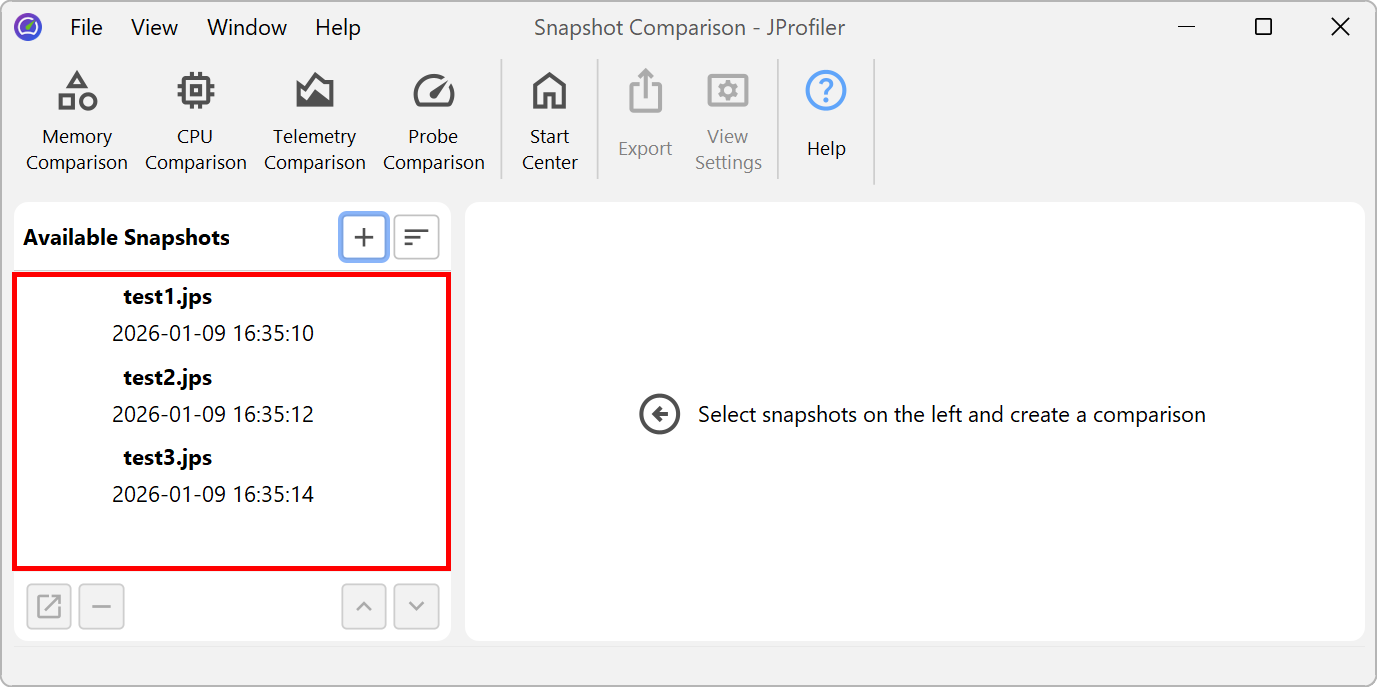
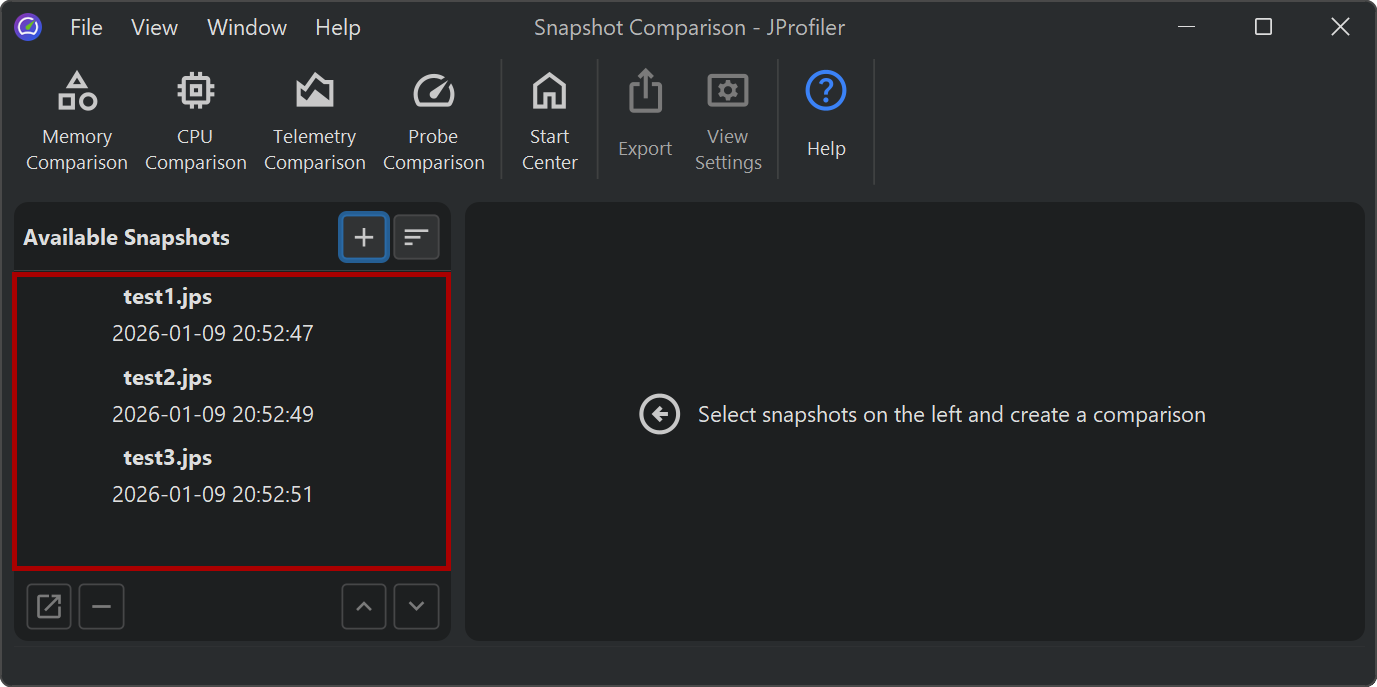
When you use the snapshot comparison feature in JProfiler, the list of snapshots is populated with all the snapshots that you have saved for the current live session. This makes it easy to compare different use cases.
In general, you can open snapshots by invoking Session→Open Snapshot from the main menu or by double-clicking the snapshot file in the file manager. JProfiler's IDE integrations also support opening JProfiler snapshots through the generic Open File actions in the IDEs themselves. In that case, you get source code navigation into the IDE instead of the built-in source code viewer.
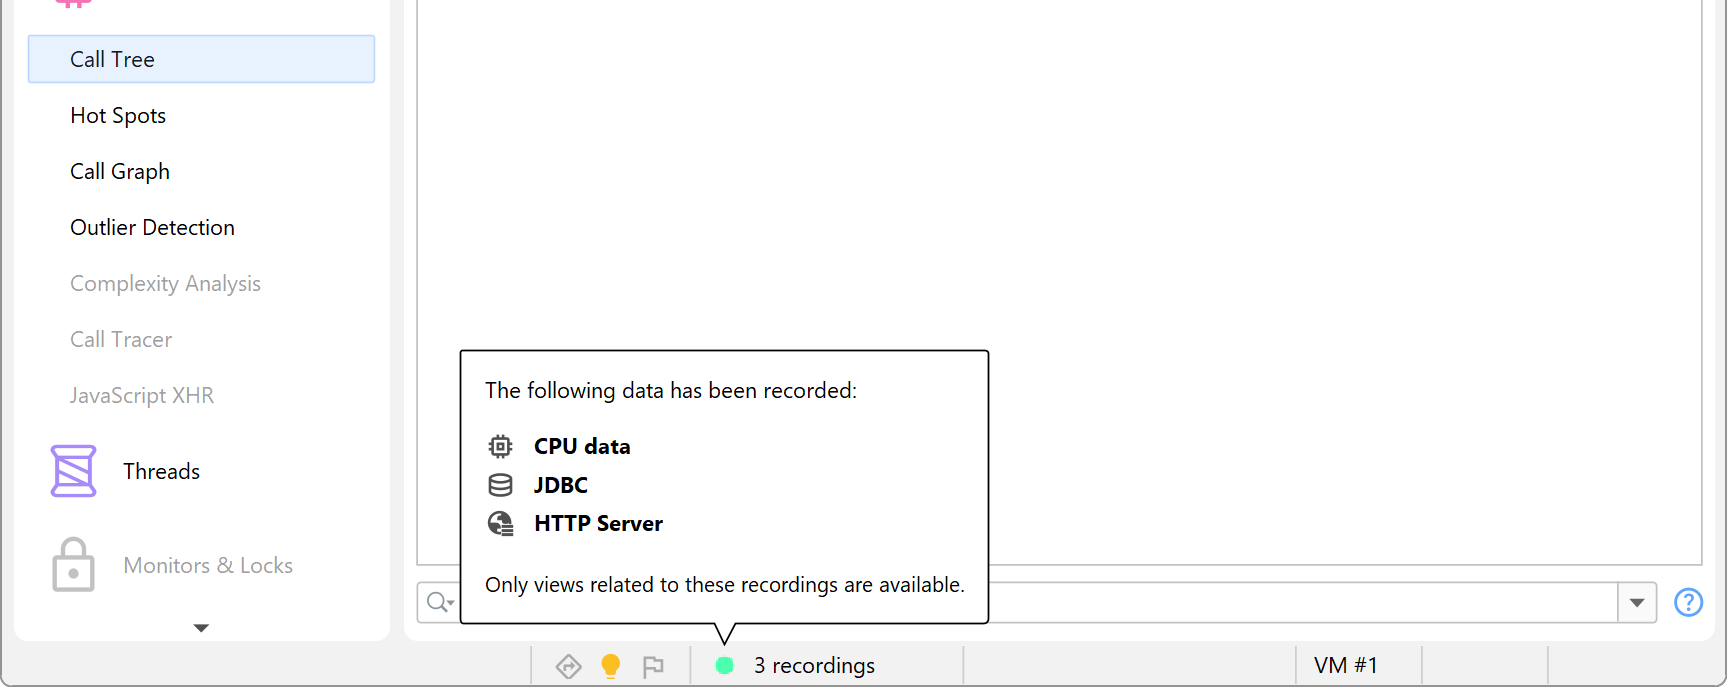
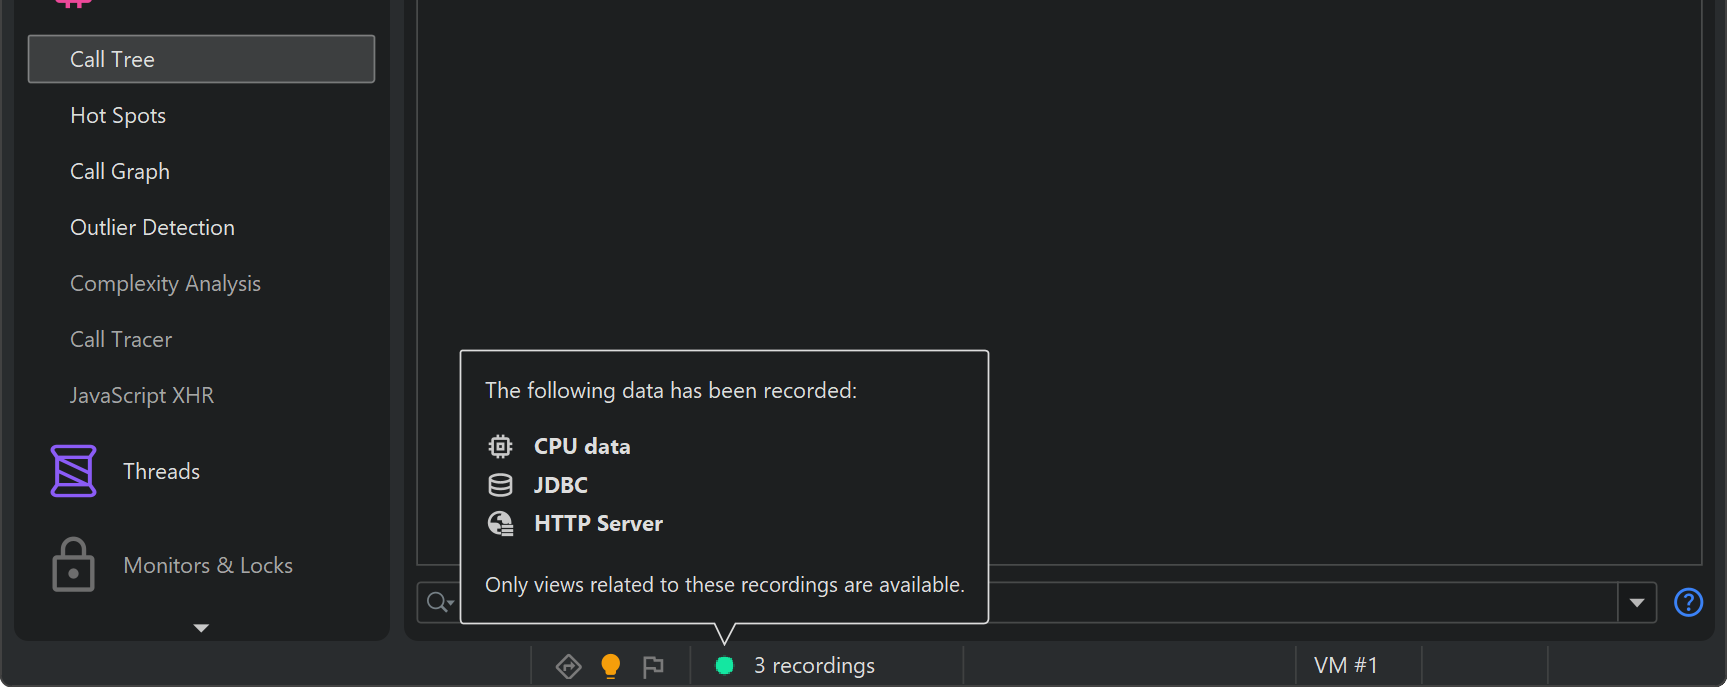
When you open a snapshot, all the recording actions are disabled and only views with recorded data are available. To discover what kind of data has been recorded, hover the mouse over the recording label in the status bar.
Profiling short-lived programs
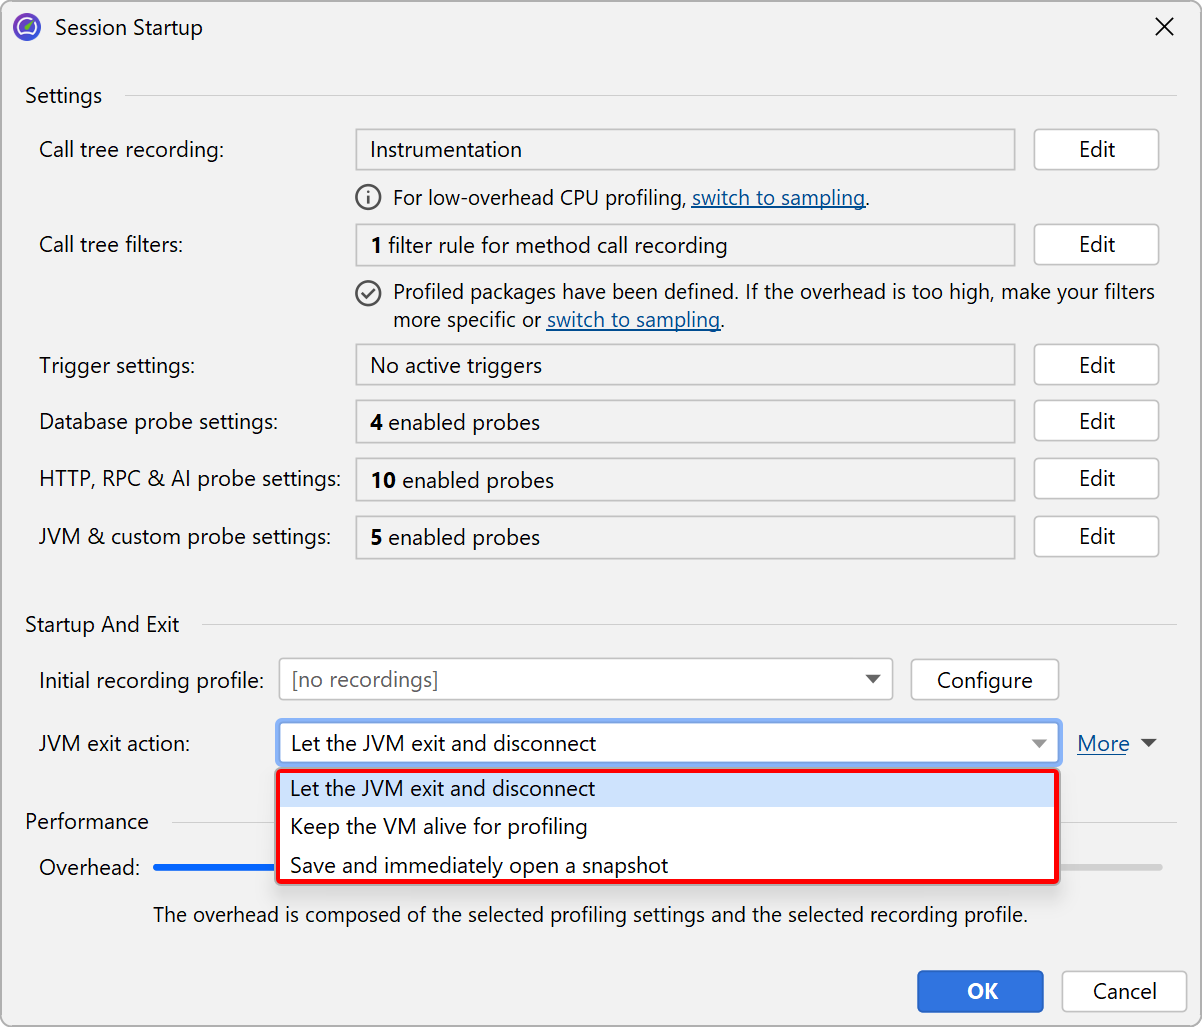
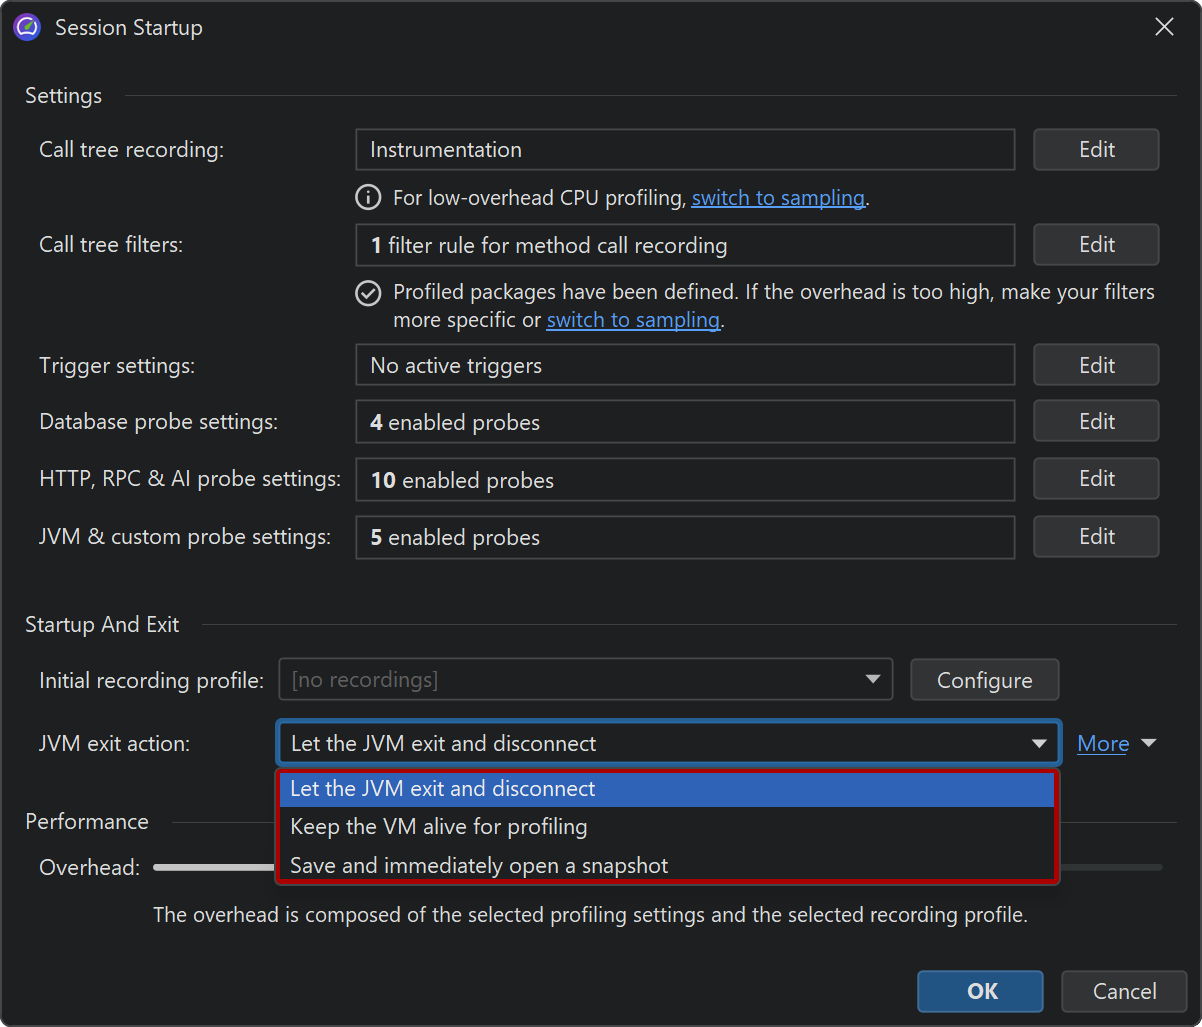
For a live session, all profiling data resides in the process of the profiled JVM. So when the profiled JVM is terminated, the profiling session in JProfiler is closed as well. To continue profiling when a JVM exits, you have two options, both of which can be activated in the session startup dialog.
- You can prevent the JVM from actually exiting and keep it artificially alive as long as the JProfiler GUI is connected. This may be undesirable when you are profiling a test case from the IDE and want to see the status and total time in the test console of the IDE.
- You can ask JProfiler to save a snapshot when the JVM terminates and switch to it immediately. The snapshot is temporary and will be discarded when you close the session unless you use the Save Snapshot action first.
Saving snapshots with triggers
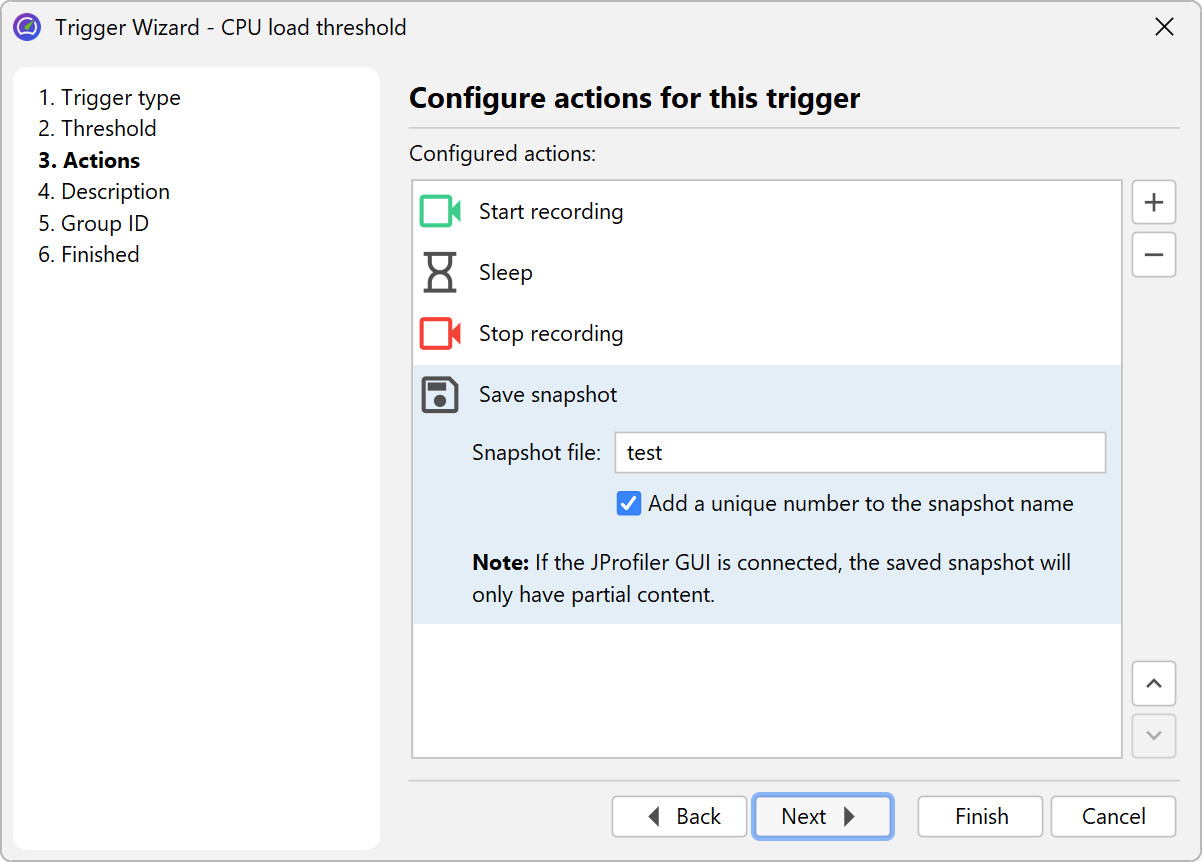
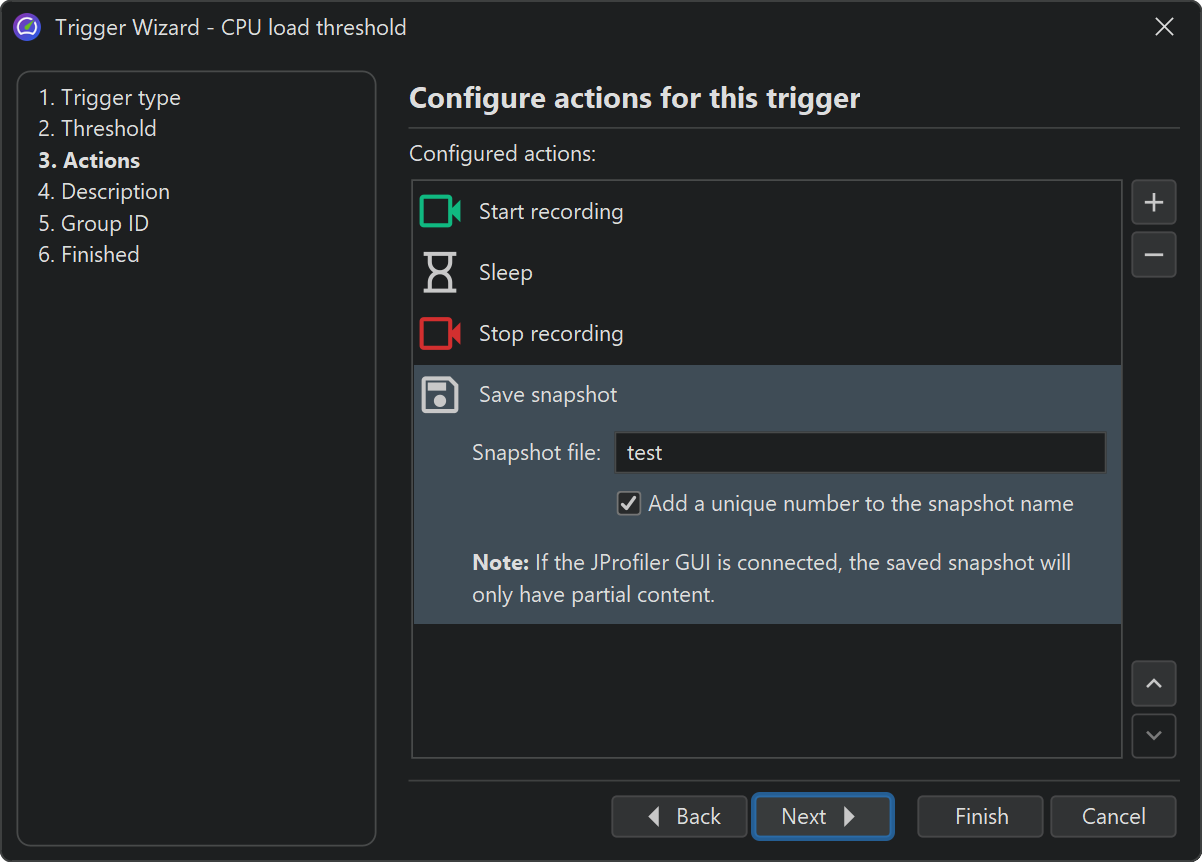
The final result of an automated profiling session is always a snapshot or a series of snapshots. In triggers, you can add a "Save a snapshot" action that saves the snapshot on the machine where the profiled JVM is running. When the trigger runs during a live session, the snapshot is also saved on the remote machine and may not include parts of the data that have already been transmitted to the JProfiler GUI.
There are two basic strategies for saving snapshots with triggers:
- For test cases, start recording in the "JVM startup" trigger and add a "JVM exit" trigger to save the snapshot when the JVM is terminated.
- For exceptional conditions like the "CPU load threshold" trigger or for periodic profiling with a "Timer trigger", save the snapshot after recording some data with a "Sleep" action in between.
HPROF heap snapshots
In situations where taking a heap snapshot produces too much overhead or consumes too much memory, you can use the HPROF heap snapshots that the JVM offers as a built-in feature. Because the profiling agent is not required for this operation, this is interesting for analyzing memory problems in JVMs that are running in production.
With JProfiler, there are three ways to obtain such snapshots:
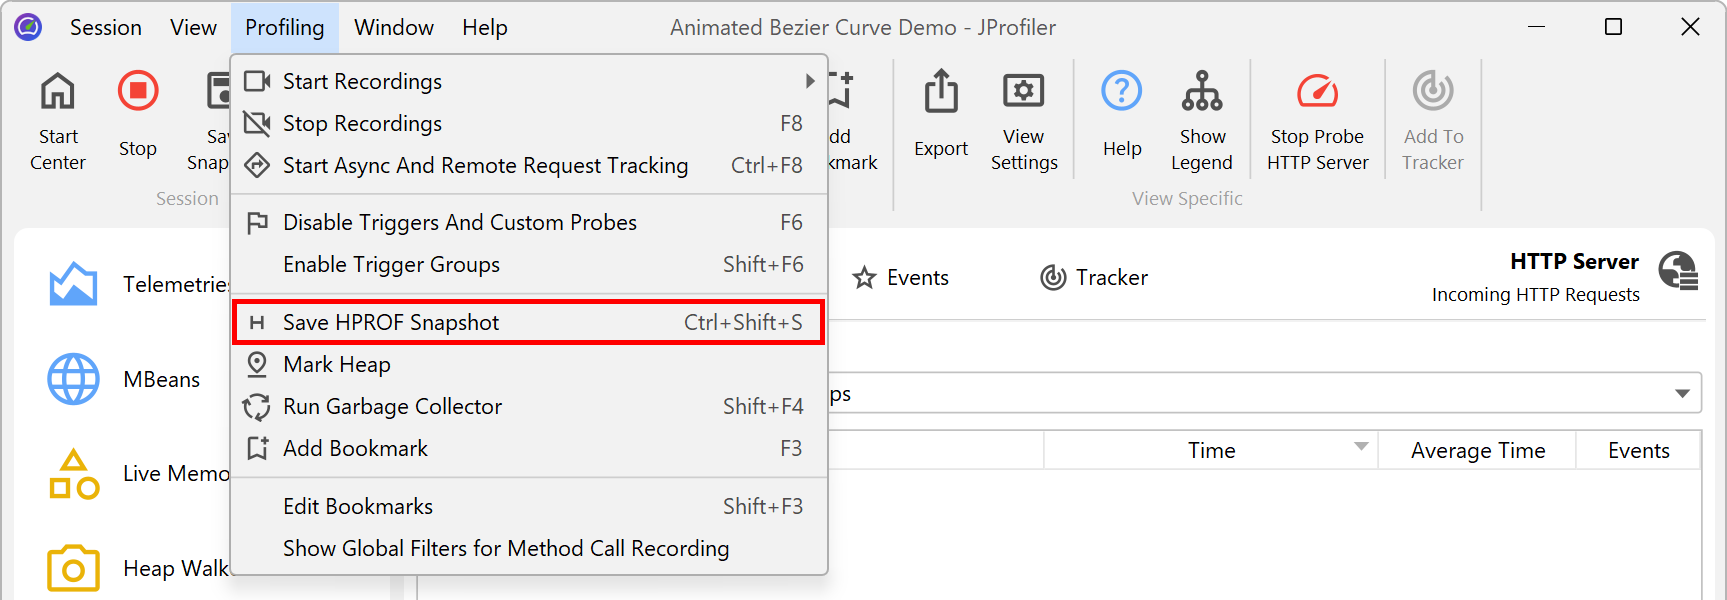
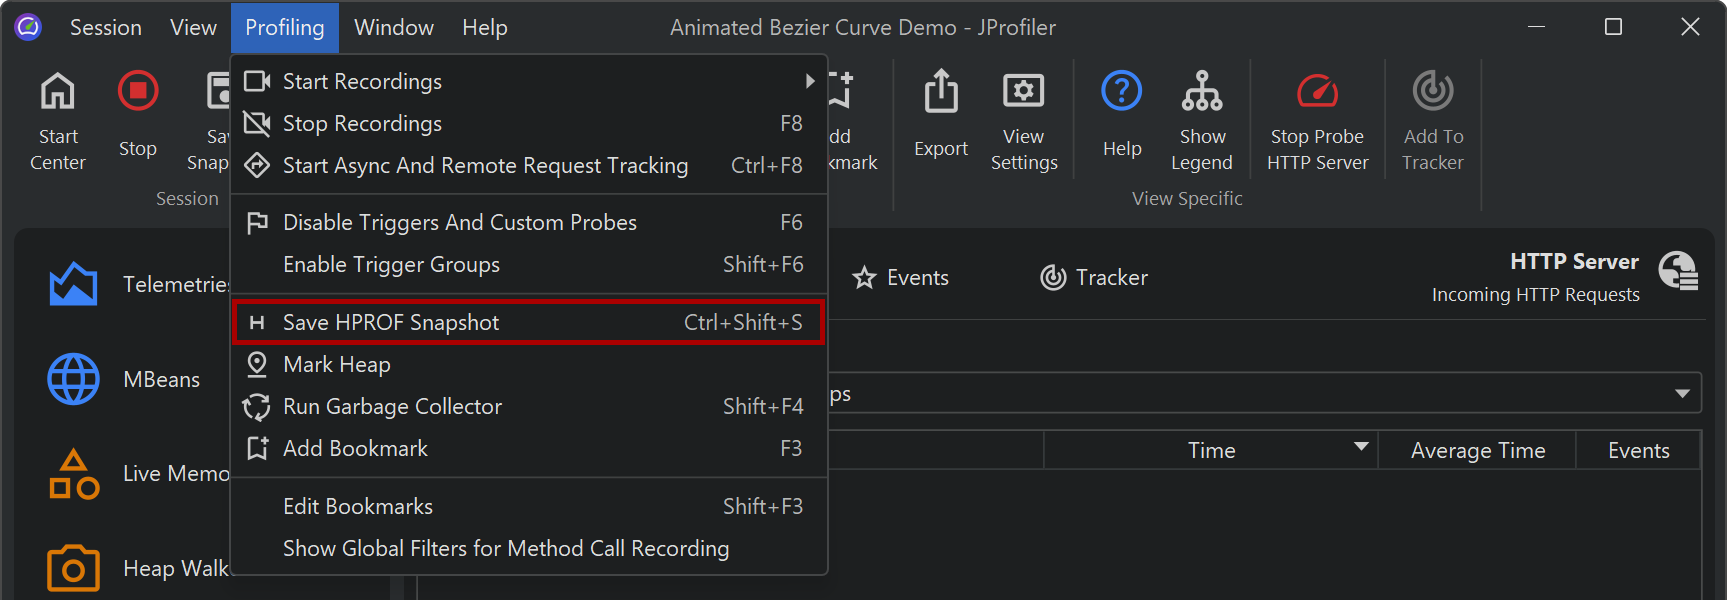
- For live sessions, the JProfiler GUI offers an action in the main menu to trigger an HPROF heap dump.
-
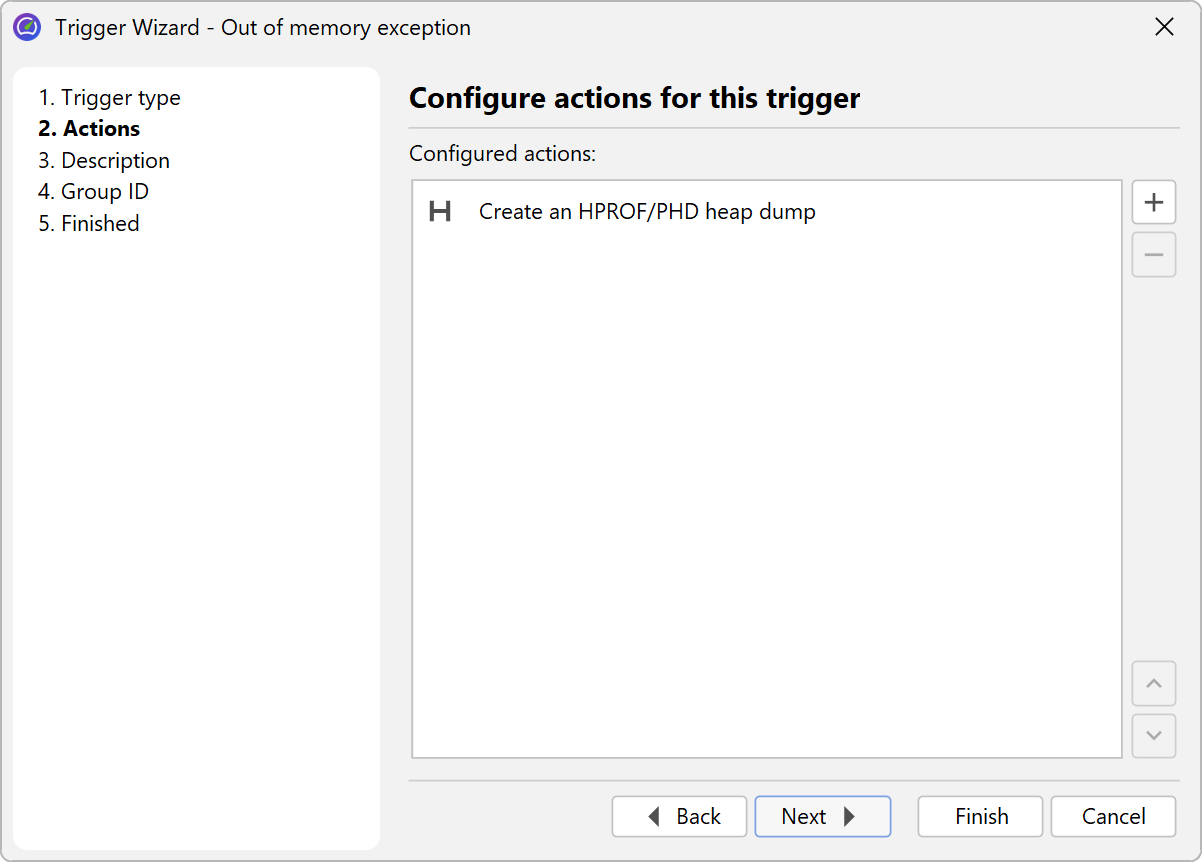
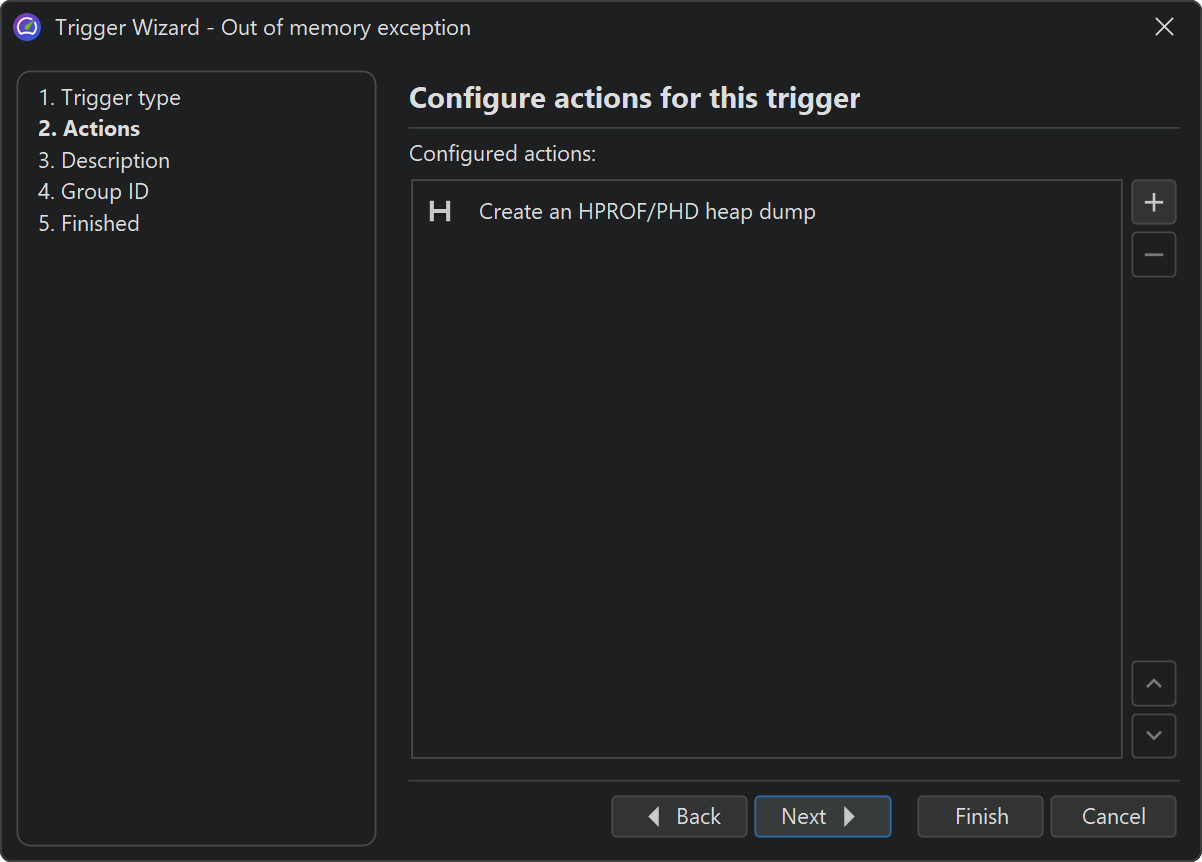
JProfiler has a special "Out of memory exception" trigger to save an HPROF snapshot when an
OutOfMemoryErroris thrown. This corresponds to the VM parameter-XX:+HeapDumpOnOutOfMemoryError
that is supported by HotSpot JVMs. -
The jmap executable in the JDK can be used to extract an HPROF heap dump from a running JVM.
JProfiler includes the command line tool
jpdumpthat is more versatile than jmap. It lets you select a process, can connect to processes running as a service on Windows, has no problems with mixed 32-bit/64-bit JVMs and auto-numbers HPROF snapshot files. Execute it with the-helpoption for more information.
JDK Flight Recorder snapshots
JProfiler fully supports opening snapshots saved by Java Flight Recorder (JFR). The UI is notably different in this case and is adjusted to the capabilities of JFR. See the JFR help topics for more details.
Snapshot analysis with AI agents
JProfiler's MCP server can load JProfiler snapshots (.jps), HPROF files (.hprof), PHD files (.phd) and JFR recordings (.jfr) for analysis by an AI agent. This is useful for complex profiling scenarios where you record a snapshot with the JProfiler GUI and then let the AI agent analyze the data. Two snapshots of the same type can be loaded together for baseline comparison.