Due to the benefits of running JFR in production JVMs with a minimal overhead and no requirement to enable
the profiling interface, JProfiler supports JFR recording directly in the UI.
While you can start JFR programmatically or by adding the -XX:StartFlightRecording VM parameter
on the command line, JProfiler helps you to start and stop recordings for JVMs that are already running.
When you attach to a JVM with JProfiler, you can choose to start and stop JFR recordings instead of loading the native profiling agent. With JProfiler's extensive remote connection capabilities, you can, for example, start JFR recordings in JVMs that run in Docker or Kubernetes containers without the need to modify a container.
Starting and stopping JFR recordings
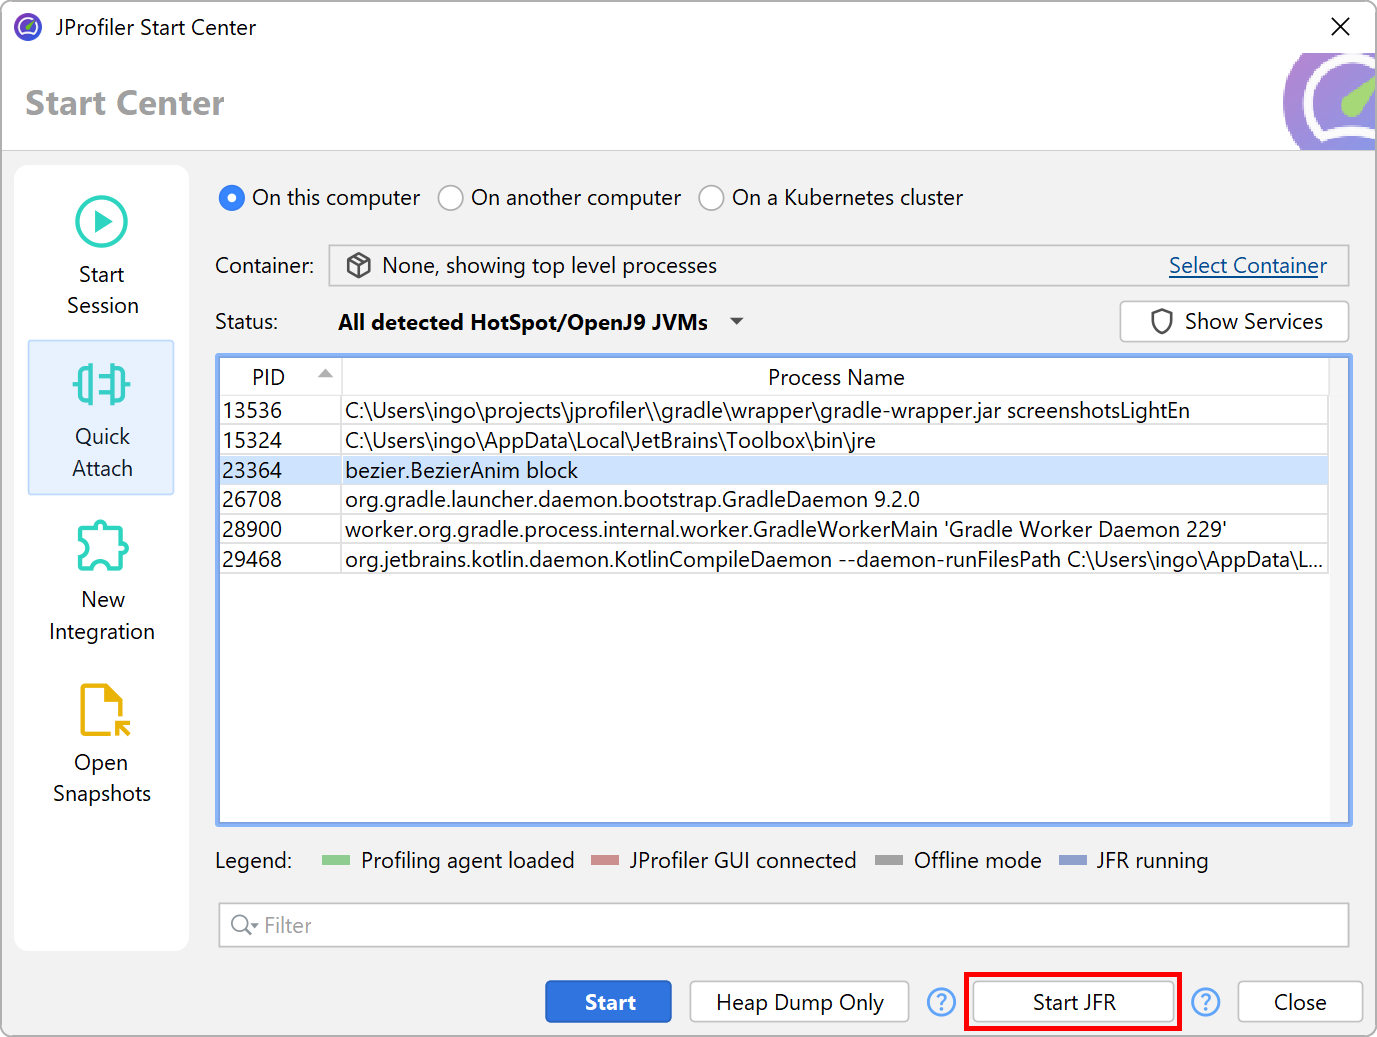
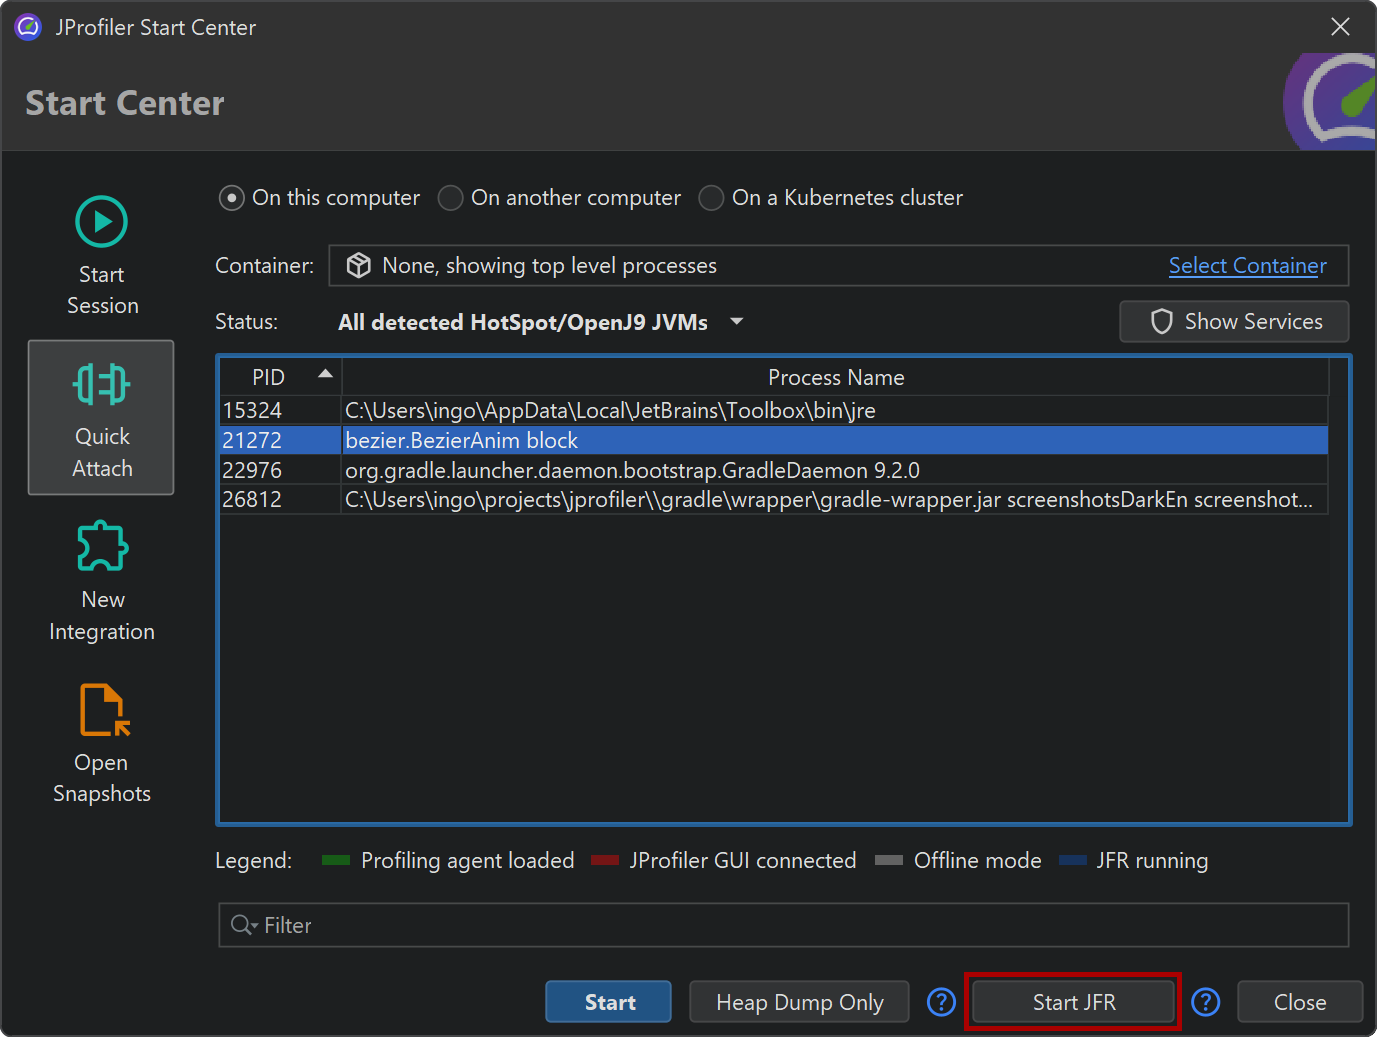
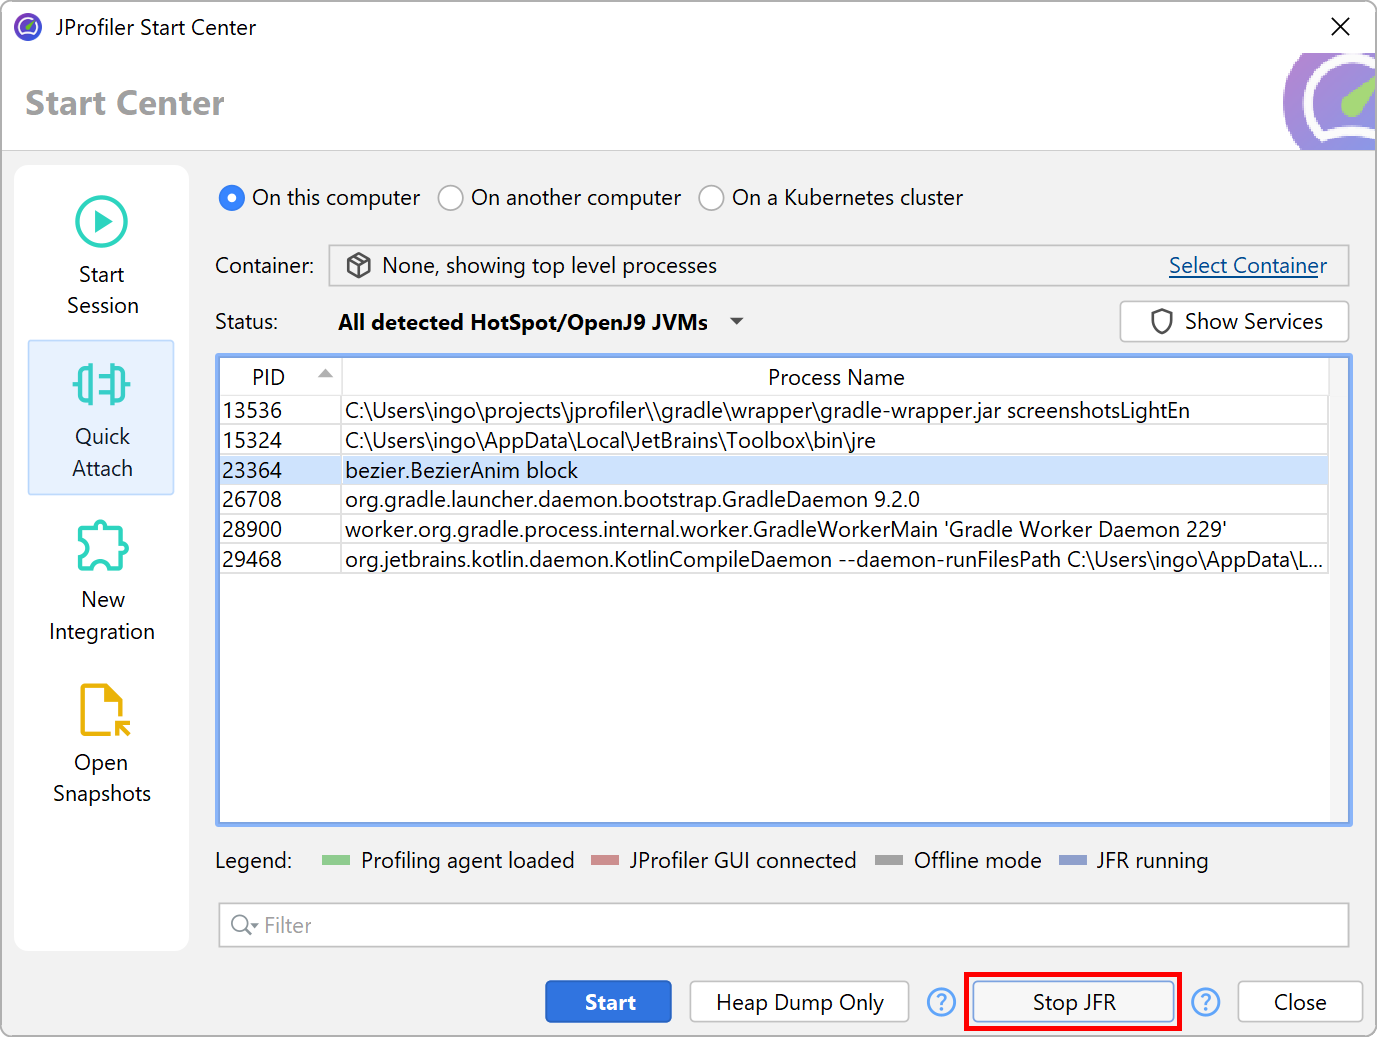
On the "Quick attach" tab of the start center, select a JVM and click on the Start JFR button at the bottom of the dialog. Locally running JVMs are shown in the screenshot, but the same button is also available when you attach to a remote JVM.
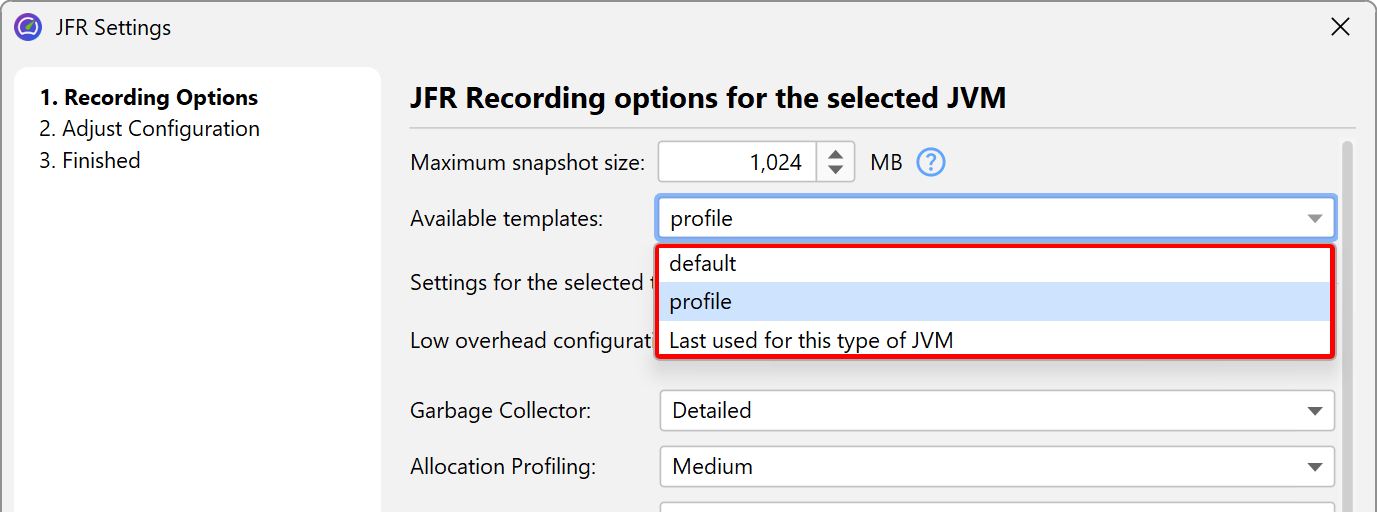
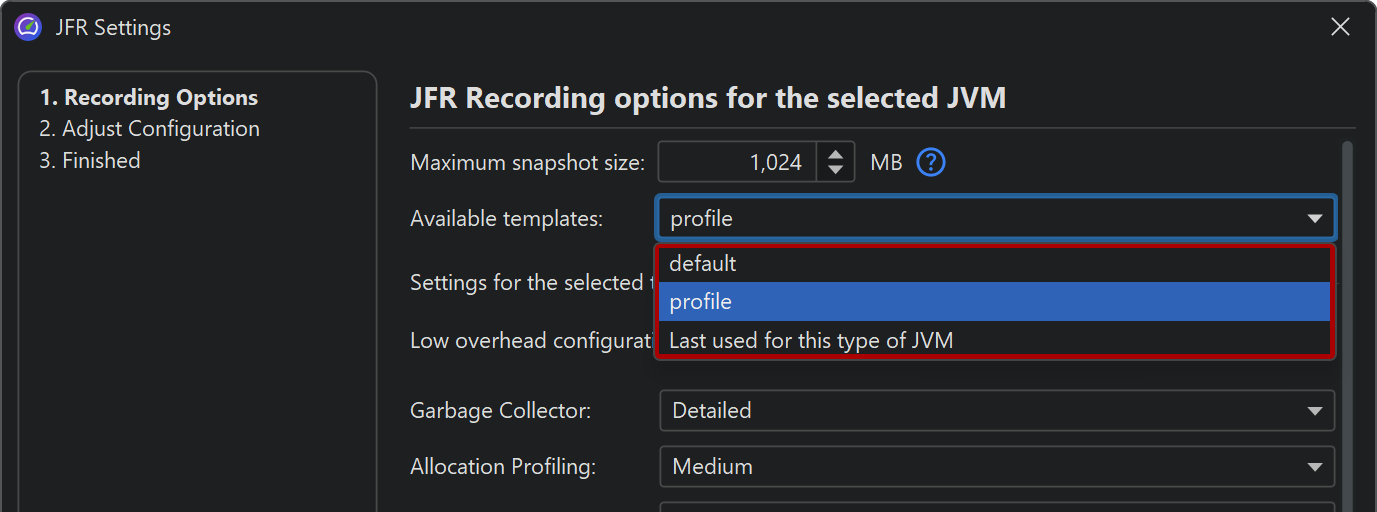
In the JFR settings wizard, you can then select one of the event settings templates that are transmitted
from thelib/jfr directory of the JRE that is used by the selected process. By default, there are
two such templates, "default" and "profile", where "profile" records more data and adds more overhead.
If you create other files in that directory, you will be able to select the corresponding templates in the wizard.
These template files contain the available events as well as configuration directives for important high-level settings. Each of the high-level settings can be coupled to a number of different events. This UI is dynamically generated based on the contents of the template file. Switching between the different profiles will show you the different default values. There are many more event types that are not included in this UI and which are only configurable in the next step.
If you have already started a JFR recording for a JVM with the same set of event types, JProfiler will offer you the option to use the last settings.
If you select that option, the high-level recording settings will not be available and you can proceed to the next step to see the entire configuration and make further changes.
Another important setting on this step of the wizard is the maximum snapshot size. Due to the nature of JFR recordings, the size of a snapshot can increase very quickly and might fill up your entire hard disk. To avoid that, the maximum snapshot size constraint prevents excessive storage utilization. When the maximum size is reached, older events will be discarded while new events will continue to be recorded. This process is an automatic mechanism of JFR.
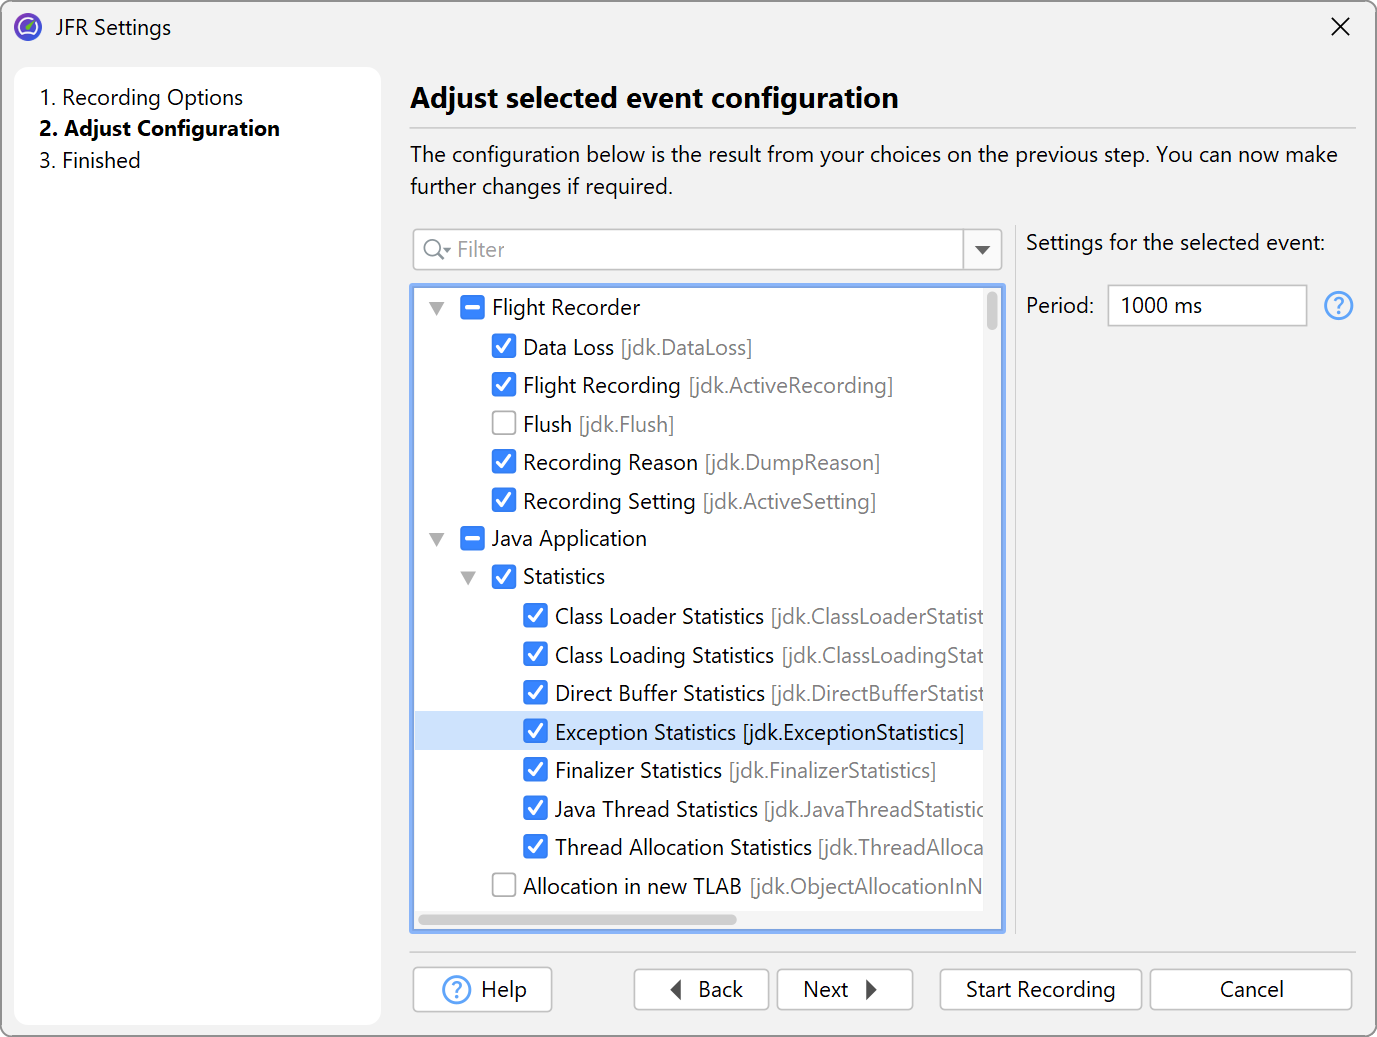
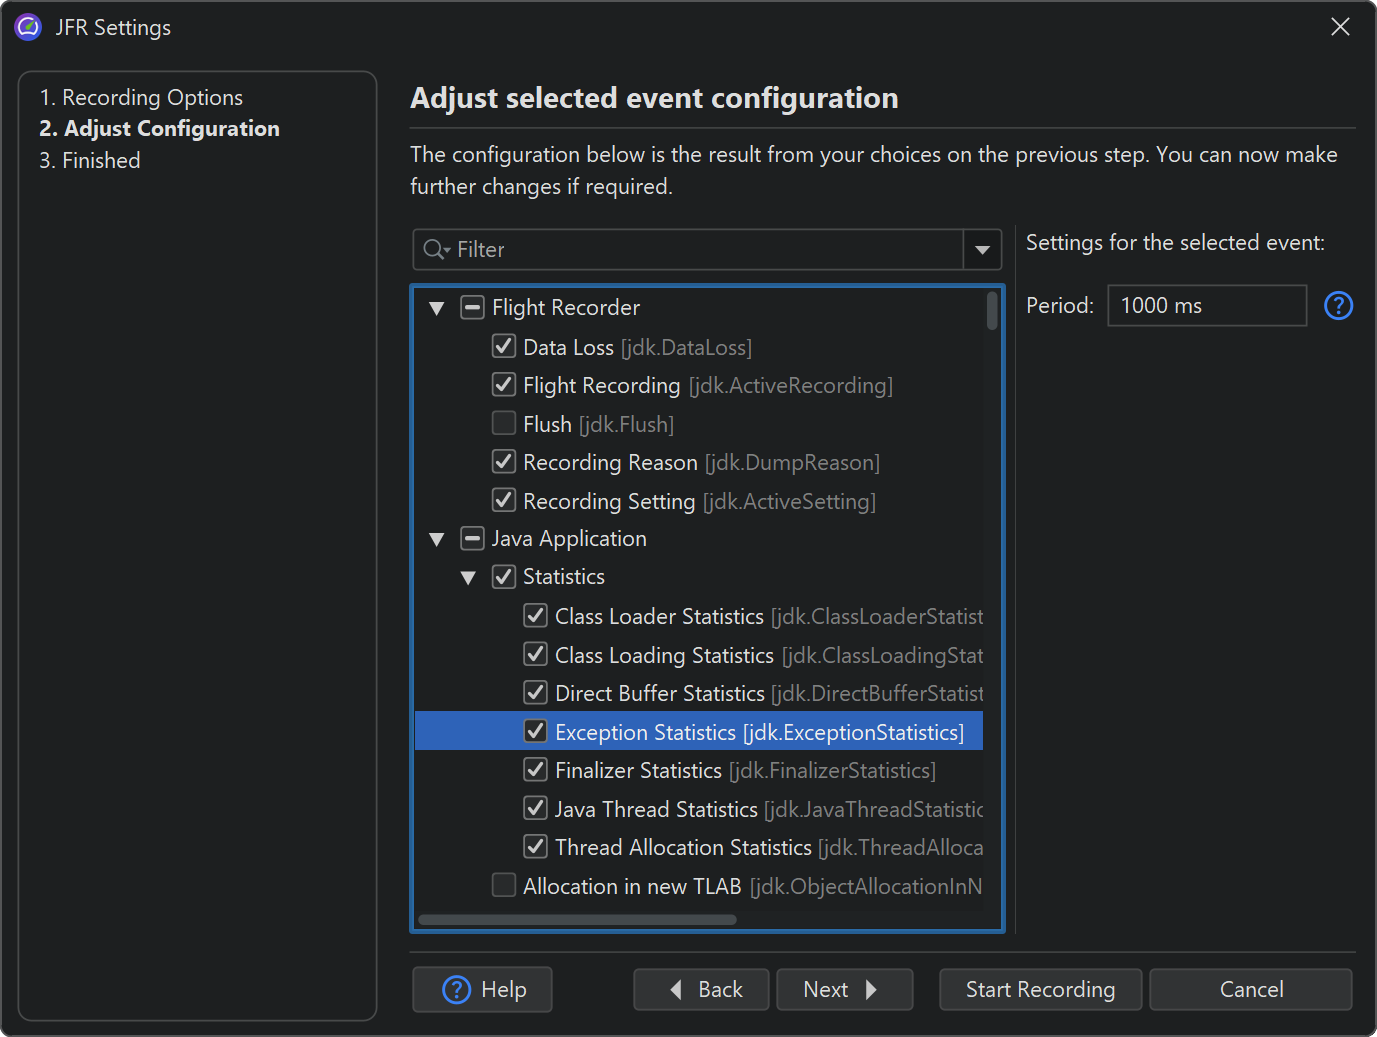
In the next step of the wizard you can see a categorized tree of all event types with further configuration for each event on the right side.
Events may have a setting for a period, a threshold and a flag whether to record a
stack trace for each event or not. Both periods and thresholds are settings with time units and you can
press the down key to get an auto-completion popup for the available units. Periods also support the special
values "everyChunk", "beginChunk" and "endChunk" that are also available from the auto-completion popup.
A "chunk" refers to a part of a JFR recording which holds a contiguous set of event data and metadata
and functions as the basic unit of storage and data transport in a recording.
The more events are selected in the tree, the more data is being recorded. Some event types generate huge amounts of data while some generate only few events.
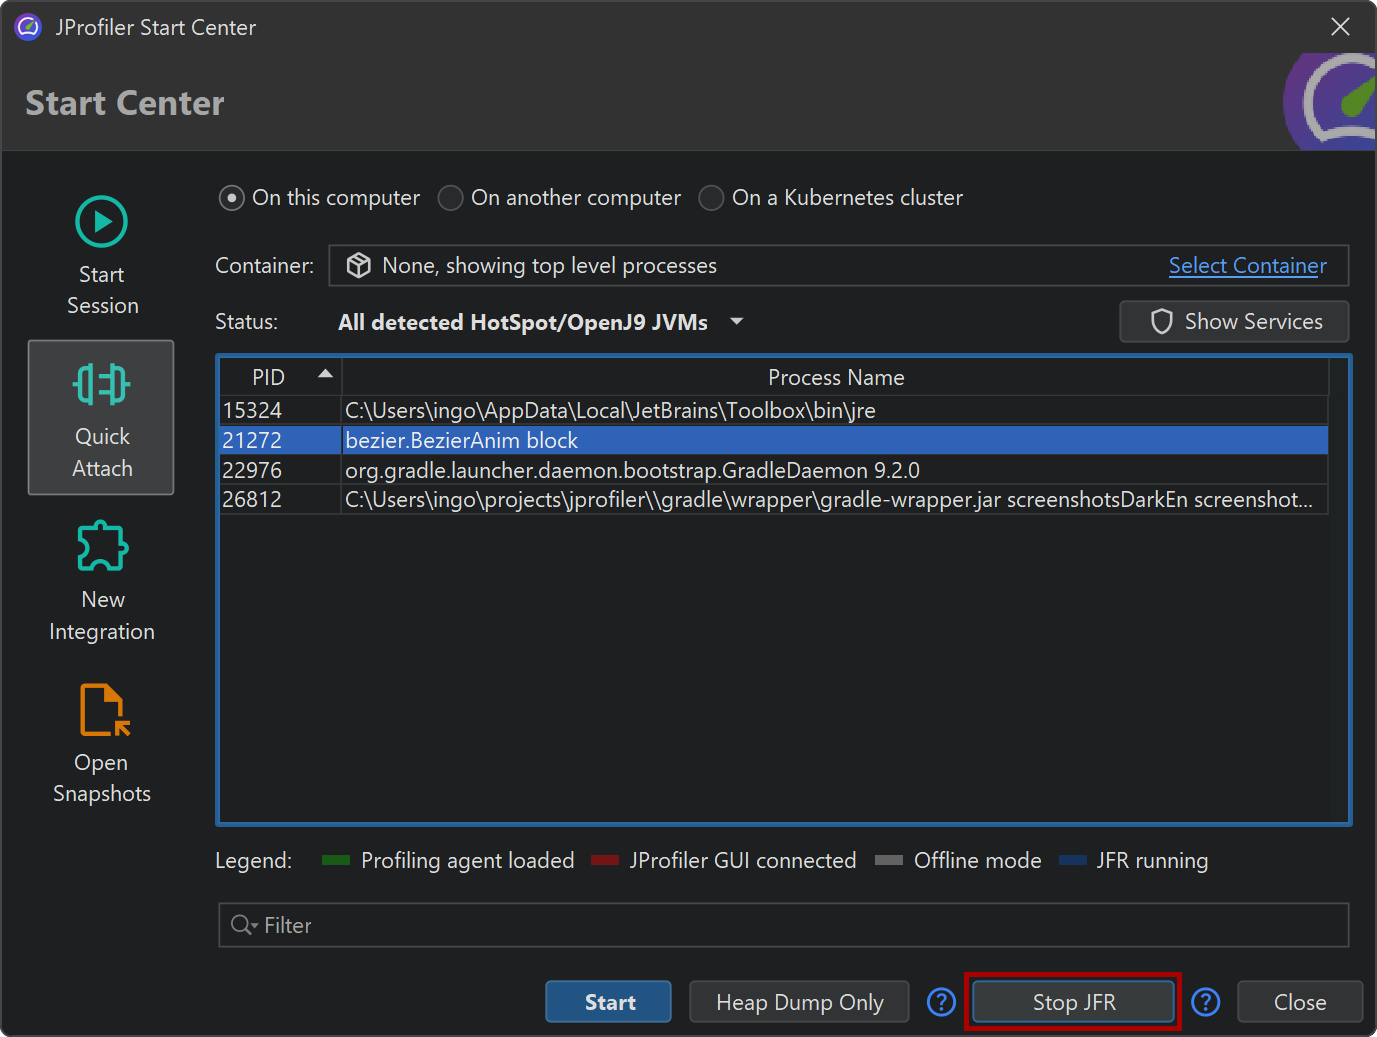
Unlike the full profiling mode or the "Heap dump only" mode where you immediately see some data in the UI, starting a JFR snapshot only modifies the background color of the JVM in the table when it is not selected so you can see that JProfiler has started a recording. When the JVM is selected, the text of the JFR button at the bottom now shows you that recording will be stopped.
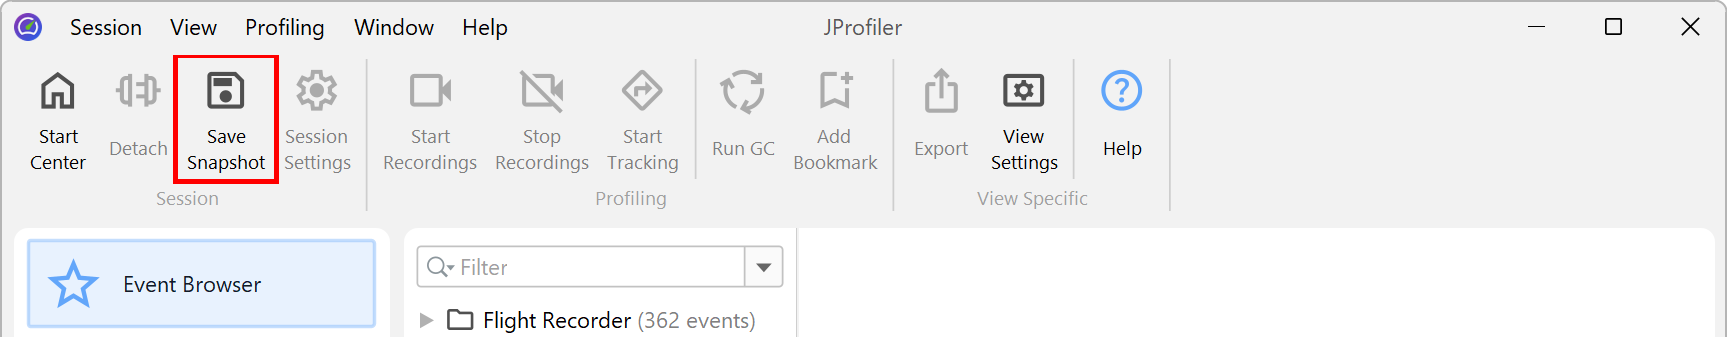
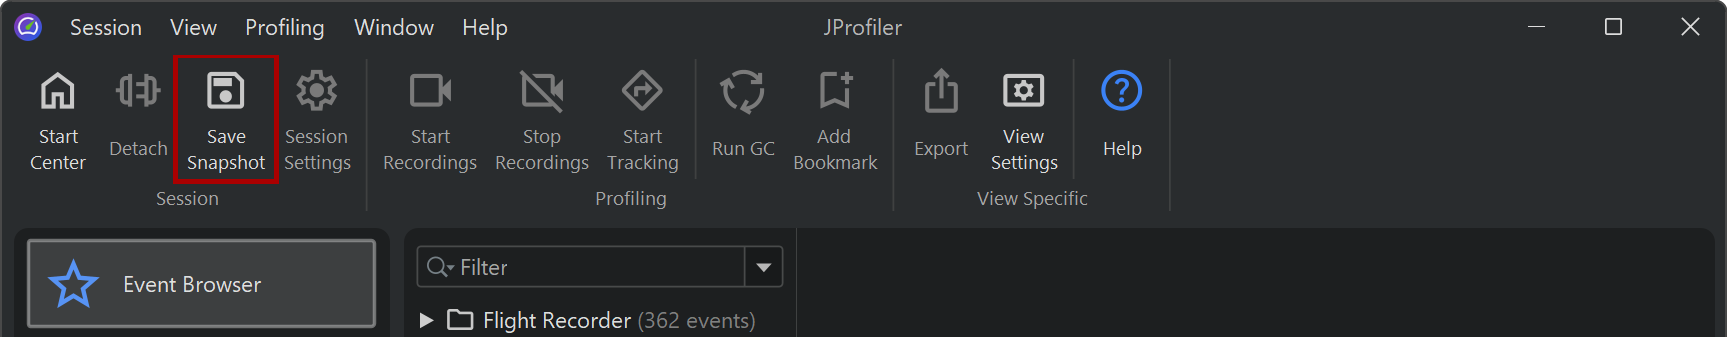
When you stop a JFR recording that was started by JProfiler, a JFR snapshot will be transferred and opened in JProfiler. The snapshot is temporary and will be deleted when you close the window. To save the snapshot to a permanent location, use the "Save snapshot" action in the toolbar.
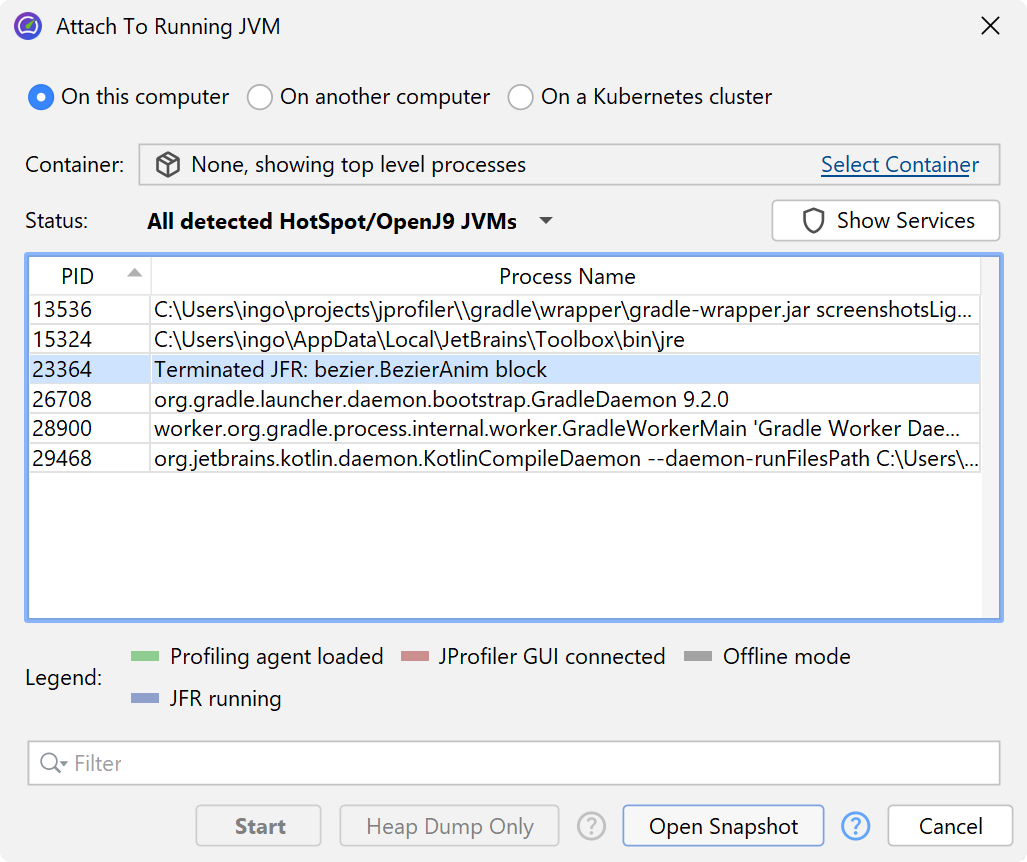
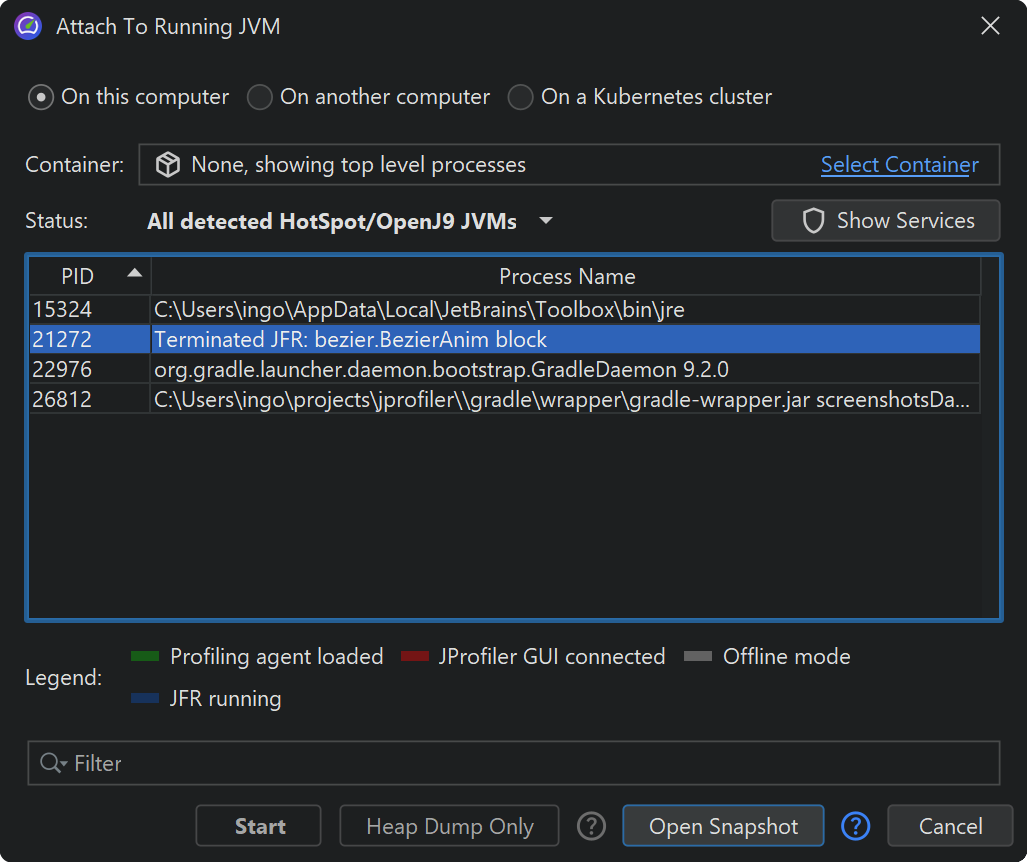
Terminated JVMs with JFR recordings
One mentioned use of JFR is to investigate the moments before a crash. In that case, the JVM will not be available in the JVM table anymore to stop JFR recording and open the JFR snapshot. If a JFR recording has been started in JProfiler and the JVM terminates before you stop the recording, a special entry prefixed with "Terminated JFR:" will be added to the JVM table. By double-clicking on that entry or using the "JFR" button, you can open the JFR snapshot.
Once you open such an entry, it will be removed from the list. Just like for recordings that are stopped manually, the opened JFR snapshot will be temporary and you have to save it if you want to keep it for later analysis.
Showing externally started JFR recordings
In the example above, the JFR recording has been started and stopped in JProfiler. JFR recordings that are started outside JProfiler can also be shown. Continuous JFR recordings can easily be started with a VM parameter like
"-XX:StartFlightRecording=maxsize=500m=filename=$TEMP/myapp.jfr,name=Continuous recording"
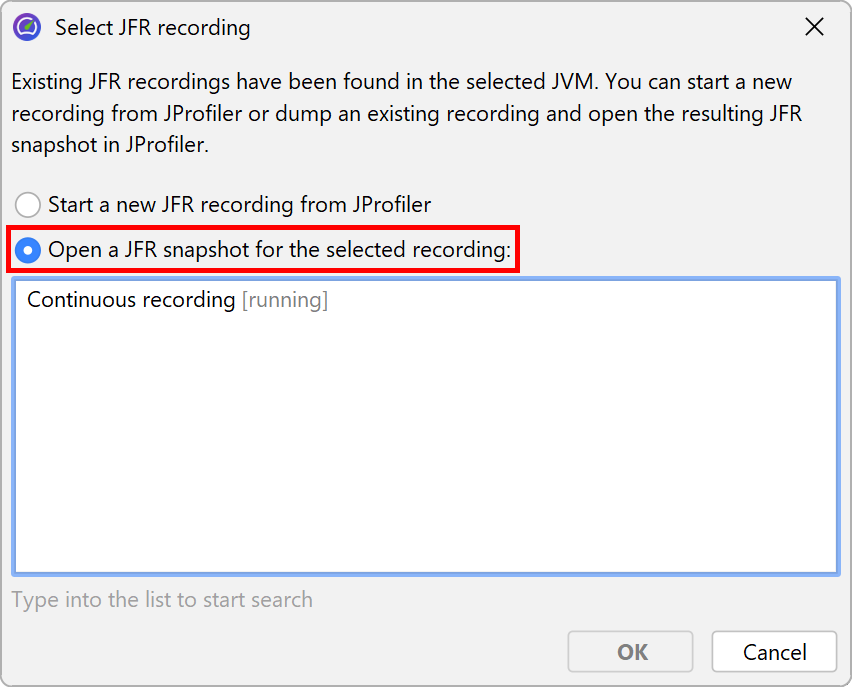
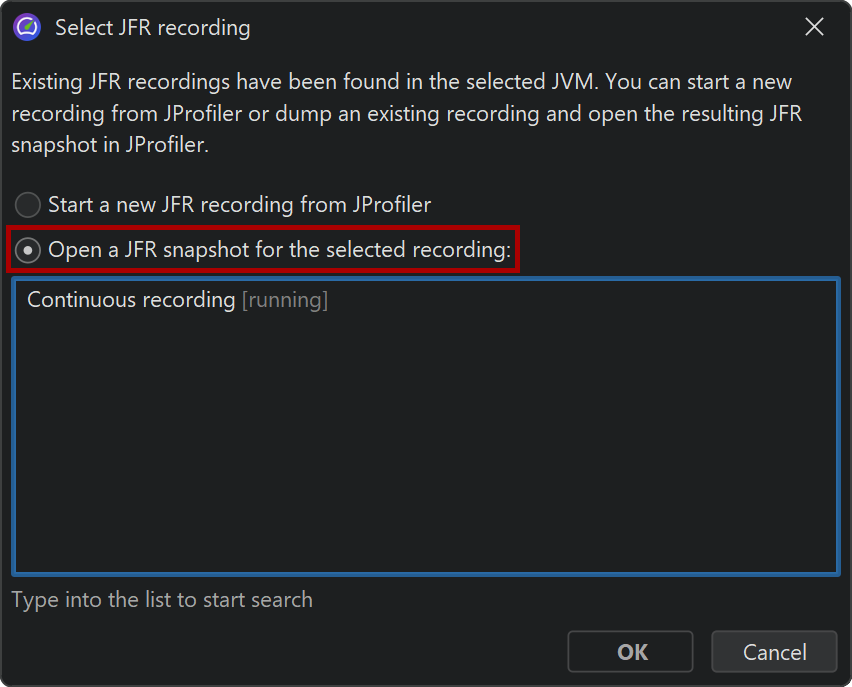
The indication via the special background color in the JVM table that a JFR recording is running only refers to JFR recordings that were started in JProfiler. If you connect to a JVM where a JFR recording has been started by other means, another dialog will be shown.
You can now choose to start a new recording in JProfiler or to dump an existing recording and show the resulting JFR snapshot in JProfiler. Externally started JFR recordings have a separate life cycle and will not be stopped by JProfiler.