Apart from the JFR event browser, JProfiler uses some of the views that are available for full profiling sessions and fills them with JFR data. This is possible because JFR collects data for memory allocations and method executions. The main limitation is that the recording rates are low, so getting enough data to see problematic hot spots can take a long time.
Telemetries
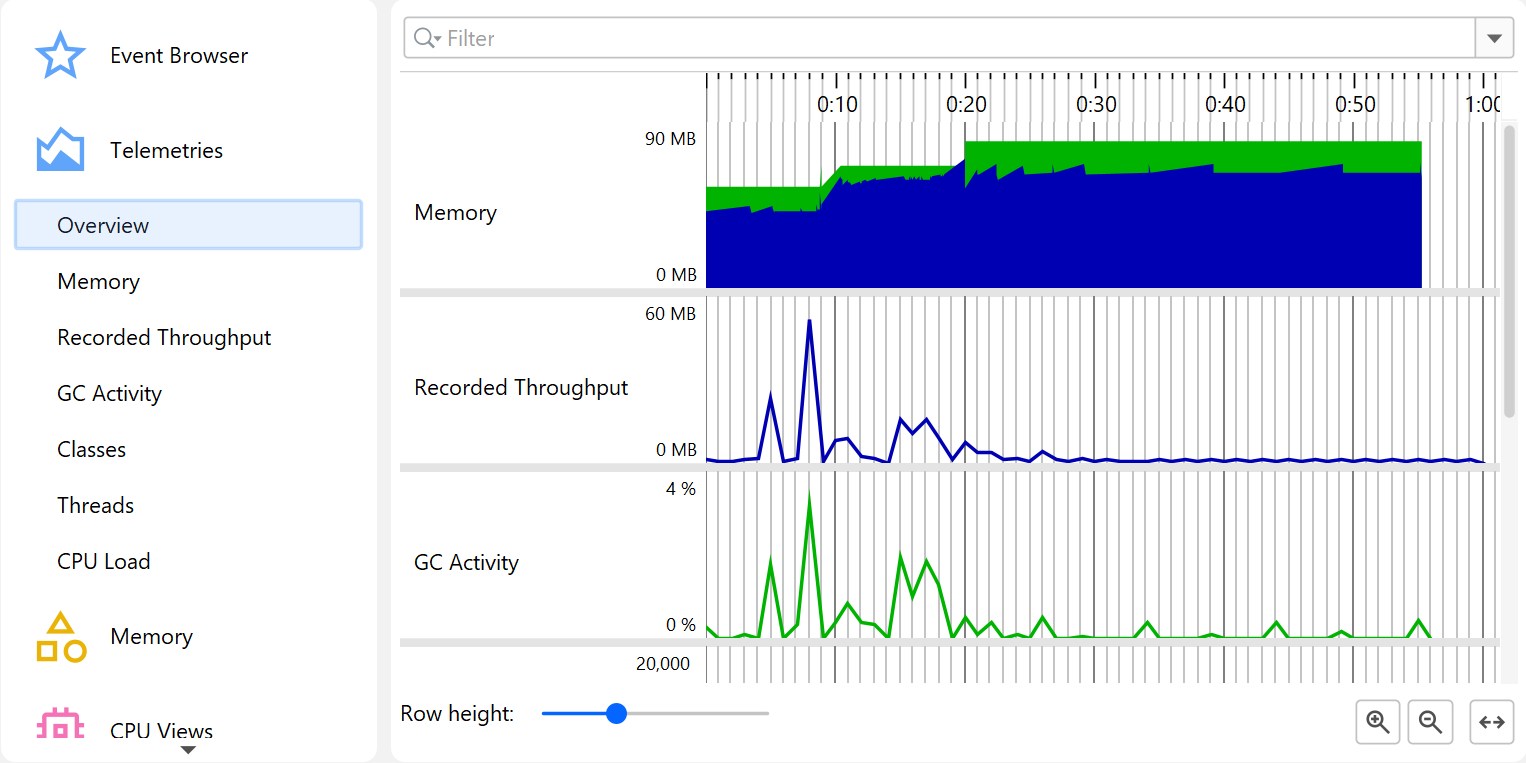
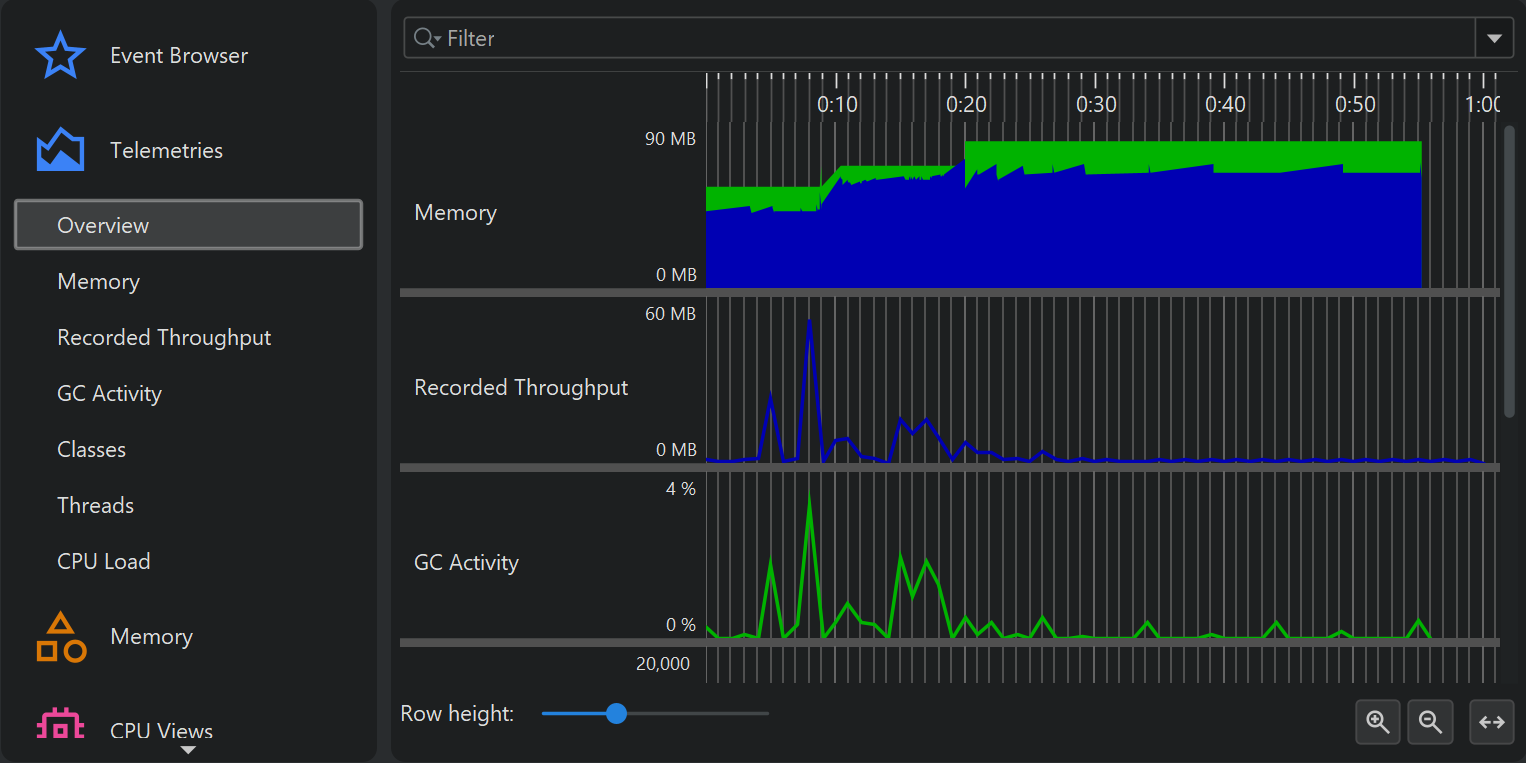
With the exception of the "Recorded objects telemetry", all telemetries in full profiling sessions are also available in JFR snapshots with some limitations in the displayed data. The memory telemetry does not show GC-specific pools, the threads telemetry does not show thread counts by thread state and the recorded throughput telemetry shows sizes instead of object counts and does not show the objects that being freed.
The table below shows the event types that are used by the various telemetries and whether they are enabled in both the "default" and the "profile" template.
| Telemetry | Event types | Enabled in profile |
|---|---|---|
| Memory | jdk.GCHeapSummary, jdk.MetaspaceSummary | all |
| Recorded throughput | jdk.ObjectAllocationSample, jdk.ObjectAllocationInNewTLAB, jdk.ObjectAllocationOutsideTLAB | profile only |
| GC activity | jdk.GarbageCollection | all |
| Classes | jdk.ClassLoadingStatistics | all |
| Threads | jdk.JavaThreadStatistics | all |
| CPU load | jdk.CPULoad | all |
Memory views
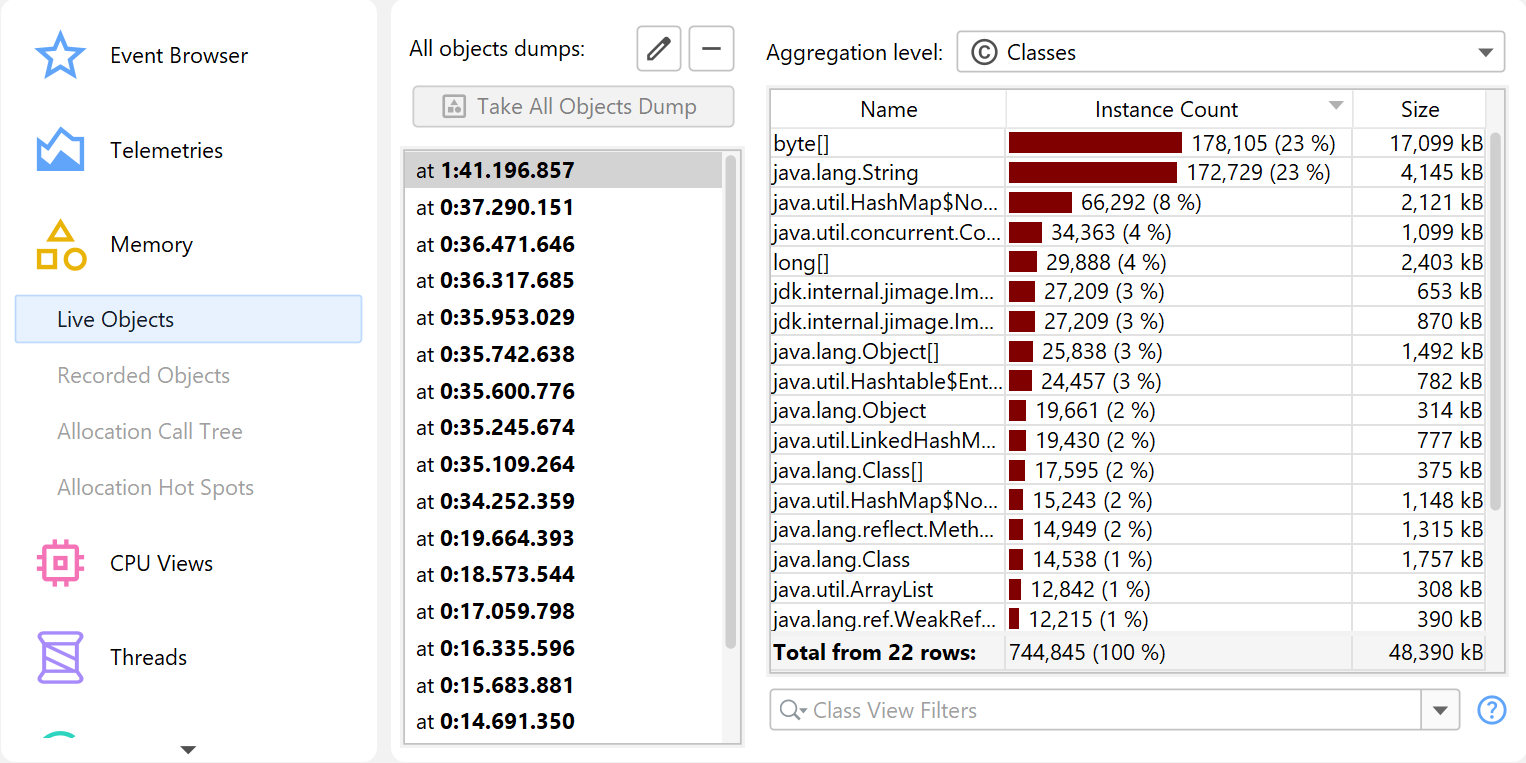
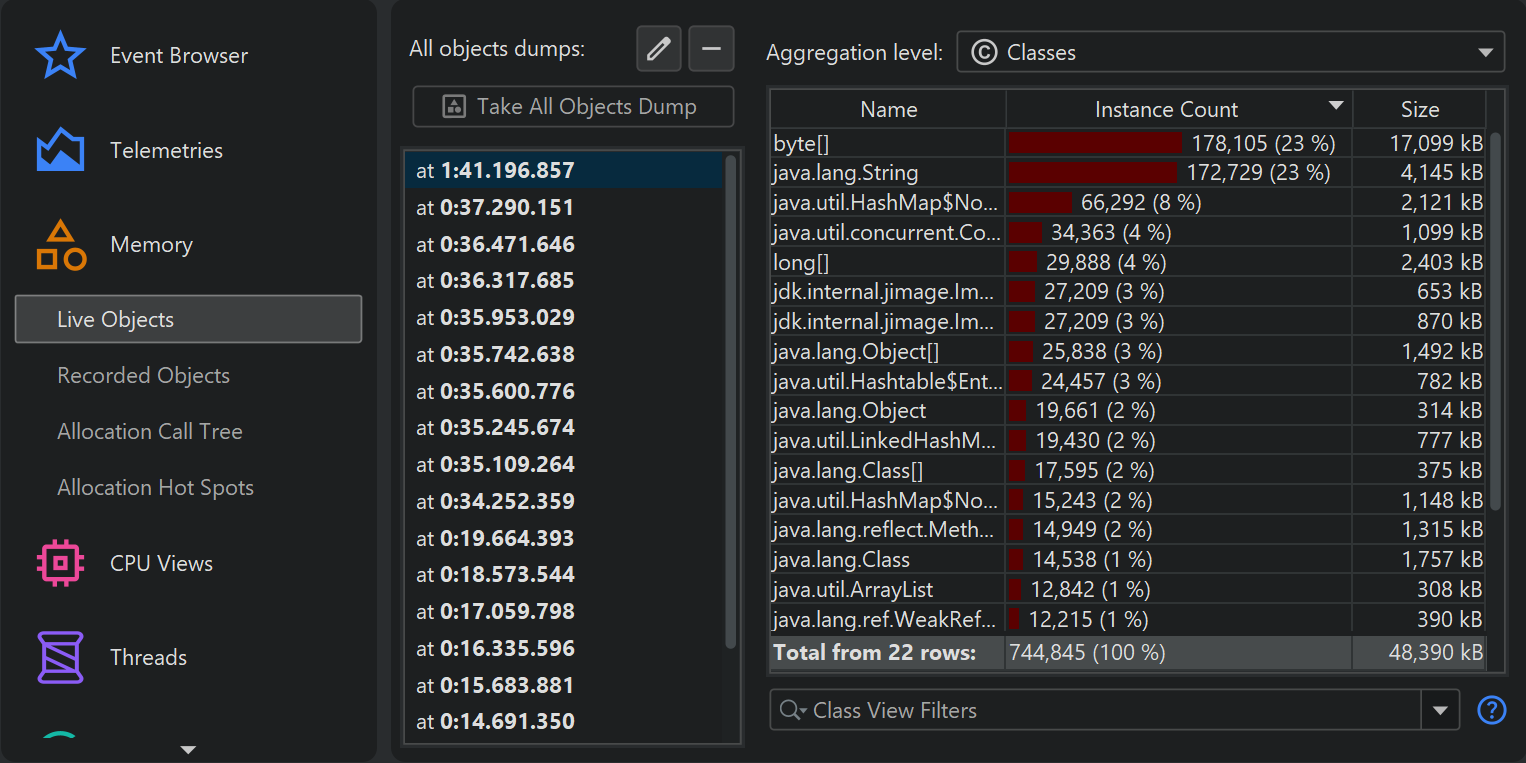
In the "Memory" section, two different event types are used to populate the views with data. The "Live objects"
view shows you a statistical representation of all classes and instance counts that remain on the heap after
a full garbage collection. This data is only available if the jdk.ObjectCount event is enabled,
which is not the case for either of the default JFR templates, because it comes with a significant overhead.
You can also toggle this setting in the high-level JFR configuration with the "Garbage collector" drop-down.
Prior to Java 17, this drop-down is labeled as "Memory profiling".
If the jdk.ObjectCount event was recorded more than once in the snapshot, the view will show you
the difference between the first and the last occurrences of the jdk.ObjectCount event.
In that way, you get a sense of how the numbers changed during the recording time and may provide some indication
of a memory leak. If these times do not coincide with the start and end points of the snapshot recording,
corresponding bookmarks are added in the telemetry views. Only classes with a total object size above a fixed
threshold (usually 1% of the heap) are included.
For any serious investigation consider using a full profiling session or taking an HPROF snapshot.
The "Recorded objects" view as well as the allocation views show you data from the
jdk.ObjectAllocationSampleevent since Java 16 and the jdk.ObjectAllocationInNewTLAB
and jdk.ObjectAllocationOutsideTLAB events in earlier Java versions. The "Allocation Profiling"
drop-down in the high-level UI also provides a way to enable these event types.
Contrary to the "Live objects" view, they only show objects that were allocated while recording was active. Allocations are sampled by JFR but the size is reported as an estimate for the total allocated size. Because of this discrepancy, the sizes reported by these views do not correspond to the sample count multiplied by the average instance size. Otherwise, these views have similar functionality to the memory views in full profiling session.
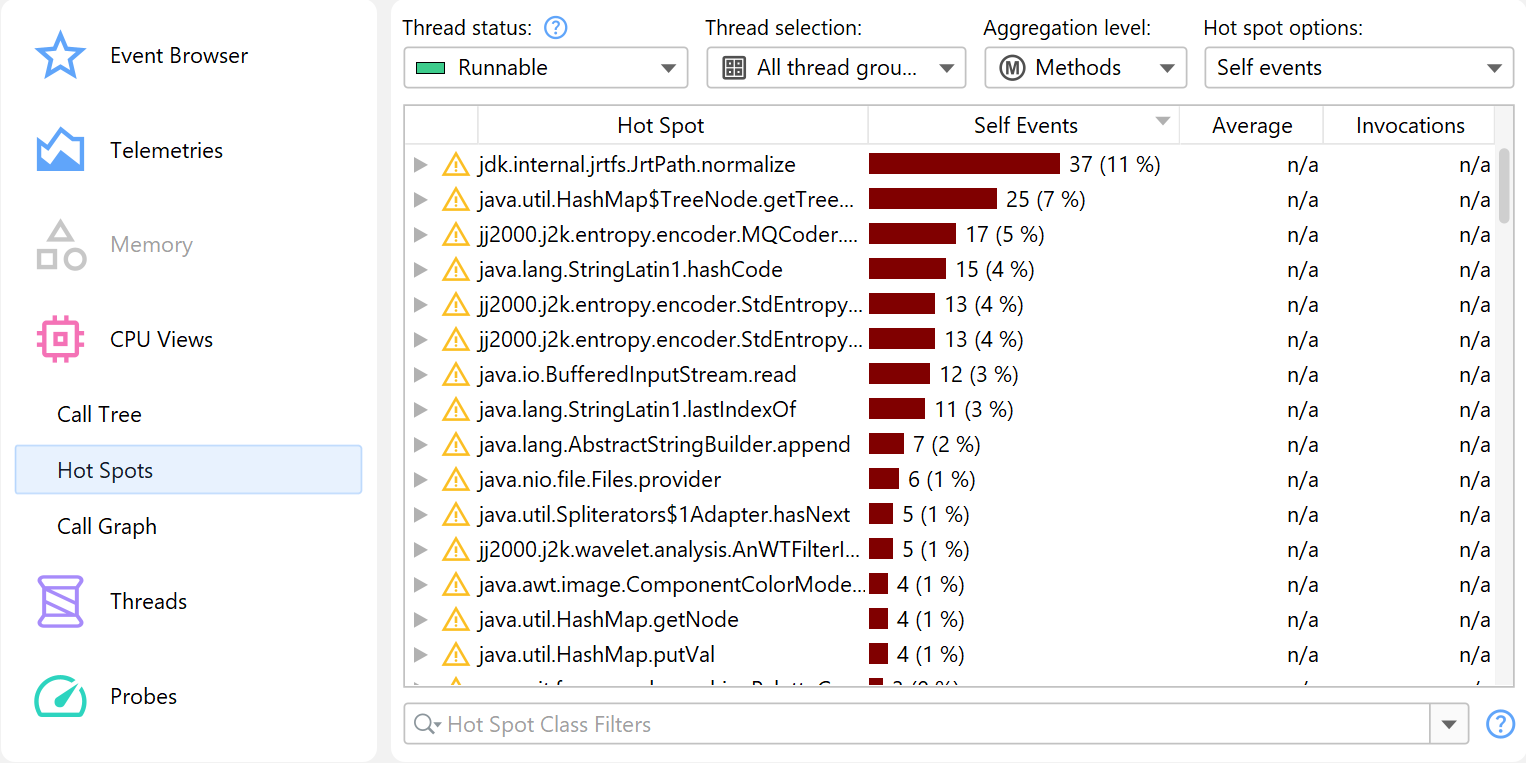
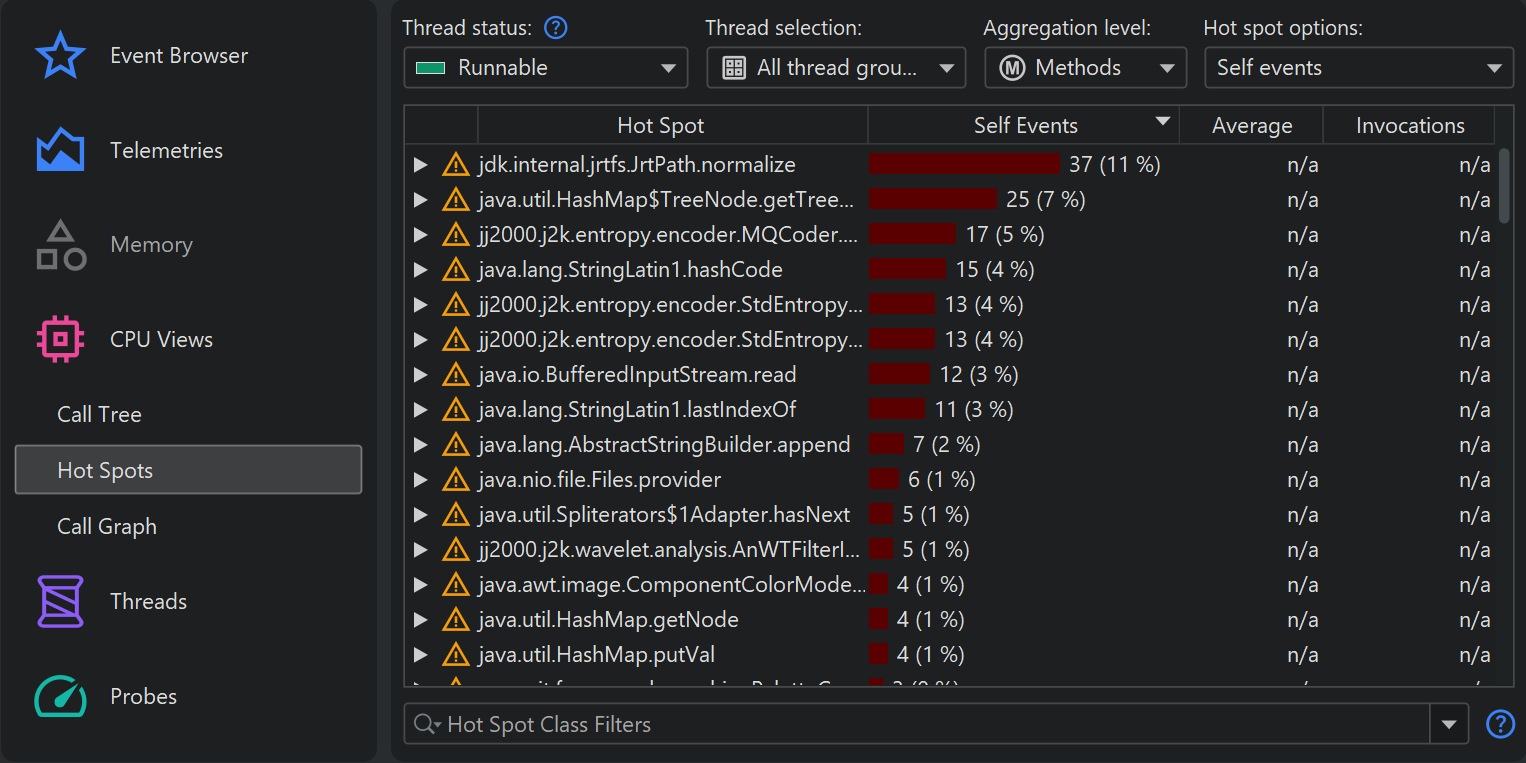
CPU views
The "CPU views" include the call tree, the hot spots view as well as the call graph. Data in the "Runnable"
thread state is based on the jdk.ExecutionSample events that are recorded by default in both
standard JFR templates. However, the sampling rate is set to 20 ms by default, which corresponds to the "Normal"
option of the "Method sampling" setting in the JFR high-level UI. Considering that JFR only samples a very small
number of random threads, getting sufficient data so that hot spots stand out sufficiently can take a very long
time. Consider lowering the period for the jdk.ExecutionSample if necessary. Keep in mind that this
can lead to very large snapshot sizes because JFR does not cumulate data.
Due to the fact, that threads are sampled sporadically, it is not possible to estimate actual execution times like in a full profiling session. Rather than times, the event counts are shown in the call tree and the hot spots views. This is similar to async sampling which has the same drawback. The other JFR thread states are "Waiting", "Blocking" and "Socket and file I/O" and still measure times. Because of this discrepancy, the "All thread states" mode is not available in the thread status selector.
Another consideration is that the non-runnable thread states are calculated from events which have configurable minimum duration thresholds that are shown in the tool tip next to the thread status selector. The actual total time of these thread states may be significantly larger. The table with the event types used for assembling the thread states is shown below:
| Thread state | Event types |
|---|---|
| Runnable | jdk.ExecutionSample |
| Waiting | jdk.JavaMonitorWait, jdk.ThreadSleep, jdk.ThreadPark |
| Blocking | jdk.JavaMonitorEnter |
| Socket and file I/O | jdk.SocketRead, jdk.SocketWrite, jdk.FileRead, jdk.FileWrite |
The functionality of the views is explained in the help topic on the CPU views. Note that many features of full profiling sessions are not available in a JFR context.
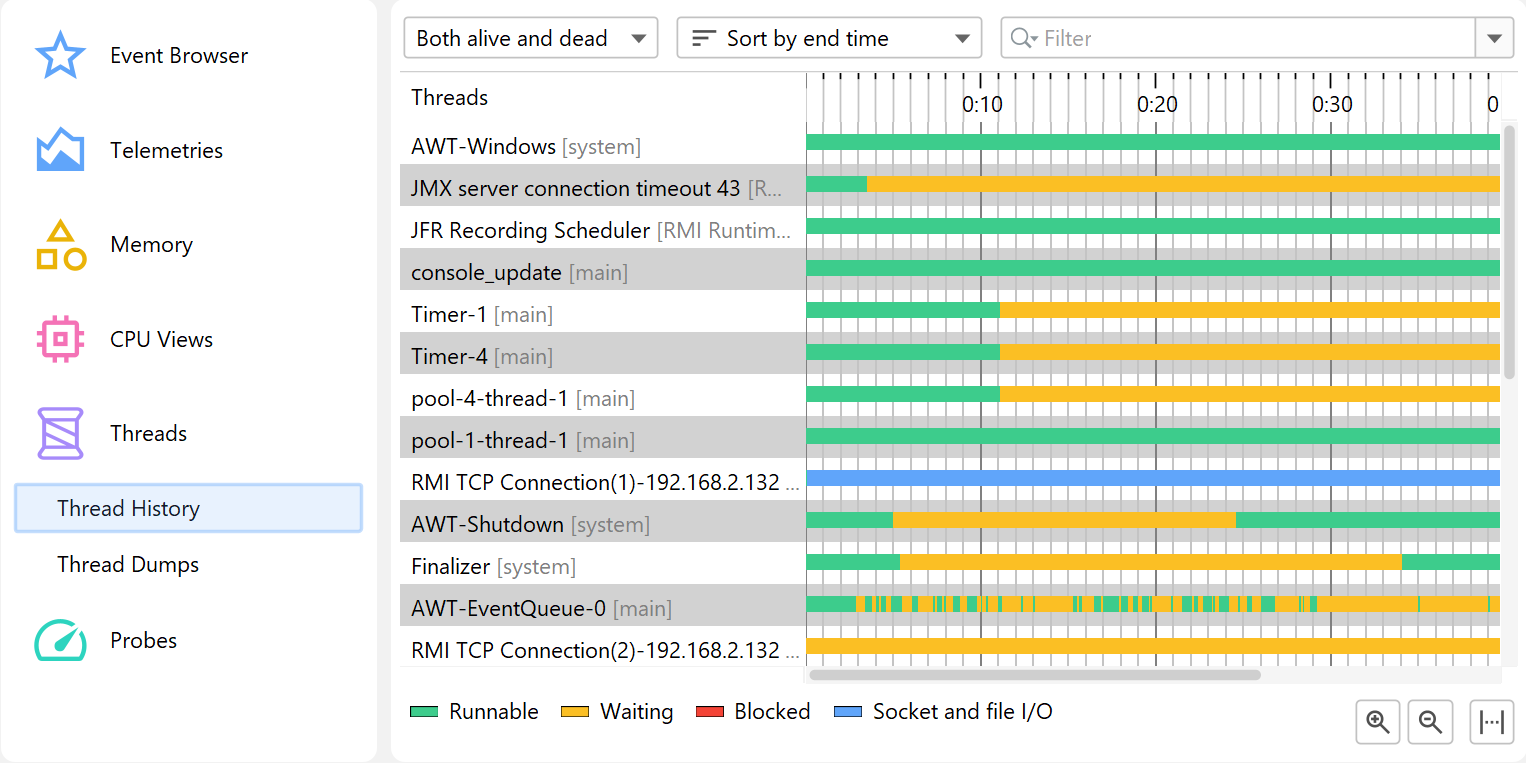
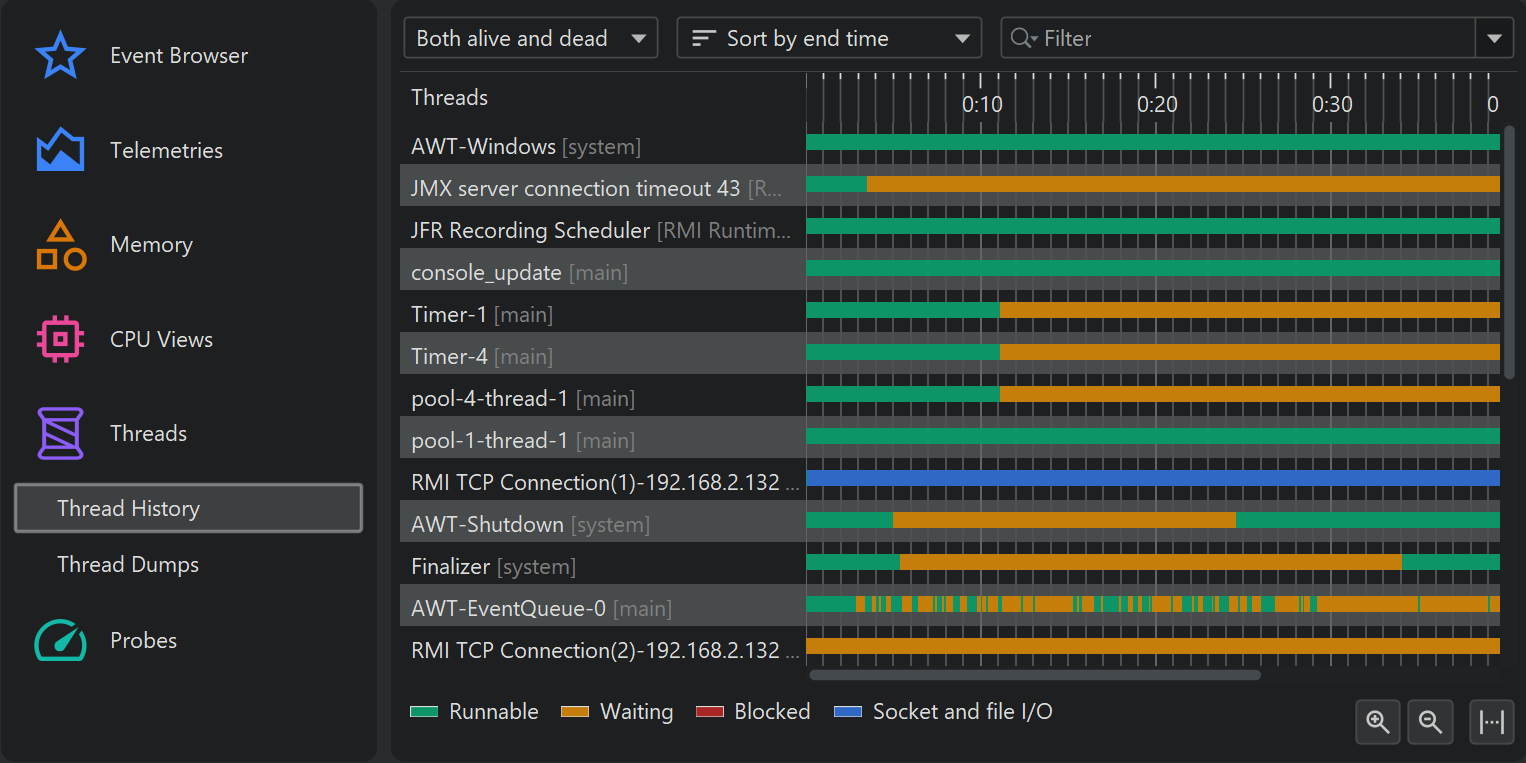
Thread and monitor views
From the chronological method sampling data, the thread history view can be calculated, including the tool tips that show stack traces for waiting and blocking times.
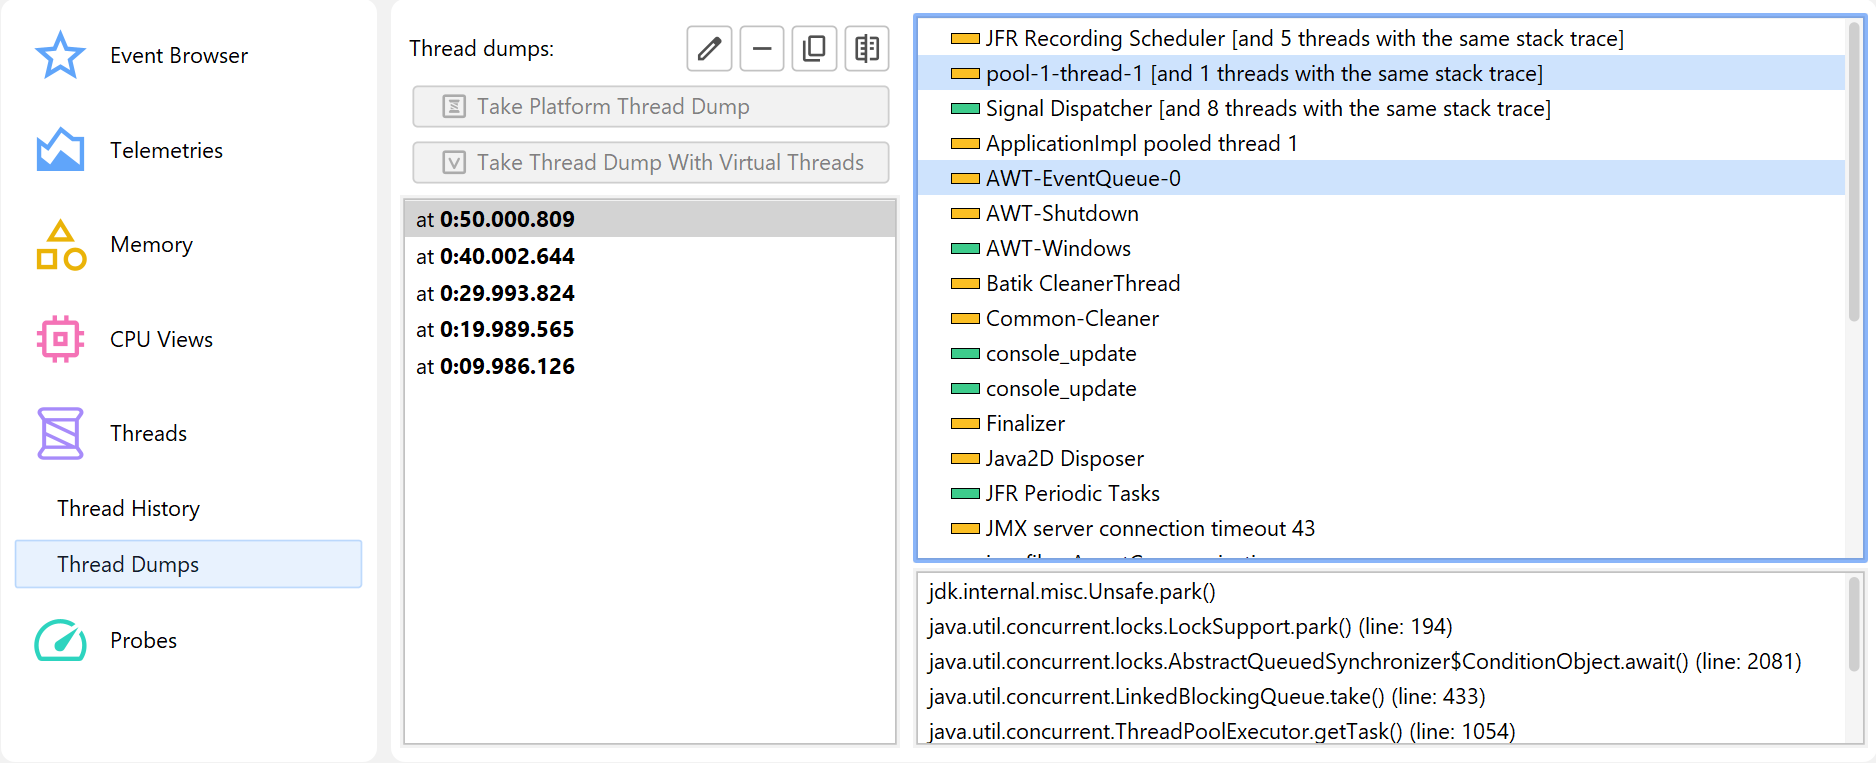
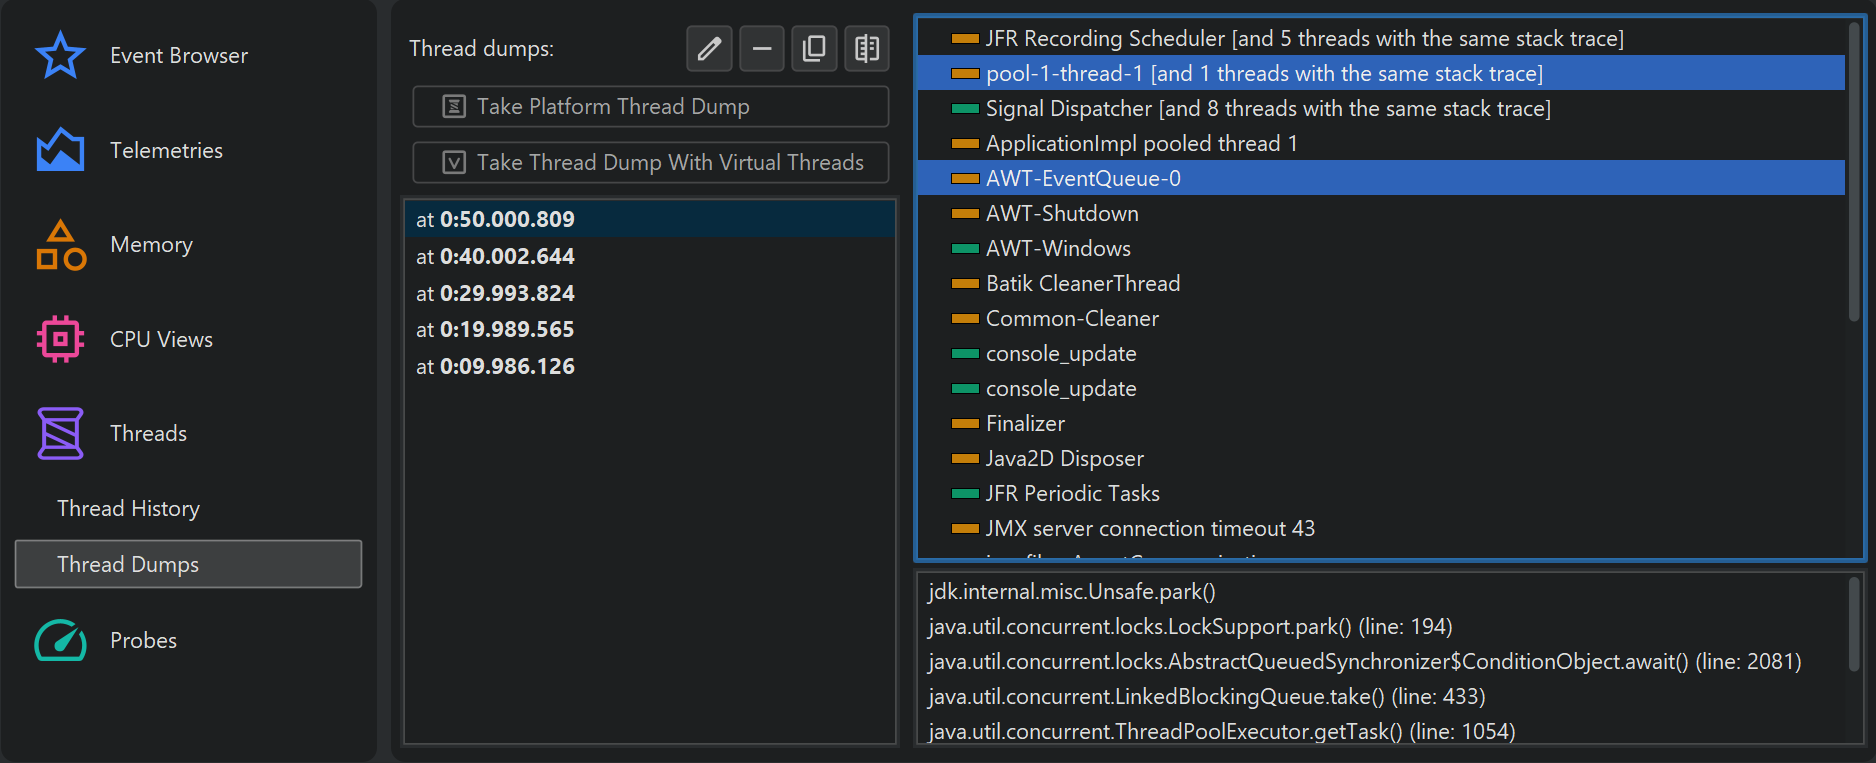
Thread dumps are a feature in both JFR and JProfiler and are shown in the same view. In this case, the event
browser is not a substitute because it has no way of showing the structured content of the thread dump column
of the jdk.ThreadDump event. In the thread dumps view you can also
compare different thread dumps.
Probes
Some of the JVM probes in a full profiling session have equivalent data sources in JFR snapshots. Their main advantage compared to the event browser is that they combine multiple related event types. The table below shows the available probes with the event types that are used as their data sources.
| Probe | Event types | Enabled in profile |
|---|---|---|
| Sockets | jdk.SocketRead, jdk.SocketWrite | all |
| Files | jdk.FileRead, jdk.FileWrite | all |
| Classes | jdk.ClassLoad, jdk.ClassUnload, jdk.ClassDefine | none |
| Exceptions | jdk.JavaErrorThrow, jdk.JavaExceptionThrow | errors in both, exceptions in none |
| Garbage Collector | jdk.GarbageCollection, jdk.GCPhasePause, jdk.YoungGarbageCollection, jdk.OldGarbageCollection, jdk.GCReferenceStatistics, jdk.GCPhasePauseLevel<n>, jdk.GCHeapSummary, jdk.MetaspaceSummary, jdk.GCHeapConfiguration, jdk.GCConfiguration, jdk.YoungGenerationConfiguration, jdk.GCSurvivorConfiguration, jdk.GCTLABConfiguration | all |
Class loading has a separate check box in the high-level JFR UI that switches on all three class loading events.
Each probe shows a number of views. In contrast to the event browser, the focus is on the aggregated data and not on the single events. This is also how probes in JProfiler differ conceptually from JFR data collection.
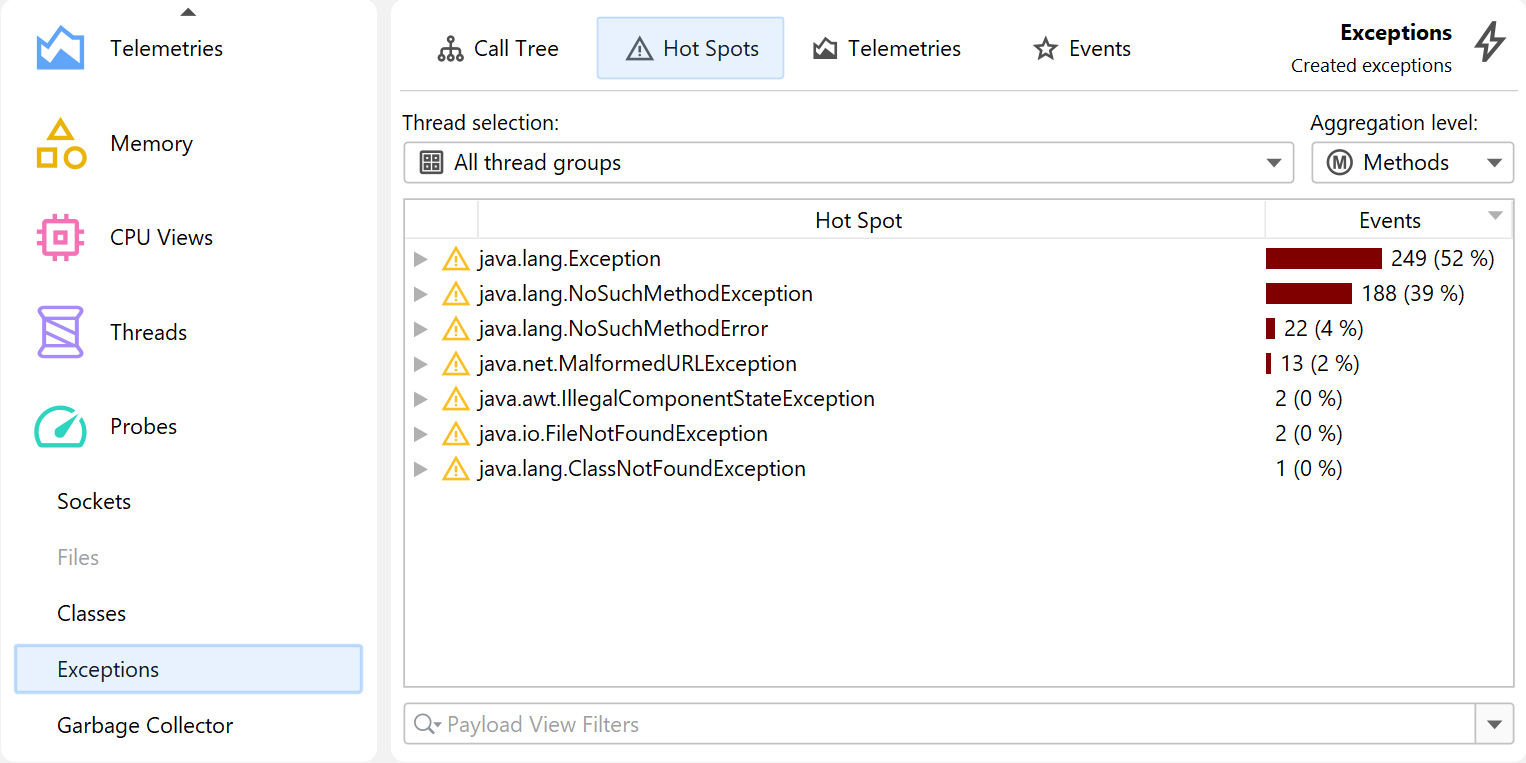
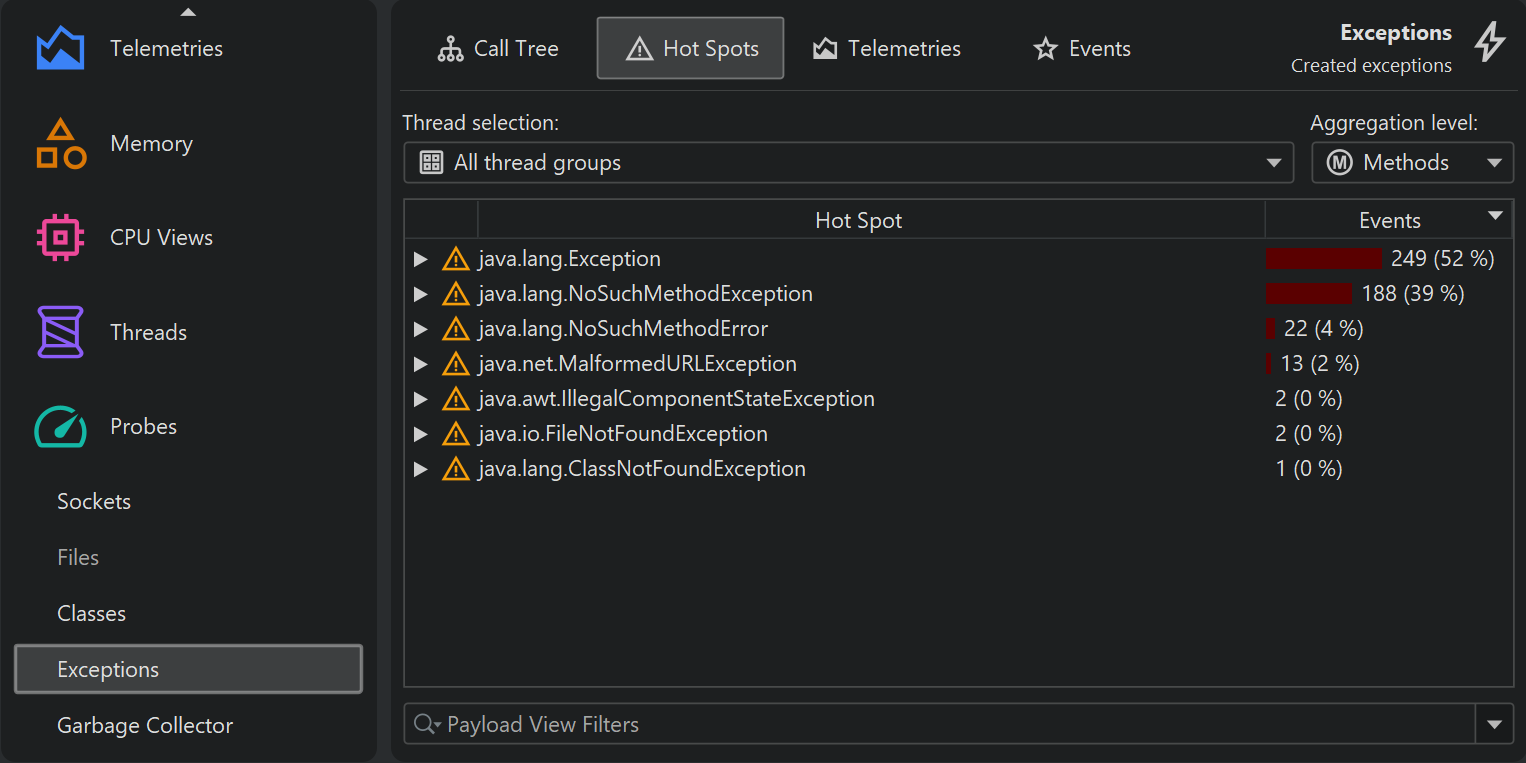
Except for the Garbage collector probe, all probes have the following views: The call tree and hot spot views allow you to choose a single thread or a thread group as well as an aggregation level. By default, all threads are shown and the aggregation level is set to "Methods".
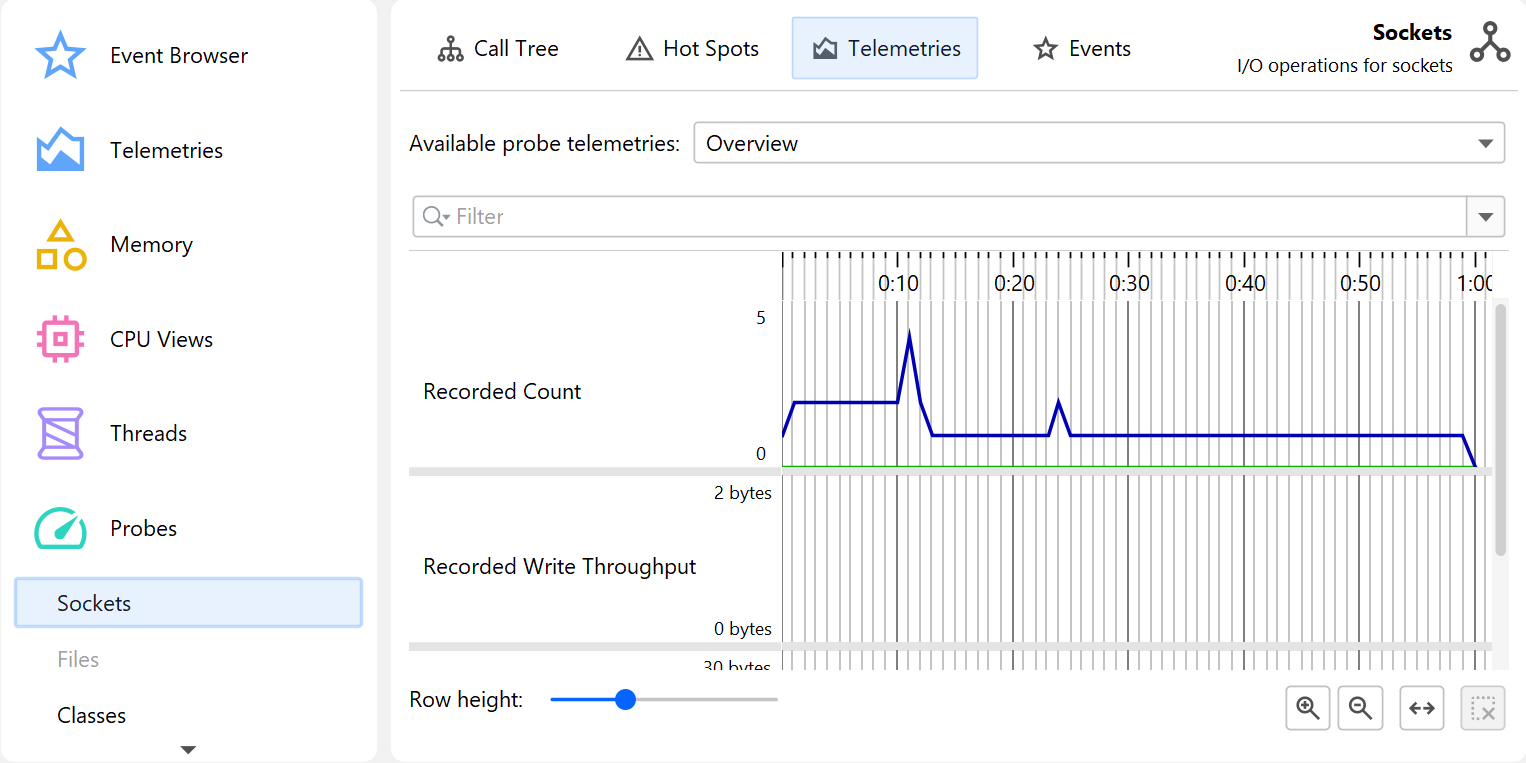
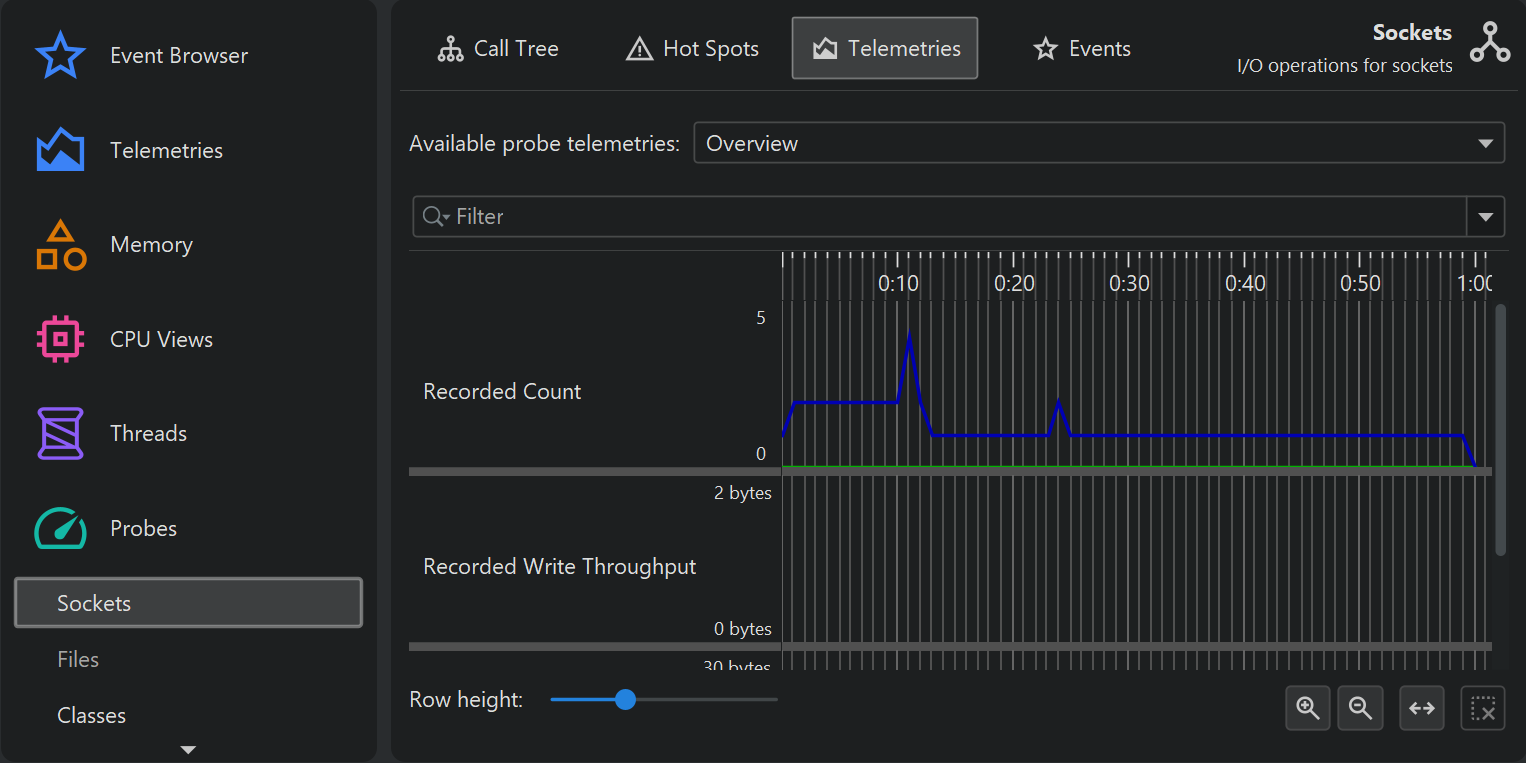
The telemetries view displays one or more telemetries from the recorded data with an overview page that shows all of them at once. The full telemetry can be opened by clicking on the telemetry name. By dragging along the time axis, you can select the corresponding events in the events view.
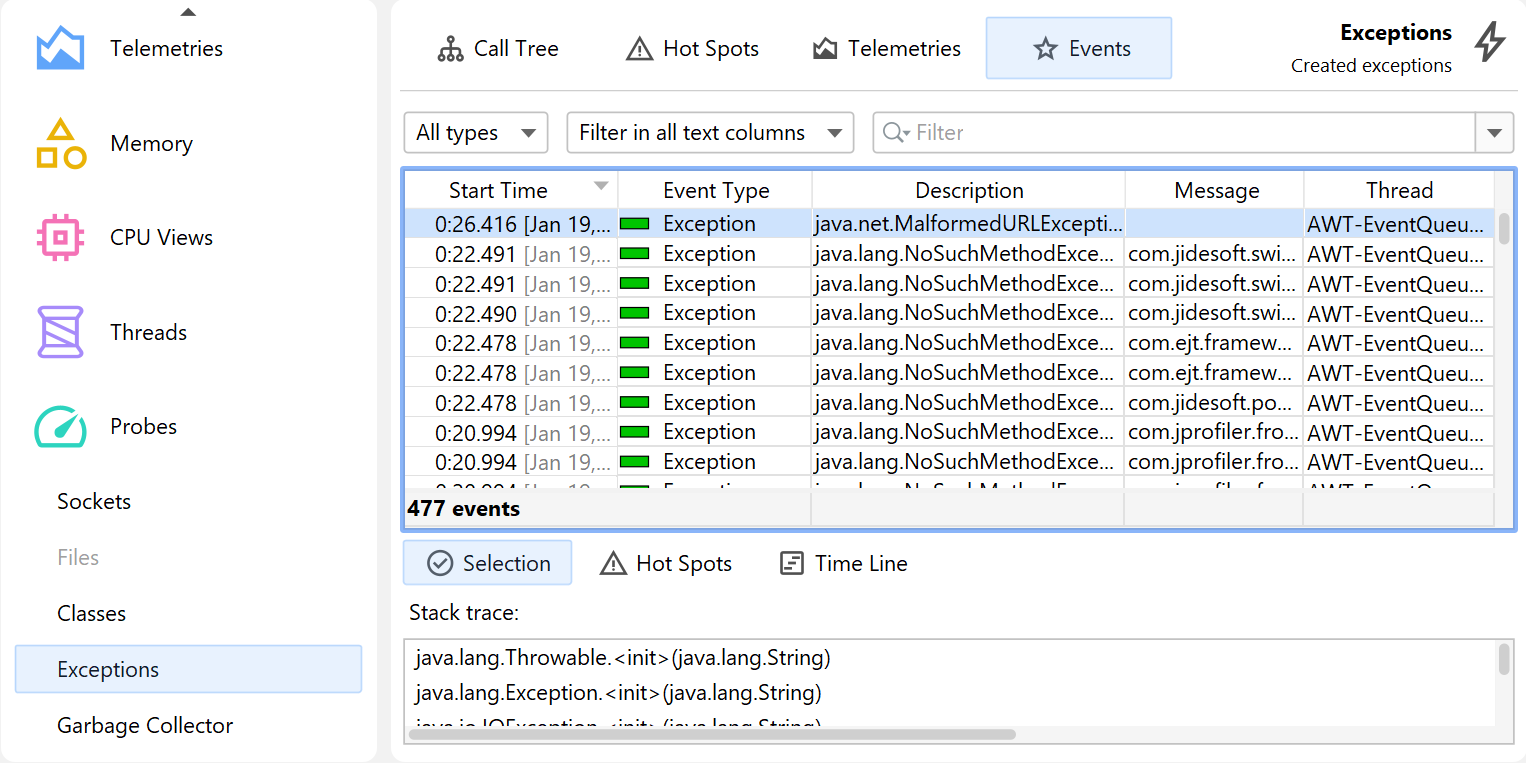
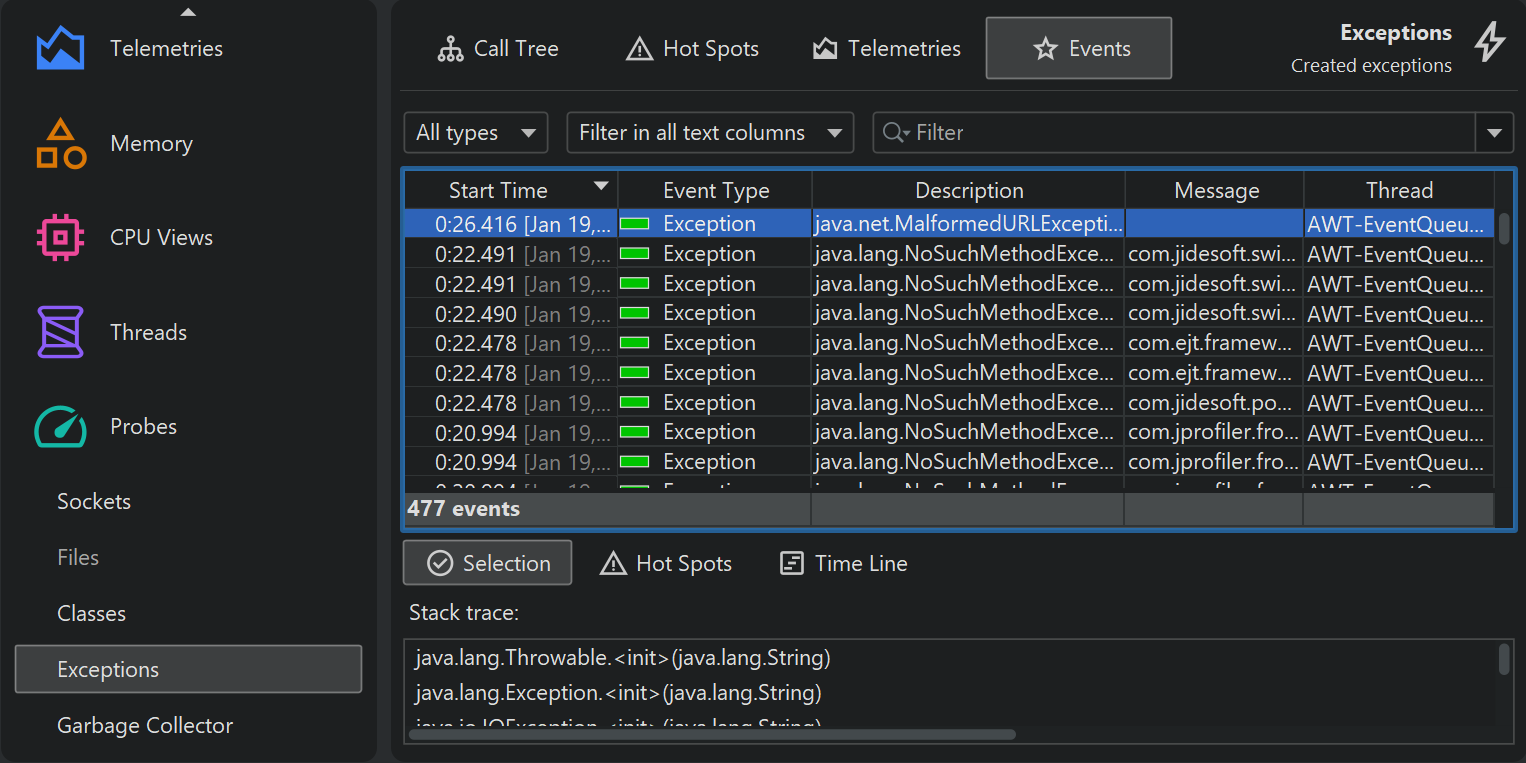
The events view is similar to the one in the JFR browser. However, it shows multiple event types corresponding to the underlying JFR events and offers a type selector. Filtering and stack trace display for single and multiple selection are handled just as in the event browser. Also, there are histogram views for time and memory measurements where you can select ranges by dragging along the horizontal axis.
The garbage collector view is special, because full profiling sessions can show the exact same information in profiling sessions with Java 17 or higher. When the garbage collector probe in the JVM probe category is recorded, JFR streaming is used to obtain the necessary data. See the chapter on garbage collector analysis for more information.