When you profile your application, the methods and classes that come up in JProfiler's views often lead to questions that can only be answered by looking at their source code. While JProfiler provides a built-in source code viewer for that purpose, it has limited functionality. Also, when a problem is found, the next move is usually to edit the offending code. Ideally, there should be a direct path from the profiling views in JProfiler to the IDE, so you can inspect and improve code without any manual lookups.
Installing IDE integrations
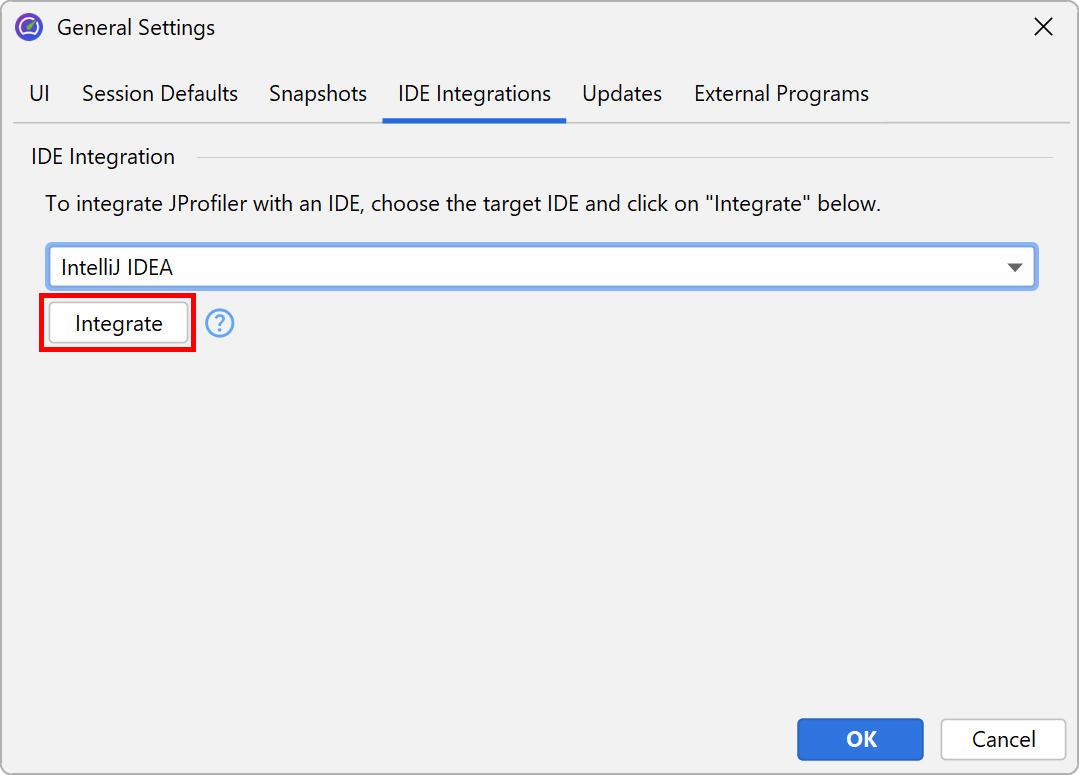
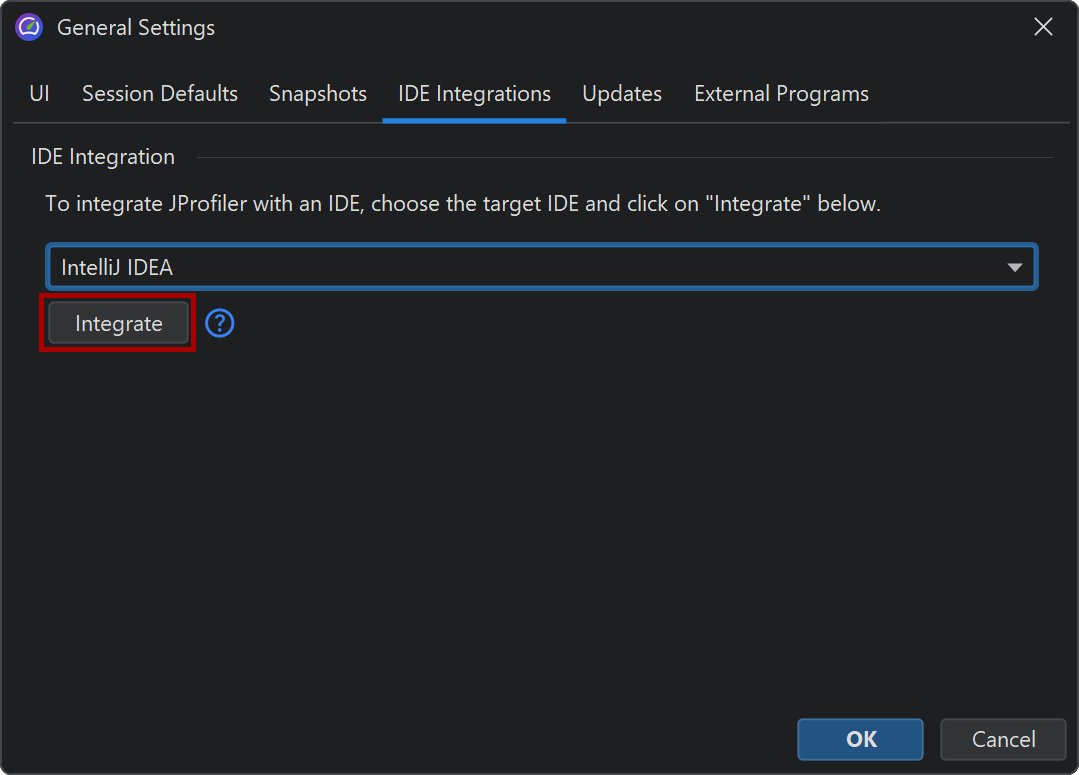
JProfiler offers IDE integrations for IntelliJ IDEA, Eclipse and NetBeans. To install an IDE plugin, invoke Session→IDE Integrations from the main menu. The plugin installation for IntelliJ IDEA is performed with the plugin management in the IDE, for other IDEs the plugin is installed directly by JProfiler. The installer also offers this action to make it easy to update the IDE plugin along with the JProfiler installation. The integration wizard connects the plugin with the current installation directory of JProfiler. In the IDE plugin settings, you can change the used version of JProfiler at any time. The protocol between the plugin and the JProfiler GUI is backwards compatible and can work with older versions of JProfiler as well.
The IntelliJ IDEA integration can also be installed from the plugin manager. In that case, the plugin will ask you for the location of the JProfiler executable when you profile for the first time.
On different platforms, the JProfiler executable is located in different directories. On Windows, it's
bin\jprofiler.exe, on Linux or Unix bin/jprofiler and
on macOS there is a special helper shell script Contents/Resources/app/bin/macos/jprofiler.sh
in the JProfiler application bundle for the IDE integrations.
Source code navigation
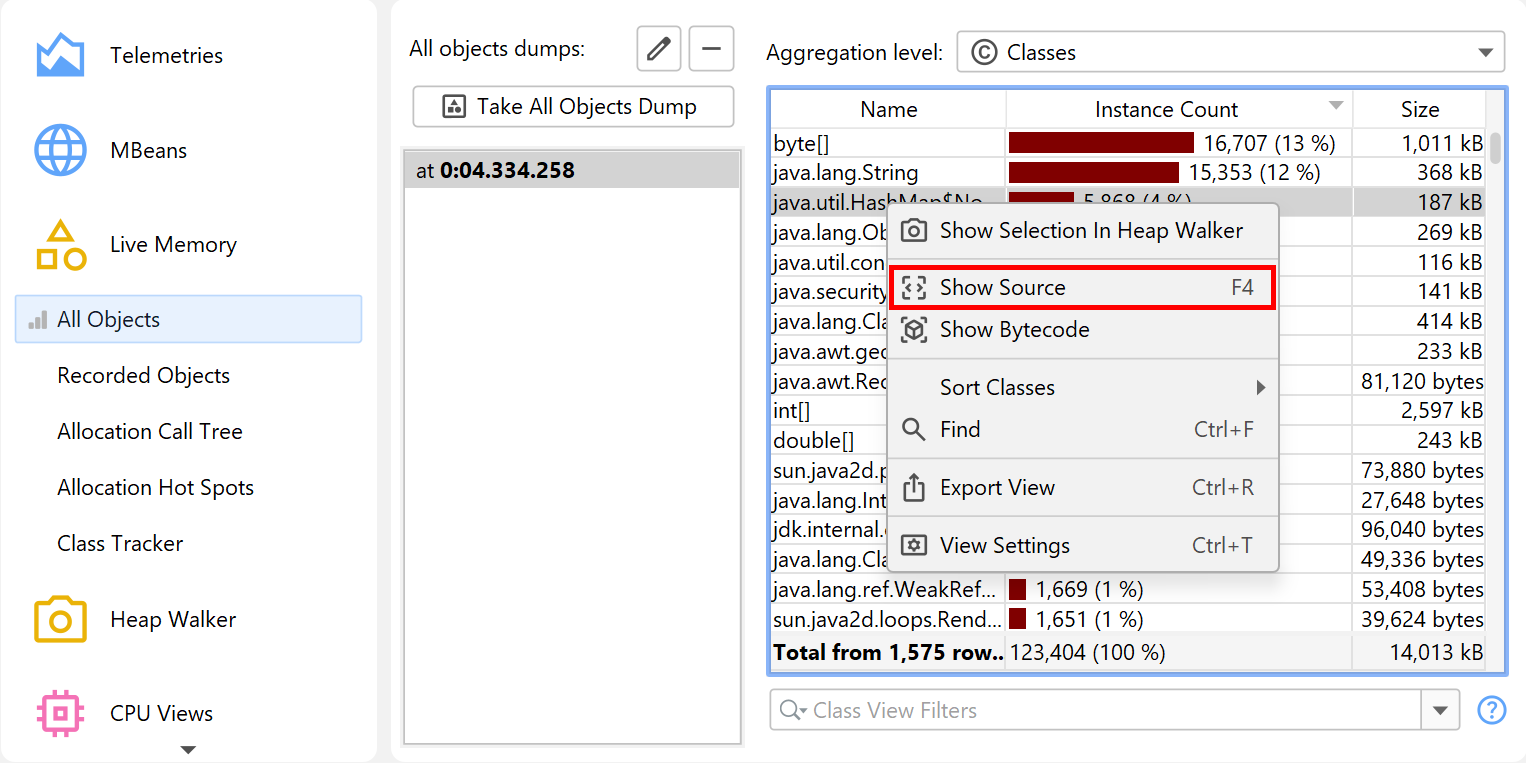
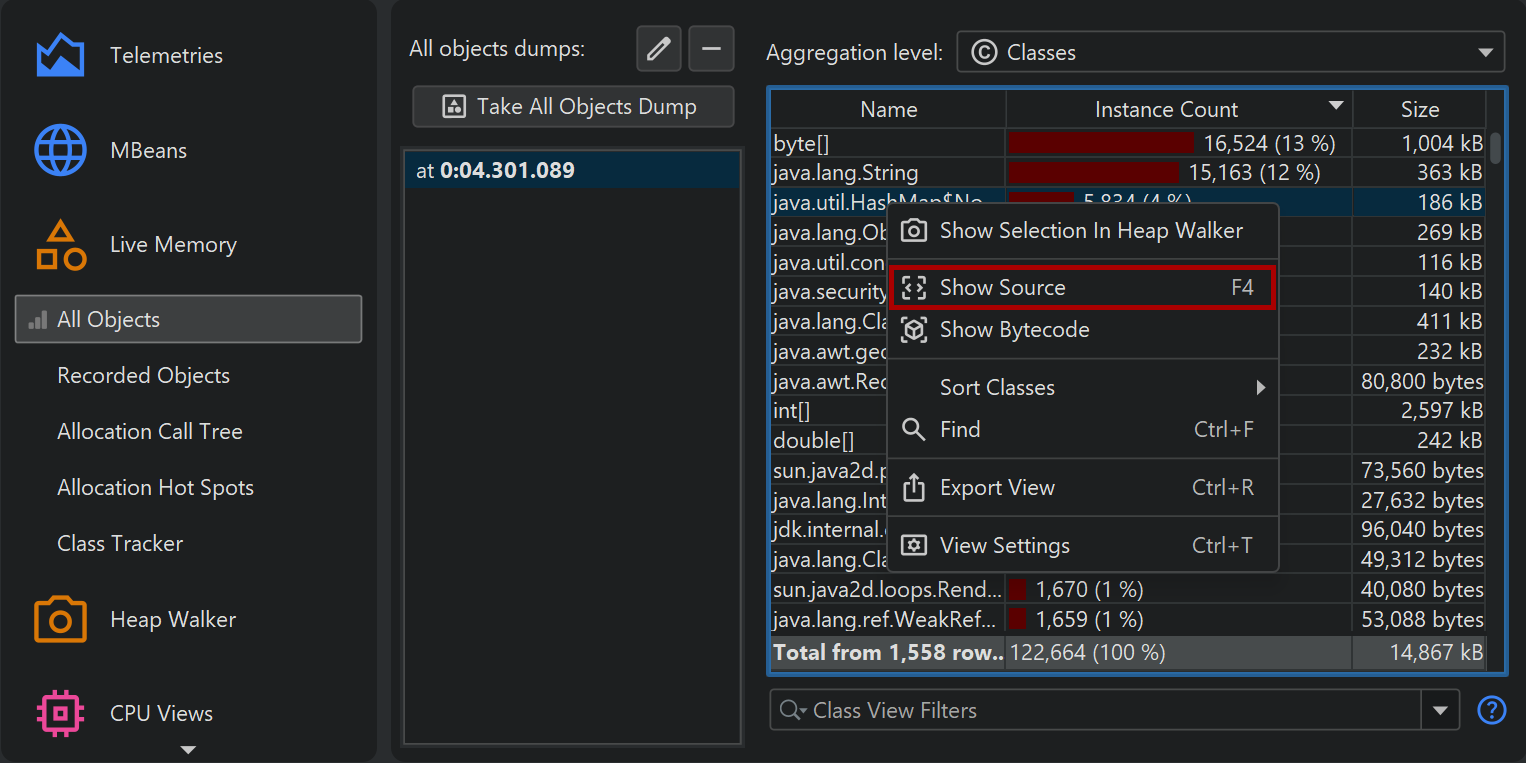
Everywhere a class name or a method name is shown in JProfiler, the context menu contains a Show Source action.
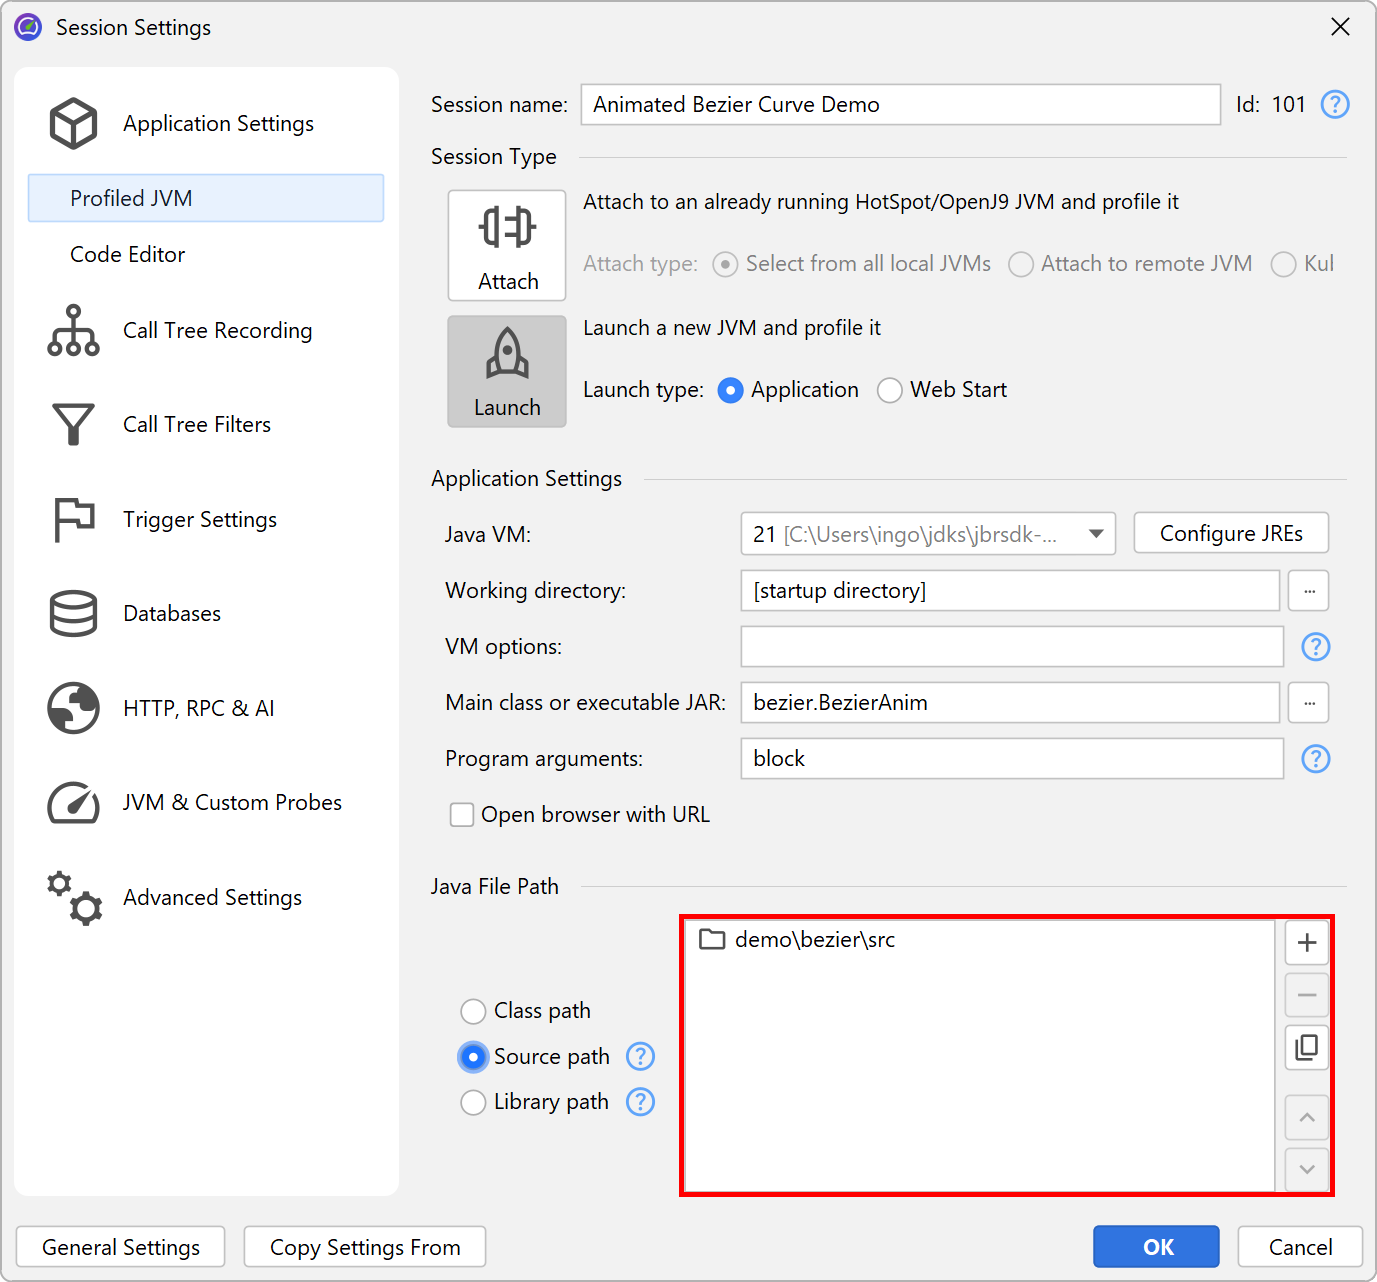
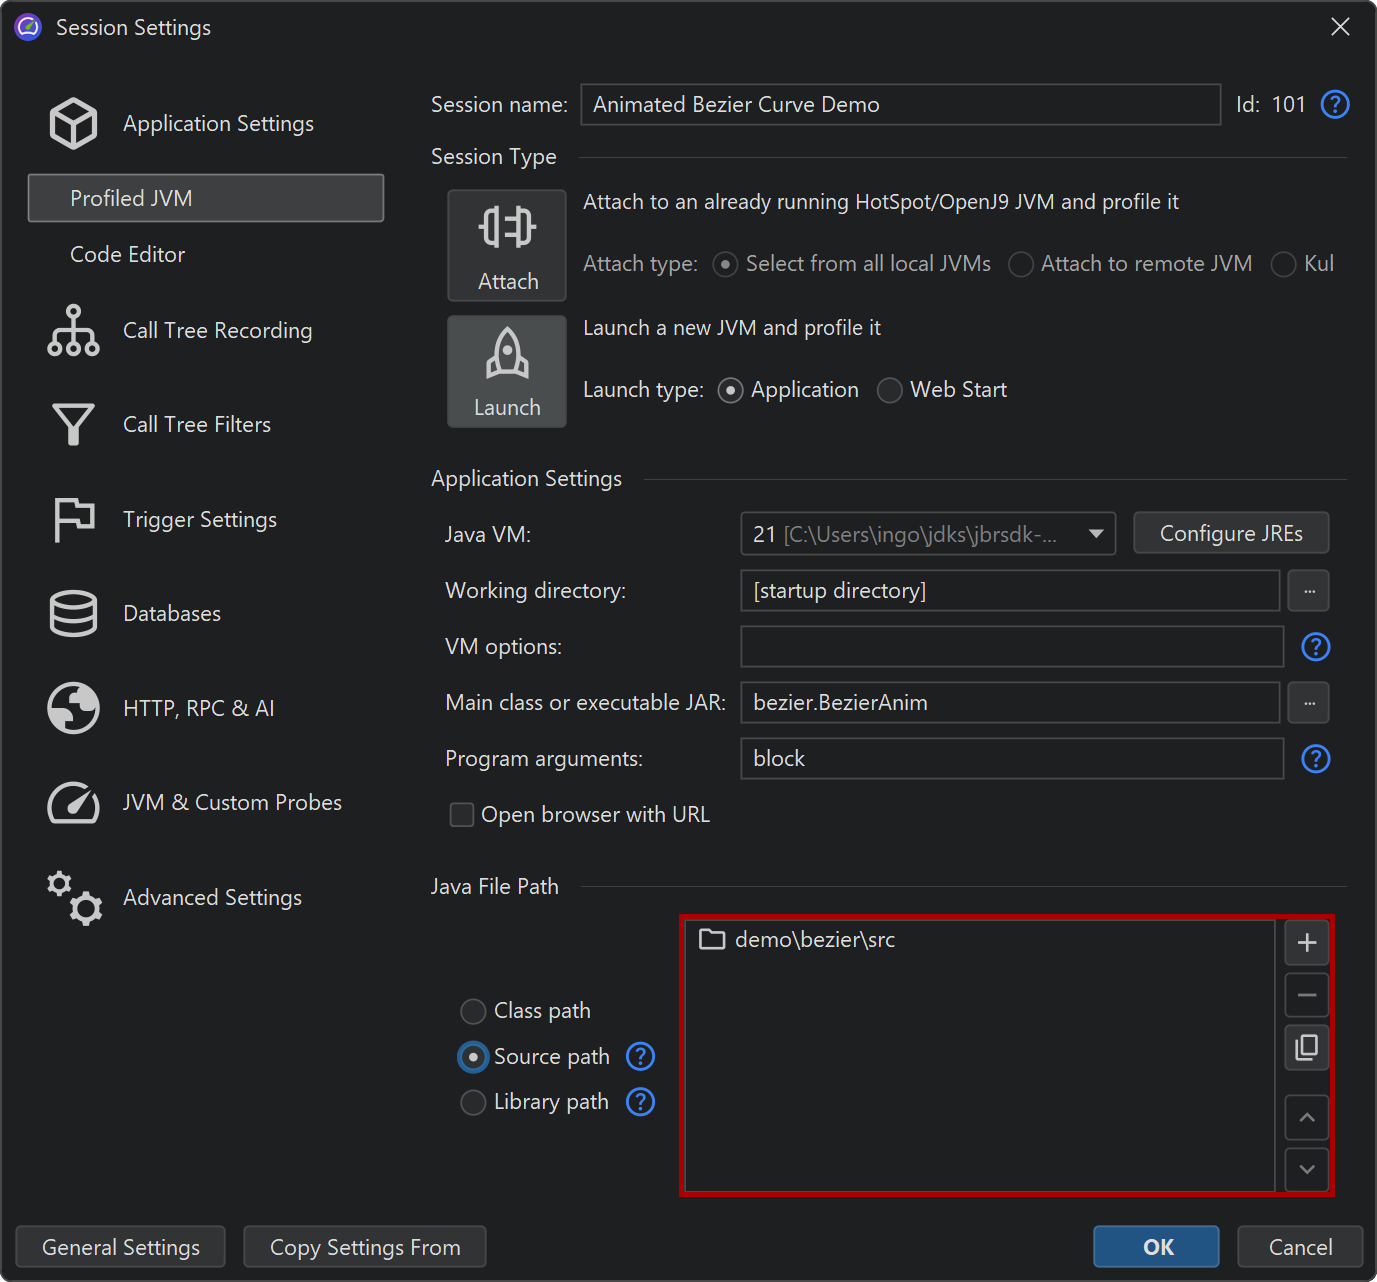
If the session was not started from the IDE, the built-in source code viewer is shown that uses line number tables in the compiled class files to find methods. A source file can only be found if its root directory or a containing ZIP file is configured in the application settings
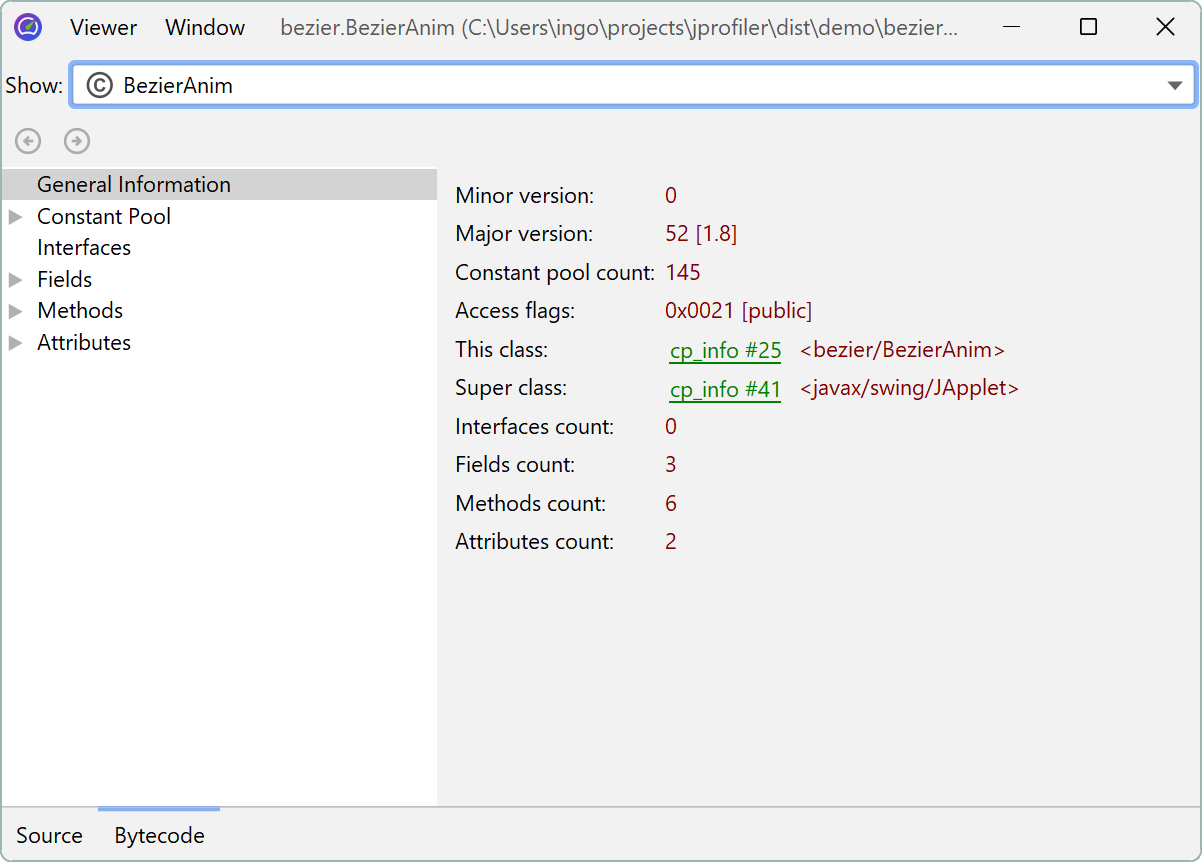
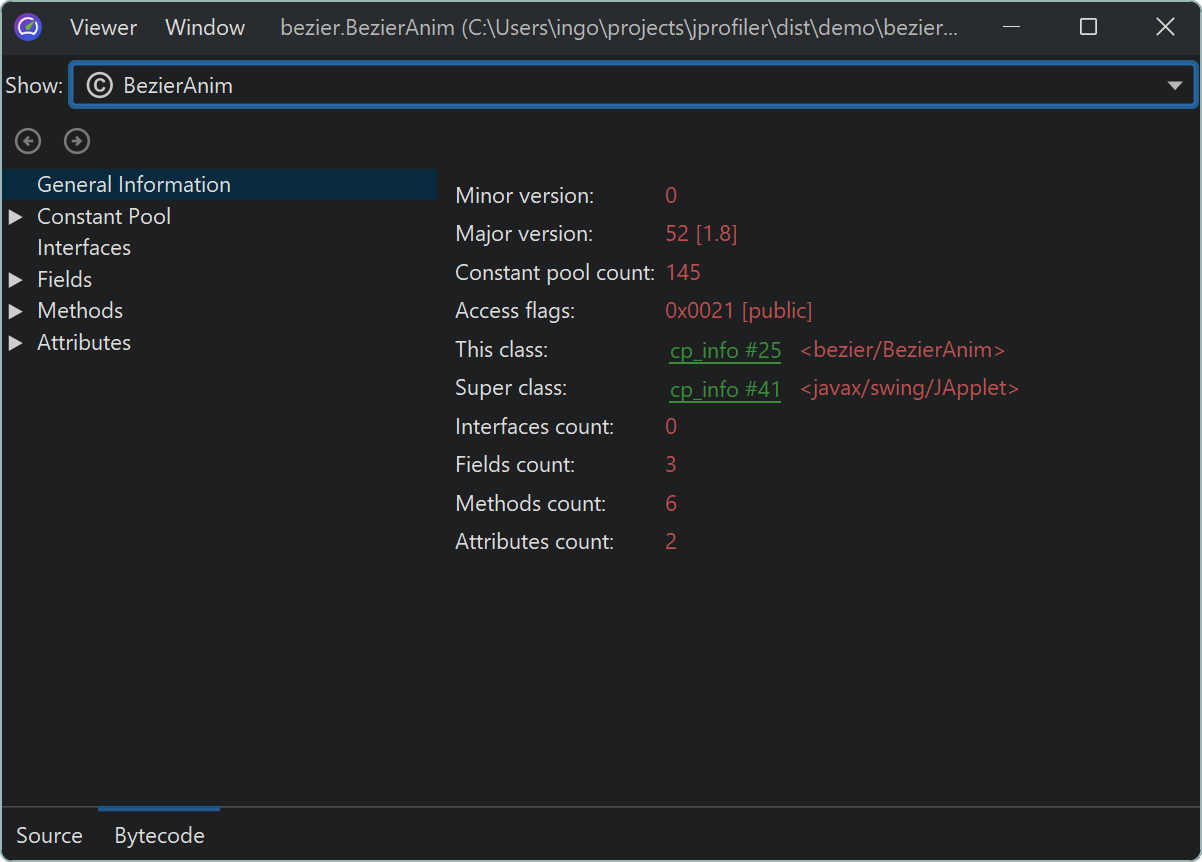
Together with the source code display, a bytecode viewer based on the jclasslib bytecode viewer shows the structure of the compiled class file.
If the session is launched from the IDE, the integrated source code viewer is not used and the Show Source action defers to the IDE plugin. The IDE integrations support launched profiling sessions, opening saved snapshots as well as attaching to running JVMs.
For live profiling sessions, you start the profiled application for the IDE similarly to running or debugging it. The JProfiler plugin will then insert the VM parameter for profiling and connect a JProfiler window to it. JProfiler is running as a separate process and is started by the plugin if required. Source code navigation requests from JProfiler are sent to the associated project in the IDE. JProfiler and the IDE plugin cooperate to make window switching seamless without blinking task bar entries, just as if you were dealing with a single process.
When starting the session, the "Session startup" dialog lets you configure all profiling settings. The configured profiling settings that are used for a launched session are remembered by JProfiler on a per-project or on a per-run-configuration basis, depending on the IDE integrations. When a session is profiled for the first time, the IDE plugin automatically determines a list of profiled packages based on the topmost classes in the package hierarchy of your source files. At any later point, you can go to the filter settings step in the session settings dialog and use the reset button to perform this calculation again.
For snapshots, the IDE integration is set up by opening a snapshot file from within the IDE with the File→Open action or by double-clicking on it in the project window. Source code navigation from JProfiler will then be directed into the current project. Finally, the IDE plugin adds an Attach to JVM action to the IDE that lets you select a running JVM and get source code navigation into the IDE, similar to the mechanism for snapshots.
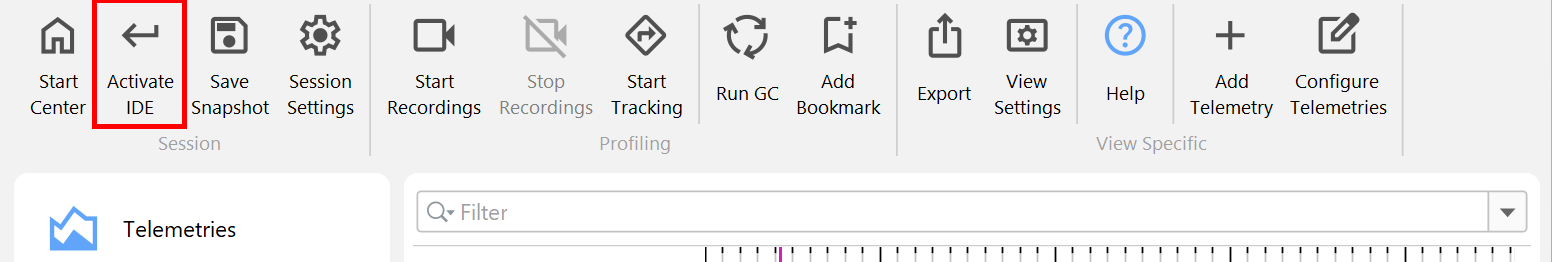
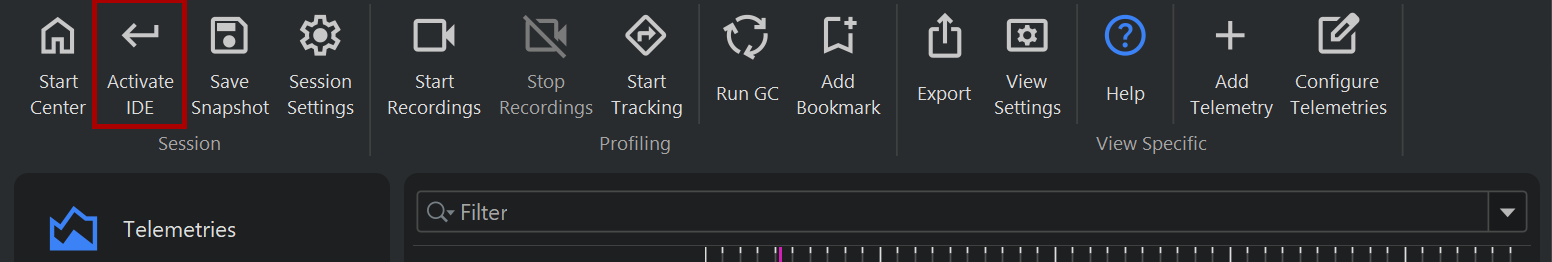
Sometimes you may want to switch to the IDE without a particular class or method in mind. For that purpose,
the toolbar in the JProfiler window has an Activate IDE button that is shown for profiling sessions
that are opened by an IDE integration. The action is bound to the F11 key, just like the JProfiler
activation action in the IDE, so you can switch back and forth between the IDE and JProfiler with the same key
binding.
IntelliJ IDEA integration
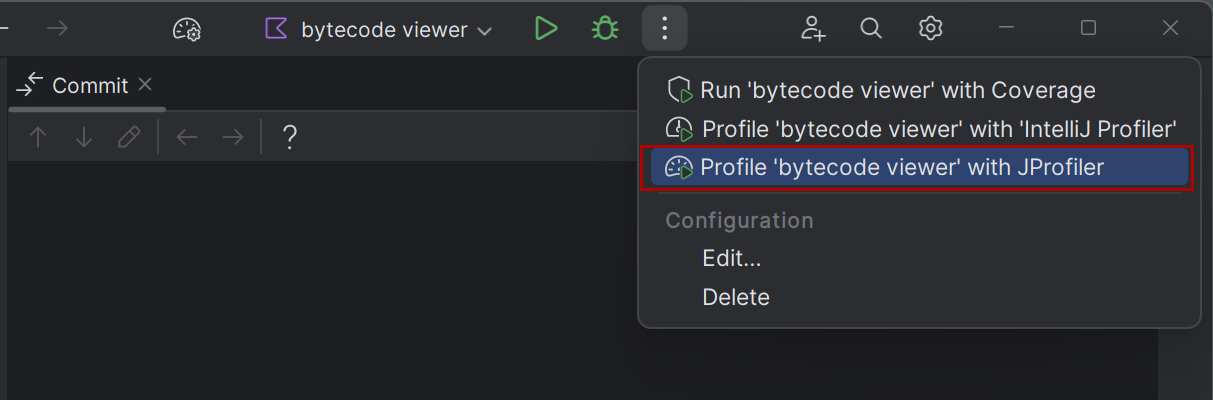
To profile your application from IntelliJ IDEA, choose one of the profiling commands in the Run menu, or click on the drop-down menu next to the run or debug actions in the main toolbar to choose the "Profile with JProfiler" action. JProfiler can profile most run configuration types in IntelliJ IDEA, including application servers.
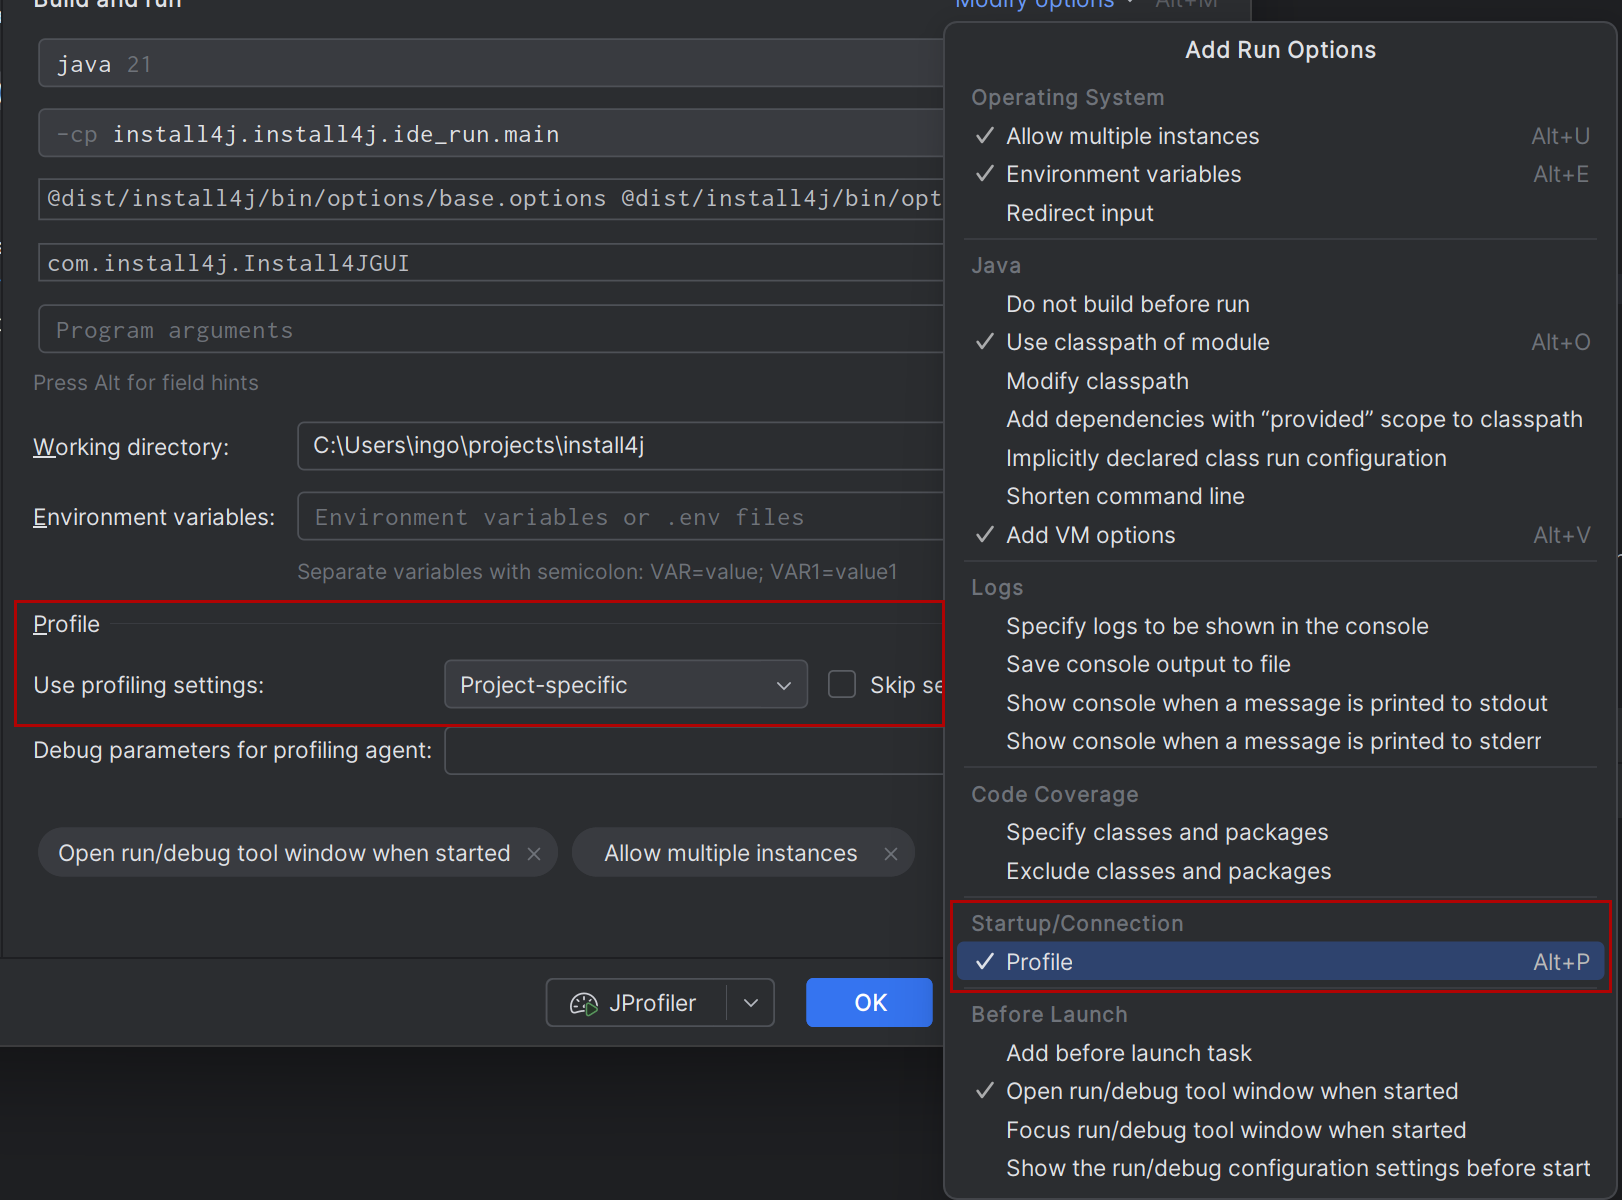
The JProfiler plugin adds additional settings to run configurations which are not immediately visible. To access these settings, select the "Profile" option in the "Modify options" dropdown. All other profiling settings can be configured in the startup dialog of the JProfiler window.
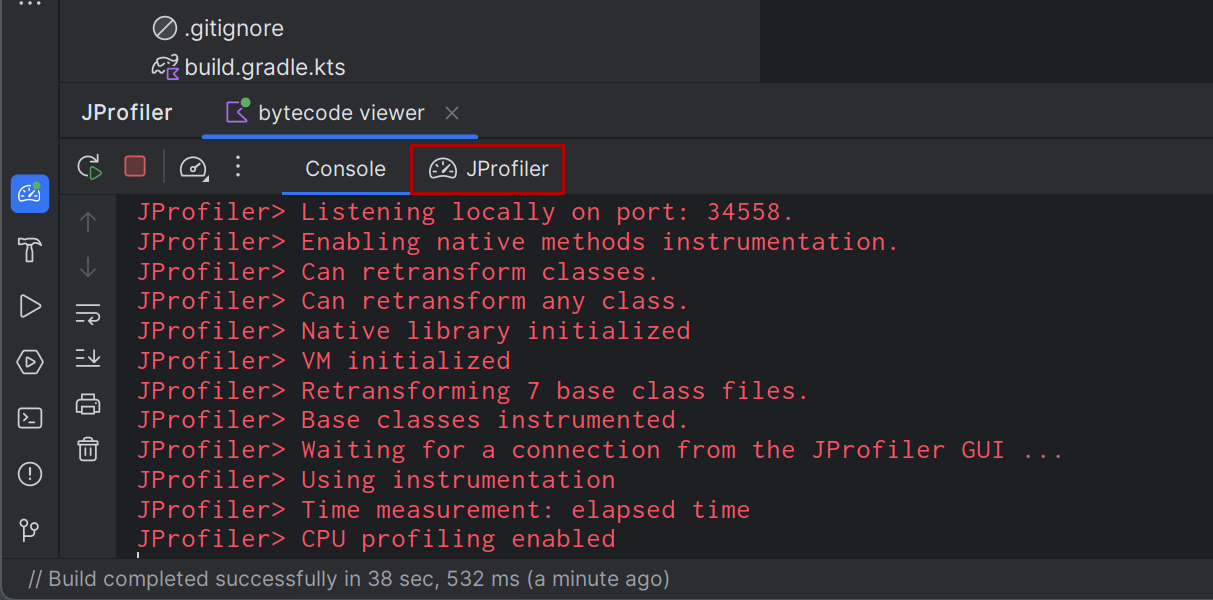
Once the profiling session is started, the output appears in a separate JProfiler tool window. That tool window displays the console output like the regular run tool window, along with a "JProfiler" tab that can be used after you connect with the JProfiler UI:
The JProfiler tool window is also shown when you open a JProfiler snapshot in IntelliJ IDEA or when you attach to a running JVM with the "Attach to JVM with JProfiler" action.
The "JProfiler" tab contains actions to start and stop data recording for CPU data, allocation data and probe events. Additionally, an action allows you to switch to the JProfiler window. The JProfiler window includes a similar action for switching back to the IDEA window so that it becomes convenient to work with the two separate windows. Precise source code navigation from JProfiler into IntelliJ IDEA is implemented for Java and Kotlin.
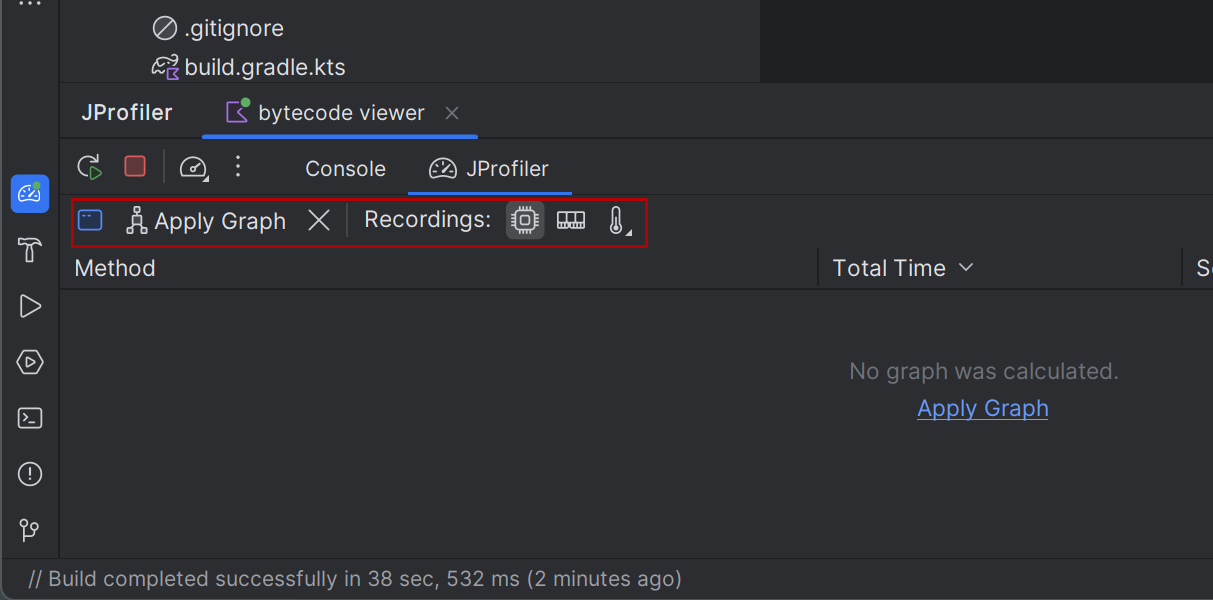
Profiling information is typically displayed in the JProfiler window, but the CPU graph data is also integrated in the IntelliJ IDEA UI because it makes sense to show this data directly in the source code. Use the "Apply graph" action in IntelliJ IDEA or generate a CPU graph in JProfiler to display CPU data within IntelliJ IDEA. To configure advanced parameters like thread selection or to use the call tree root, call tree removal and call tree view filter settings from the call tree view, you should generate the graph in the JProfiler window.
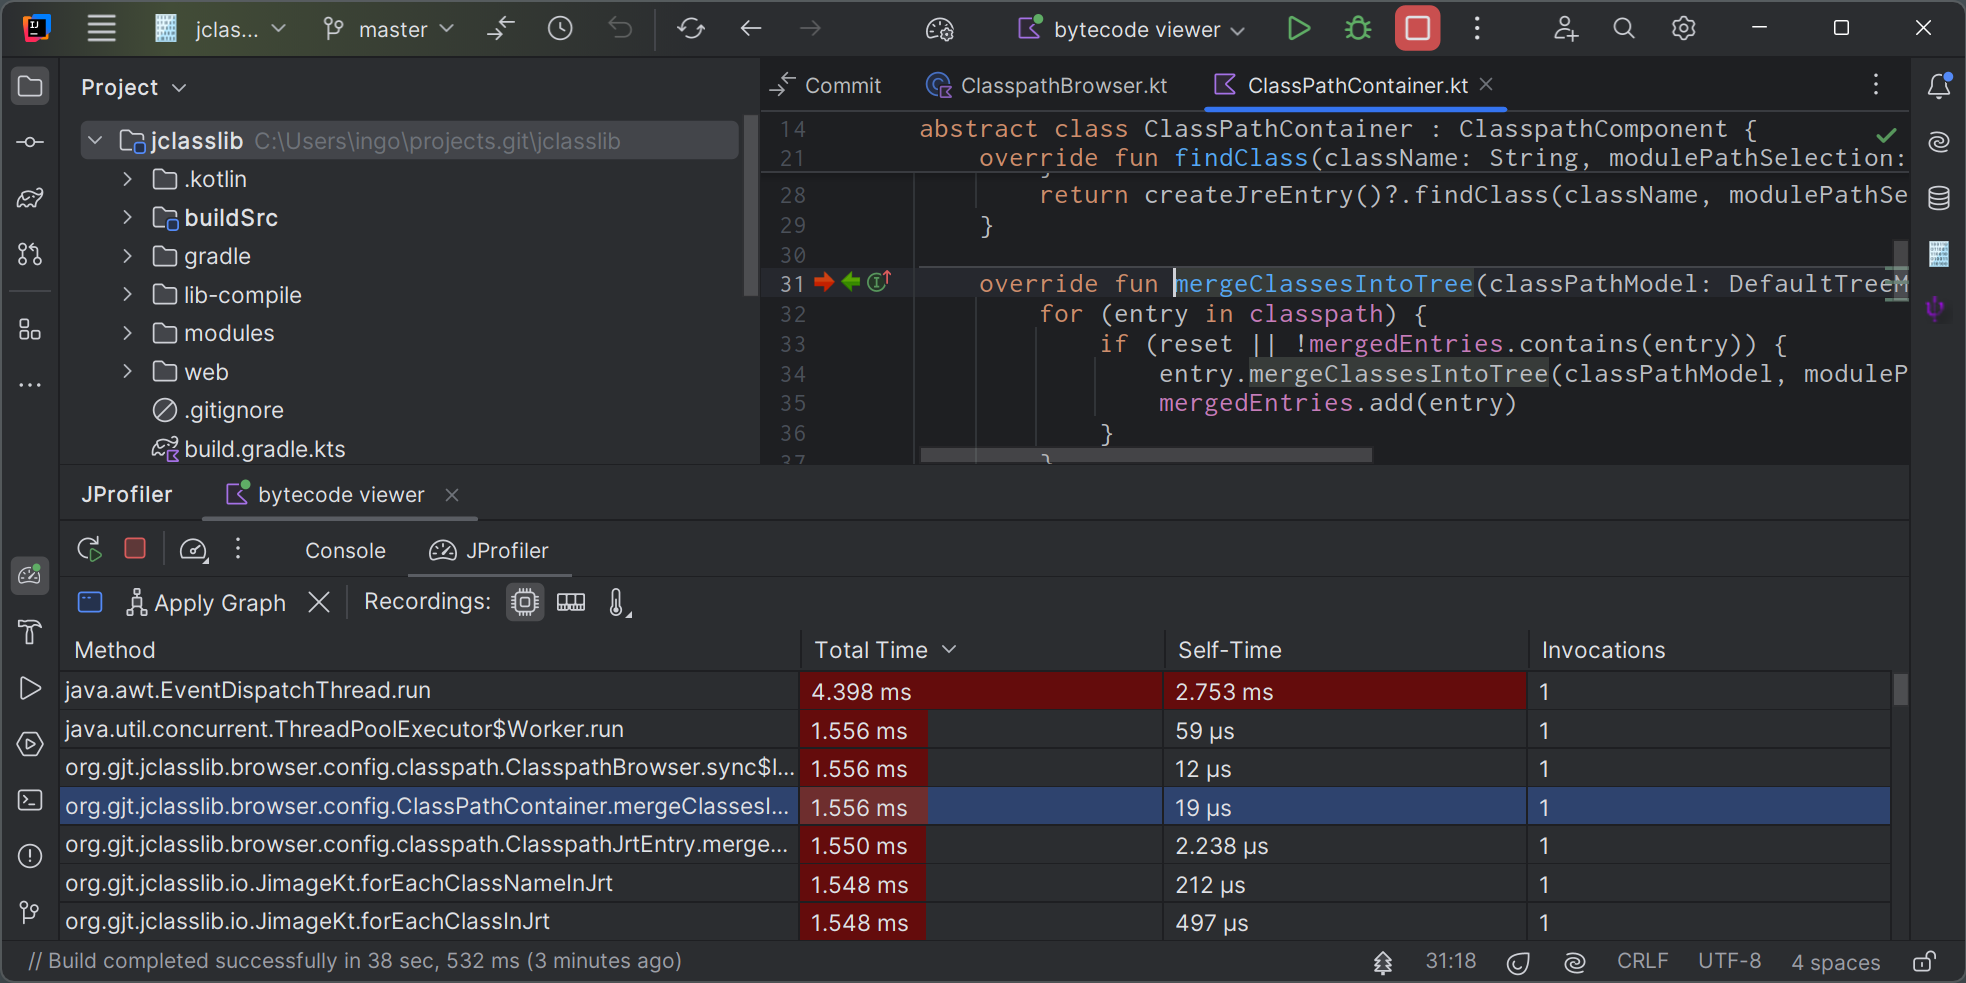
Once the CPU data has been applied, the "JProfiler" tab displays a list of recorded methods. Double-clicking on a method will take you to the source code. In the gutter of the source code editor, arrows for incoming and outgoing calls are added.
Clicking on a gutter icon displays the incoming or outgoing methods in a popup window, along with a bar chart showing the recorded times. Clicking on rows in the popup will navigate to the corresponding methods.
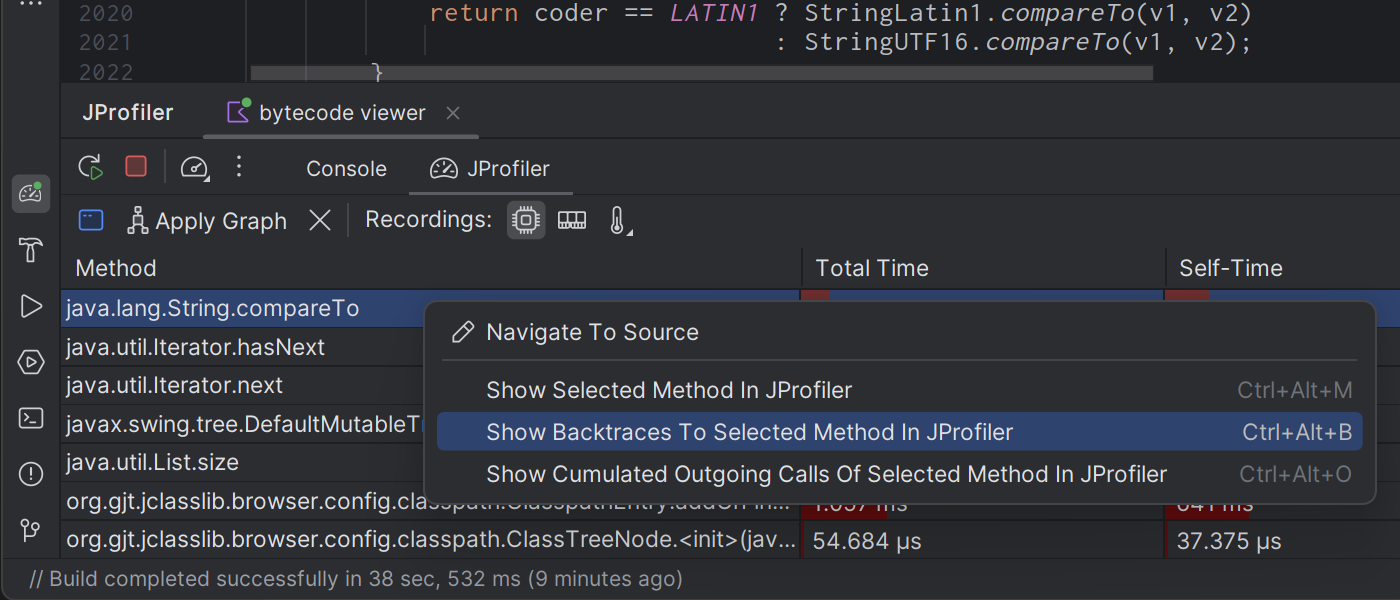
Also, the total recorded time and the invocation count for the target method will be shown at the bottom of the popup. The "Show in JProfiler" drop-down in the bottom-right corner of the popup provides context-dependent navigation actions into the JProfiler UI. You can show the selected node or the corresponding call tree analysis in the method graph. For outgoing calls, the "Cumulated outgoing calls" analysis and for the incoming calls the "Backtraces" analysis is offered.
The same navigation actions are also available in the context menu of the method table in the "JProfiler" tab:
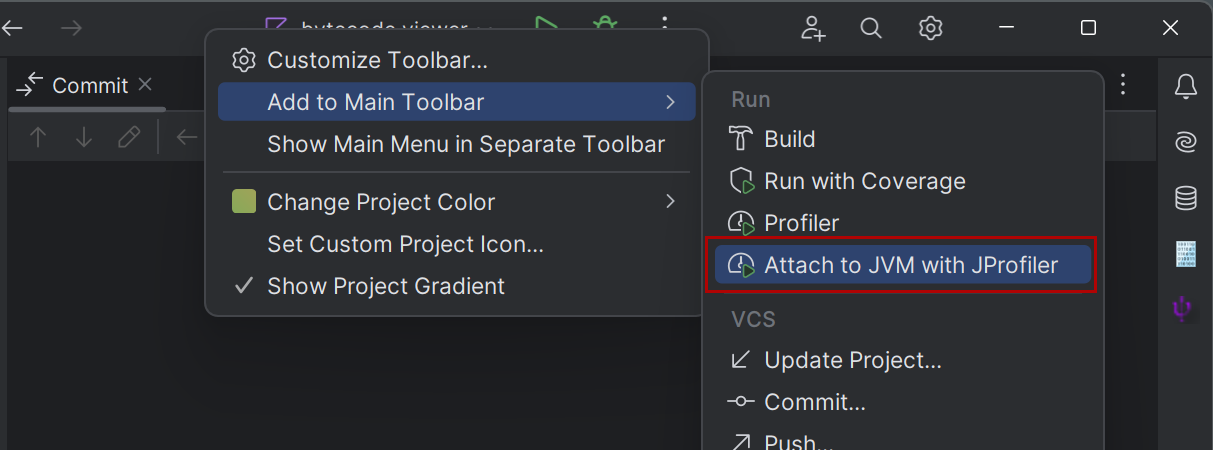
The JProfiler plugin provides a toolbar quick action for the "Attach to JVM with JProfiler" action that you can add to the main toolbar. With that action you can attach to a process that is already running and still get source code navigation from the JProfiler UI into IntelliJ IDEA as well as inline CPU graph data in source code editors:
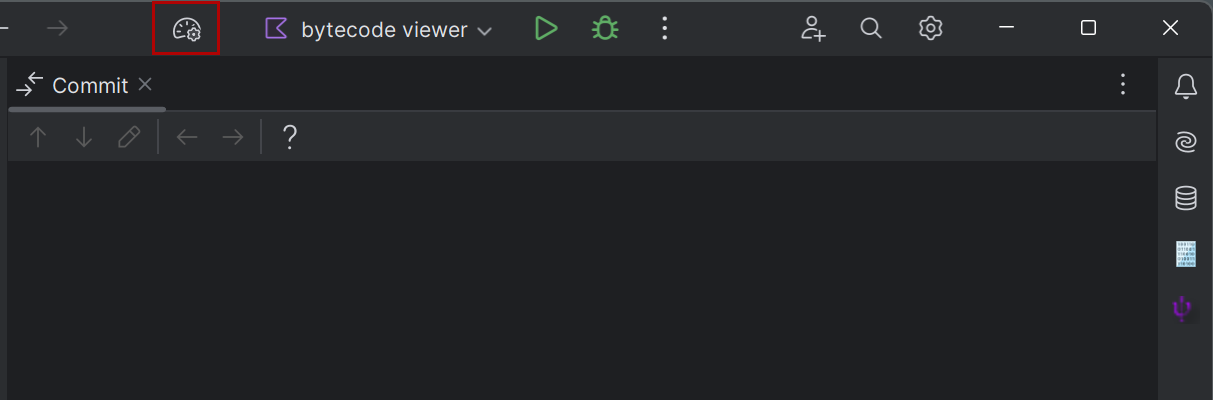
This is how the action button looks once it has been added:
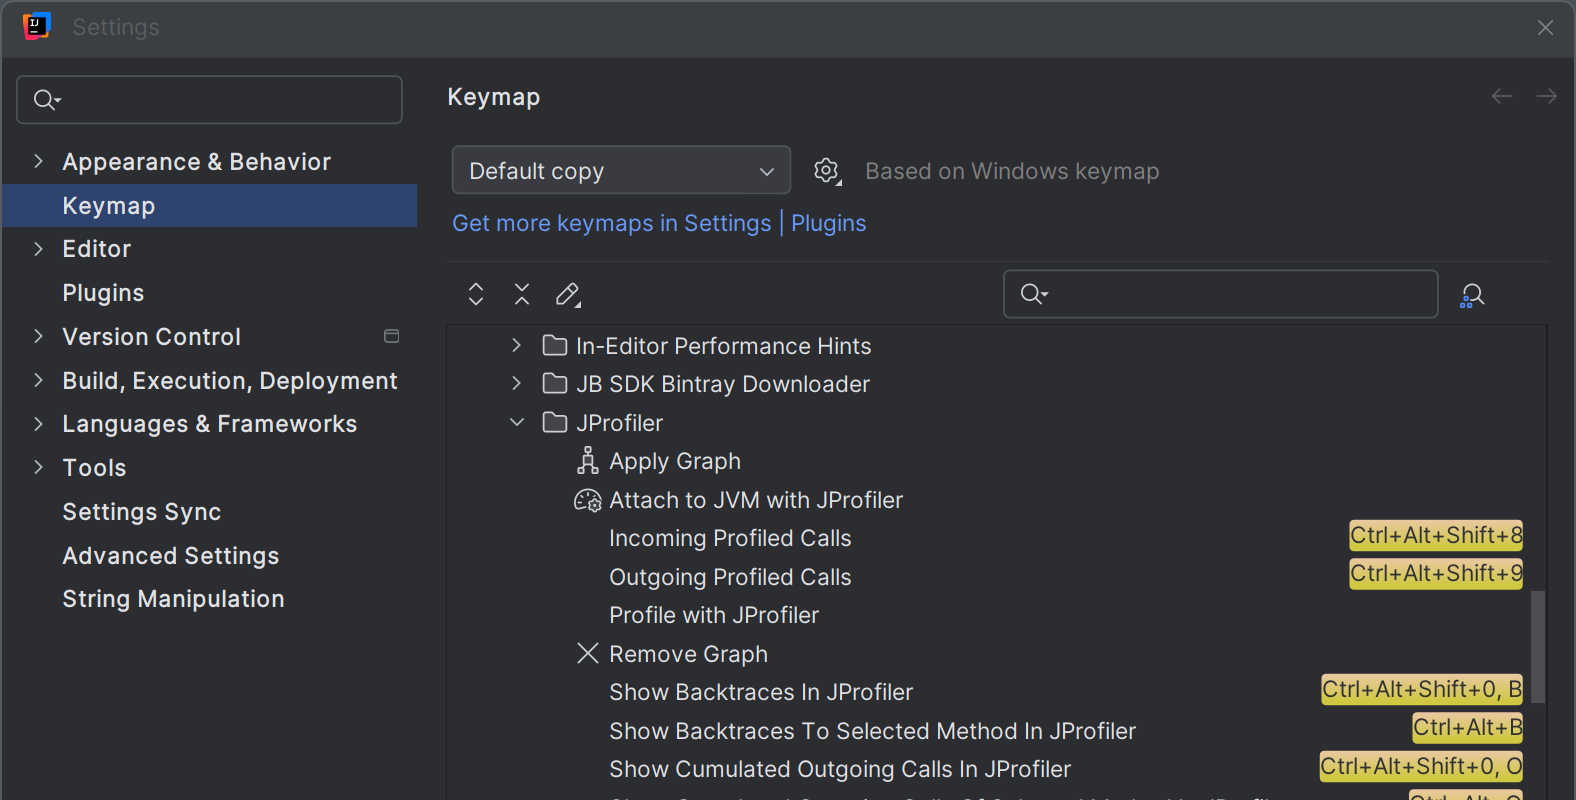
The key bindings for all actions in JProfiler can be customized in the "Keymap" settings in IntelliJ IDEA.
Given the limited availability of non-conflicting keyboard shortcuts, the navigation actions from the source
code editor to the JProfiler UI are chained shortcuts where you first hit Ctrl-Alt-Shift-O and then
another key to select the navigation action. If you frequently use this functionality, you may want to
assign simpler keyboard shortcuts.
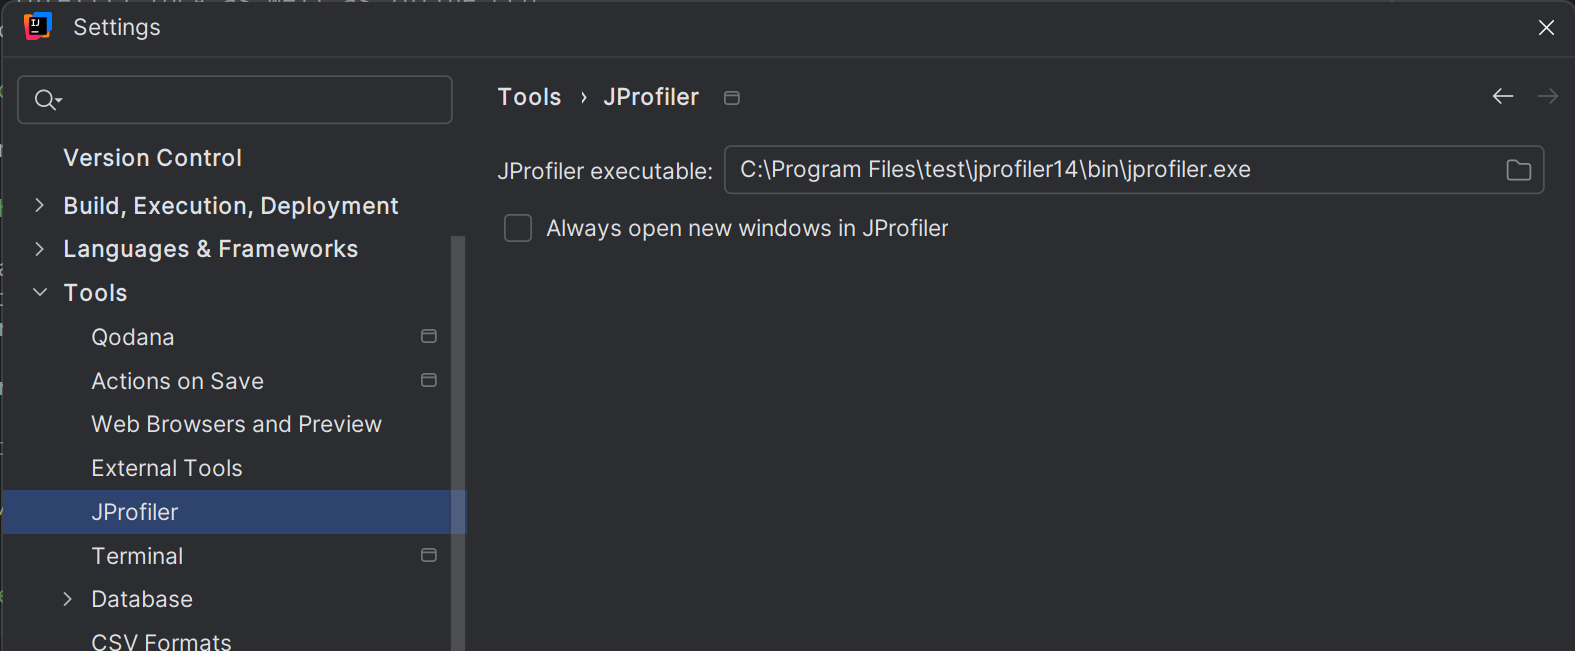
On the Tools->JProfiler page of the IDE settings, you can adjust the used JProfiler executable and whether you always want to open a new window in JProfiler for new profiling sessions.
Eclipse integration
The Eclipse plugin can profile most common launch configuration types including test run configurations and WTP run configurations. The Eclipse plugin only works with the full Eclipse SDKs and not with partial installations of the Eclipse framework.
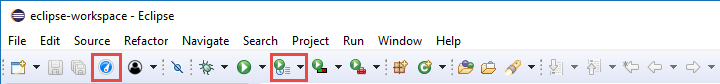
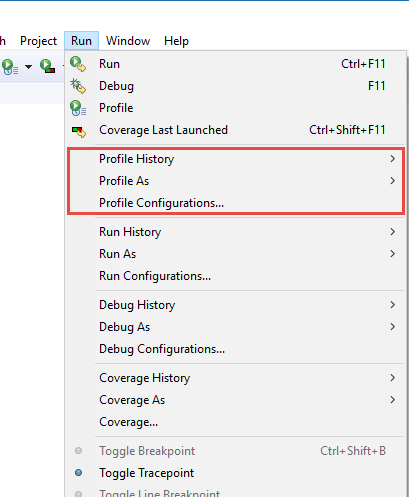
To profile your application from Eclipse, choose one of the profiling commands in the Run menu or click on the corresponding toolbar button. The profile commands are equivalent to the debug and run commands in Eclipse and are part of Eclipse's infrastructure, except for the Run→Attach JProfiler to JVM menu item which is added by the JProfiler plugin.
If the menu item Run→Profile ... does not exist in the Java perspective, enable the "Profile" actions for this perspective under Window→Perspective→Customize Perspective by bringing the Action Set Availability tab to front and selecting the Profile checkbox.
Several JProfiler-related settings including the location of the JProfiler executable can be adjusted in Eclipse under Window→Preferences→JProfiler.
VS Code integration
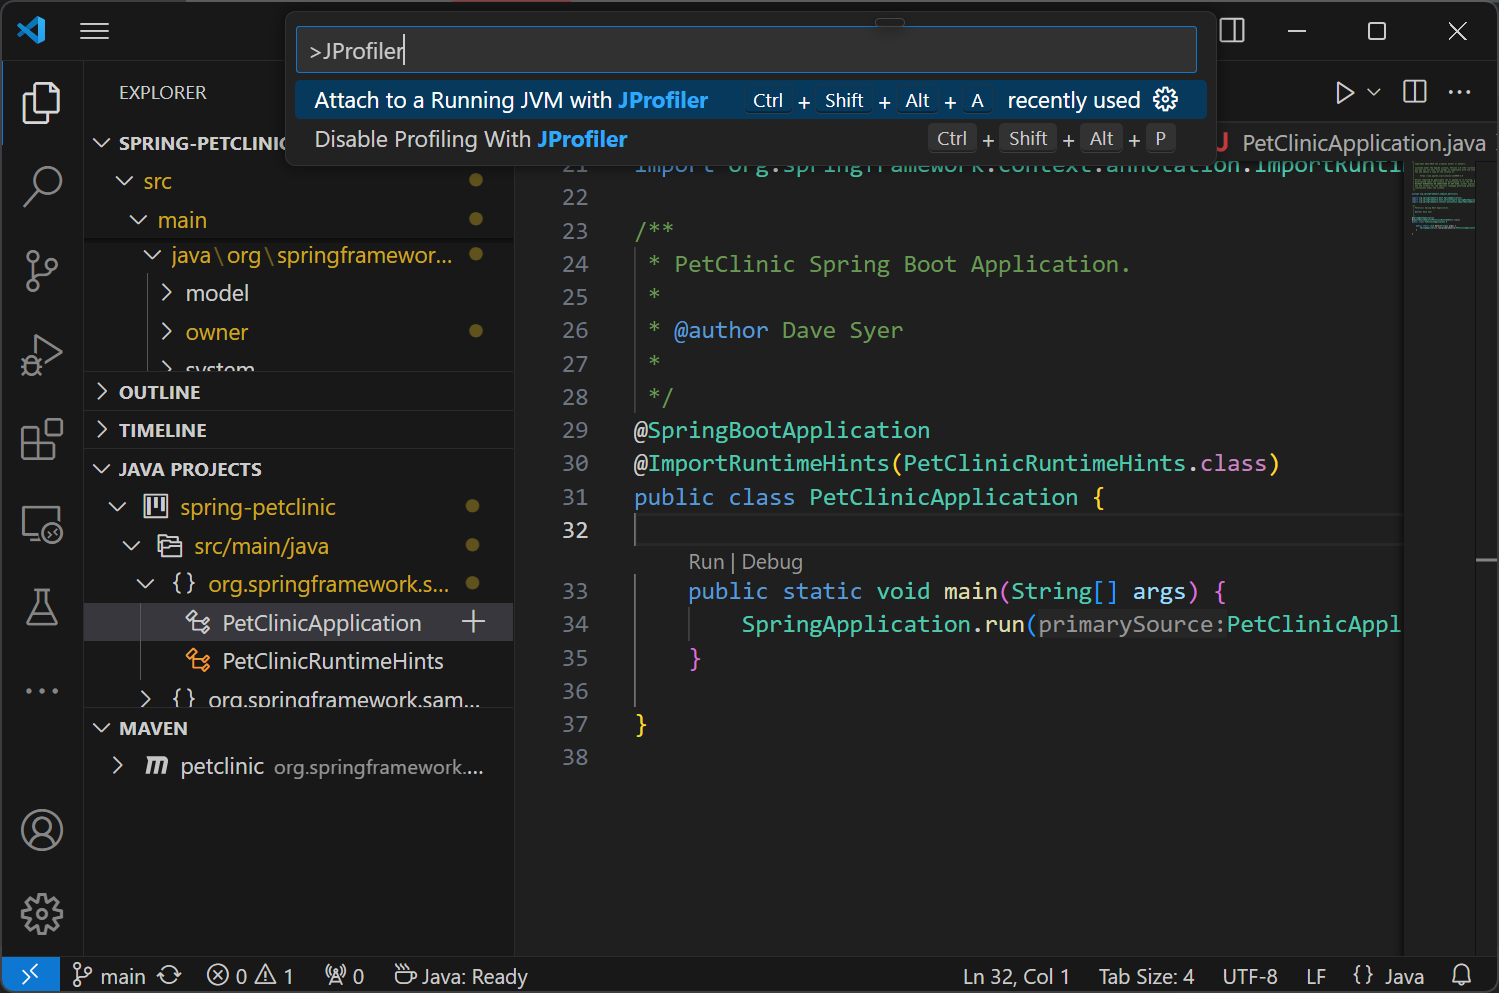
The VS Code extension adds an action Enable Profiling with JProfiler. When invoked, the debug and
run actions will start profiling for Java launch configurations. JProfiler will be started,
and the session startup dialog where you can configure profiling settings. The application
will be started after the session startup dialog is confirmed.
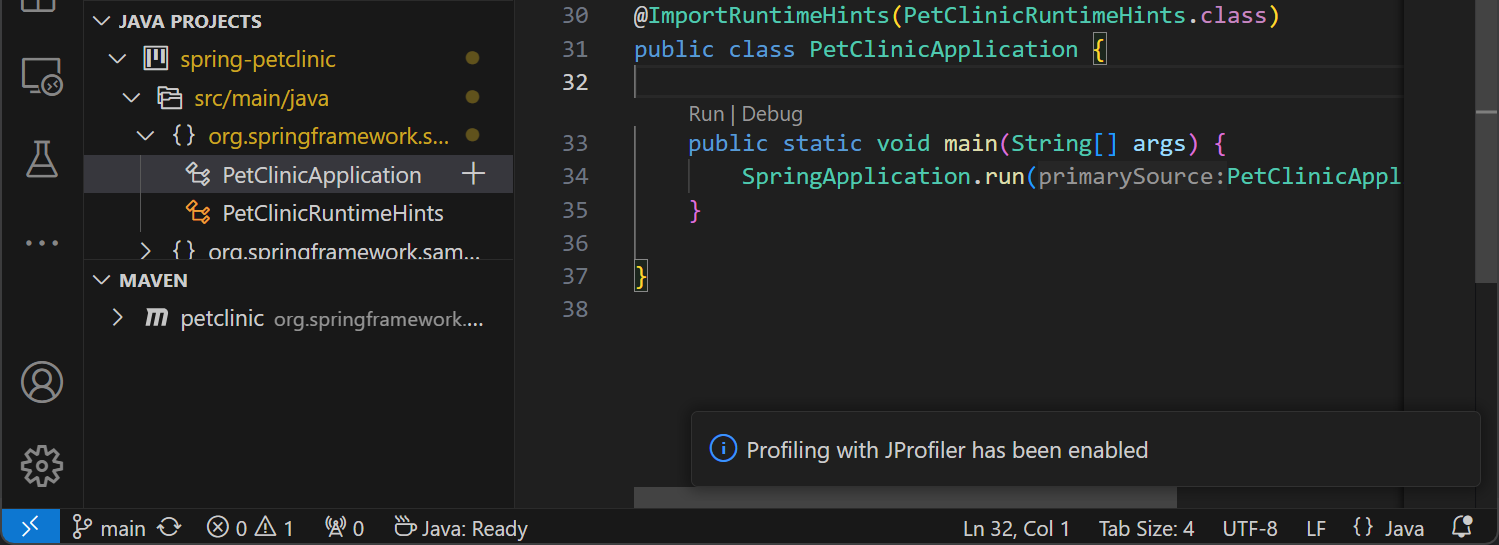
With the Disable Profiling with JProfiler action, the default behavior for run and debug
actions is restored. Notifications about the changes in the profiling mode are shown in
VS Code as toast messages in the bottom-right corner of the editor.
Both Enable Profiling with JProfiler and Disable Profiling with JProfiler
have the same default keybinding, so it can be used to toggle the profiling mode.
To profile an already running JVM, use the Attach to a Running JVM with JProfiler action.
Source navigation actions in JProfiler will show the corresponding source code in VS Code. To get source navigation into VS Code for a JProfiler snapshot, open the snapshot from within VS Code with File→Open.
NetBeans integration
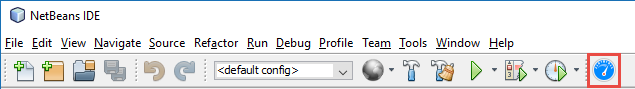
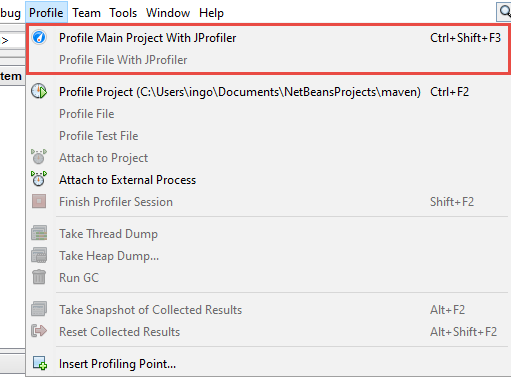
In NetBeans, you can profile standard, free-form and Maven projects that use the exec Maven plugin. To profile your application from NetBeans, choose one of the profiling commands in the Run menu or click on the corresponding toolbar button. For Maven projects that start an application in another way and for Gradle projects, start the project normally and use the Profile→Attach JProfiler To A Running JVM action in the menu.
For free-form projects, you have to debug your application once before trying to profile it, because the
required file nbproject/ide-targets.xml is set up by the debug action. JProfiler will add a
target named "profile-jprofiler" to it with the same contents as the debug target and will try to modify
the VM parameters as needed. If you have problems profiling a free form project, check the
implementation of this target.
You can profile web applications with the integrated Tomcat or with any other Tomcat server configured in NetBeans. When your main project is a web project, selecting Profile main project with JProfiler starts the Tomcat server with profiling enabled.
If you use NetBeans with the bundled GlassFish Server and your main project is set up to use a GlassFish Server, selecting Profile main project with JProfiler starts the application server with profiling enabled.
The location of the JProfiler executable and the policy for opening new JProfiler windows can be adjusted under Miscellaneous→JProfiler in the options dialog.