In some situations, it's not the average invocation time of a method that is a problem, but rather that a method misbehaves every once in a while. In the call tree, all method invocations are cumulated, so a frequently called method that takes 100 times as long as expected once every 10000 invocations will not leave a distinct mark in the total times.
To tackle this problem, JProfiler offers the outlier detection view and the exceptional method recording feature in the call tree.
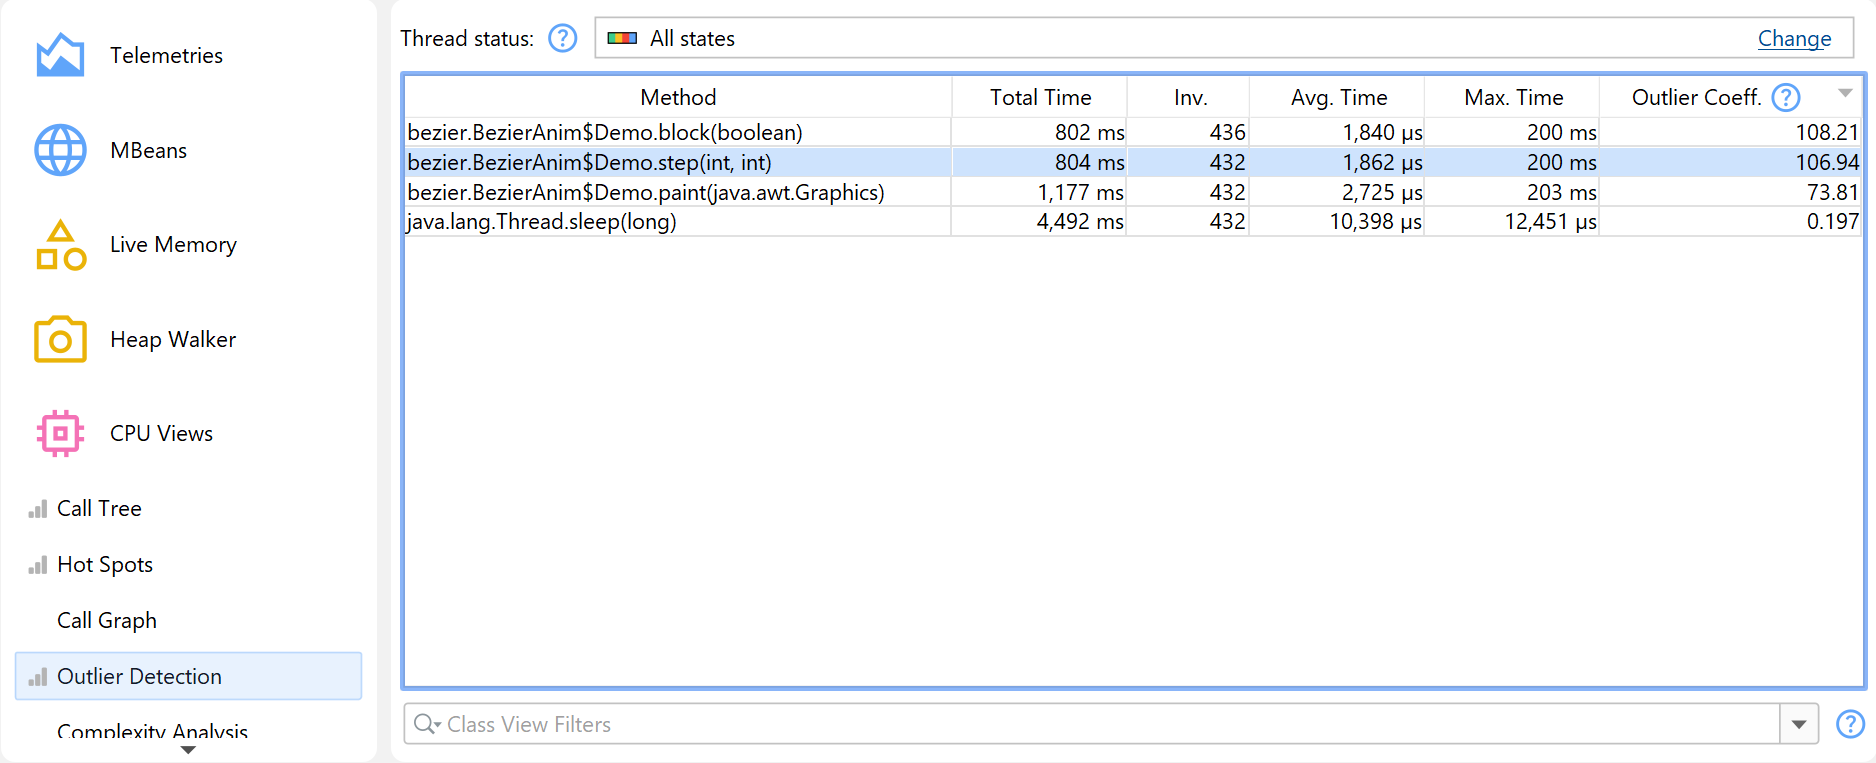
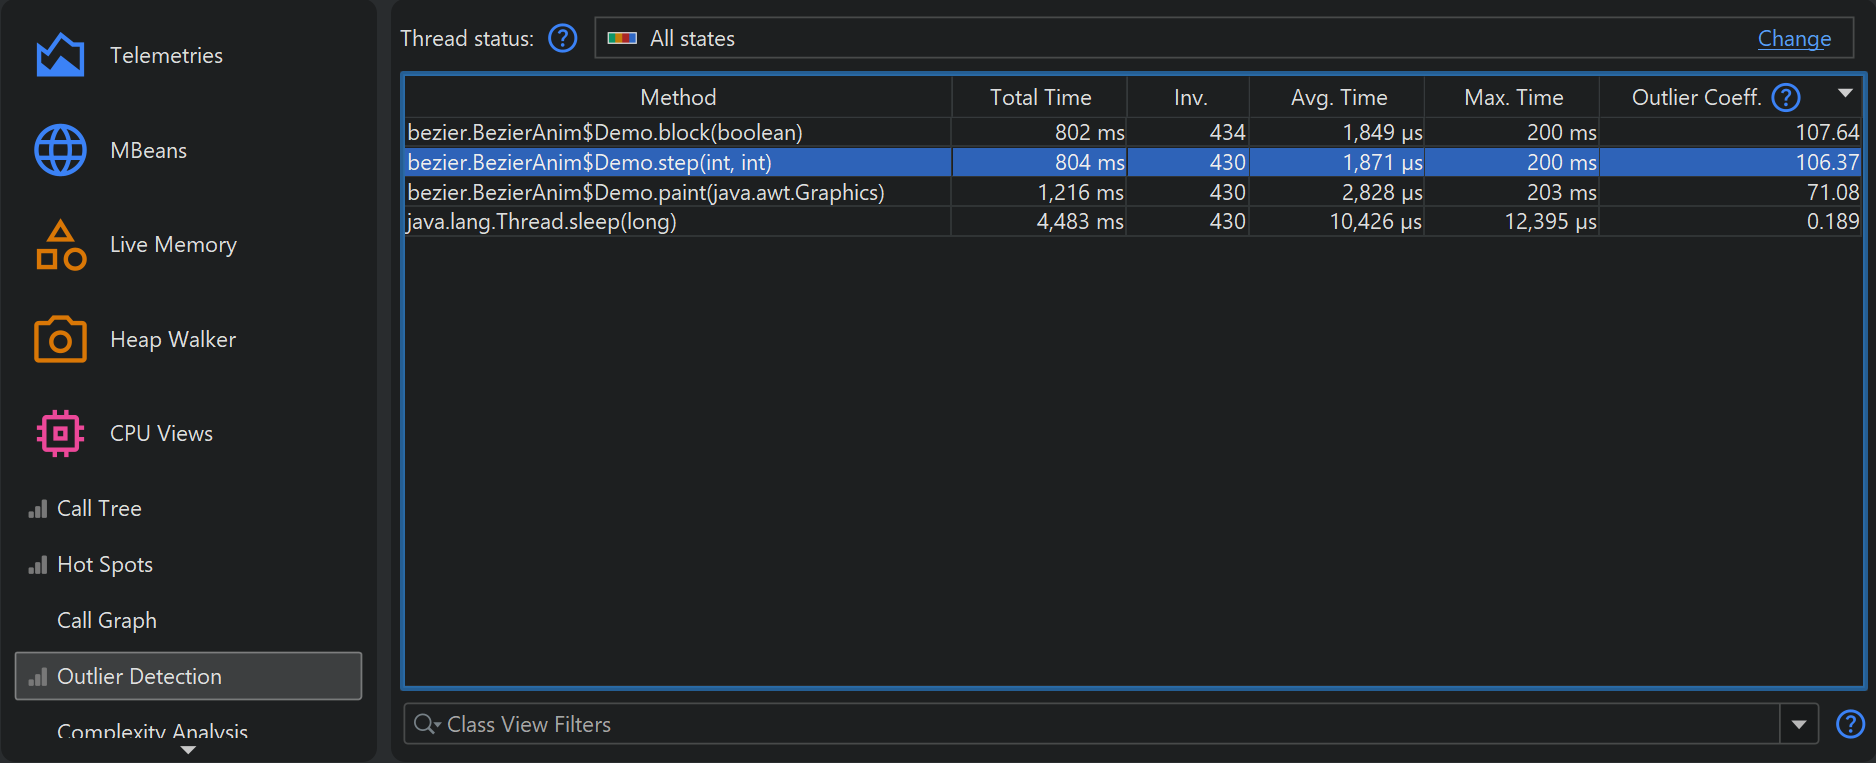
Outlier detection view
The outlier detection view shows information about the call durations and invocation counts of each method together with the maximum time that was measured for a single call. The deviation of the maximum call time from the average time shows whether all call durations are in a narrow range or if there are significant outliers. The outlier coefficient that is calculated as
(maximum time - average time) / average time
can help you to quantify methods in this respect. By default, the table is sorted such that the methods with the highest outlier coefficient are at the top. Data in the outlier detection view is available if CPU data has been recorded.
To avoid excessive clutter from methods that are only called a few times and from methods that are extremely short running, lower thresholds for the maximum time and the invocation count can be set in the view settings. By default, only methods with a maximum time of more than 10 ms and an invocation count greater than 10 are shown in the outlier statistics.
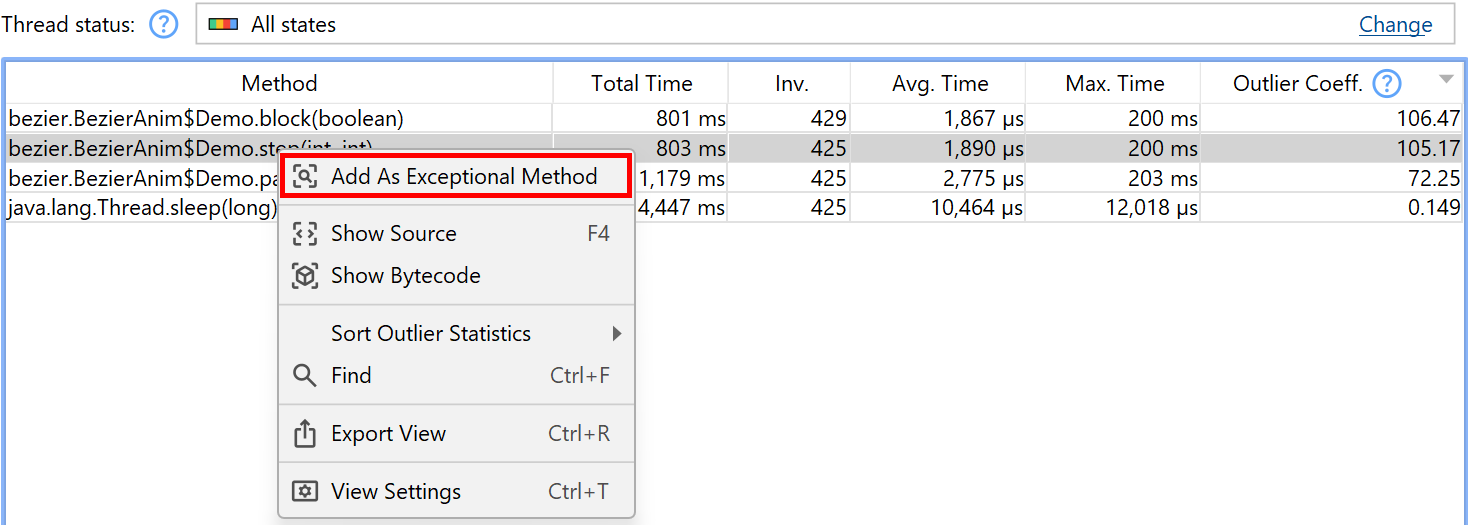
Configuring exceptional method recording
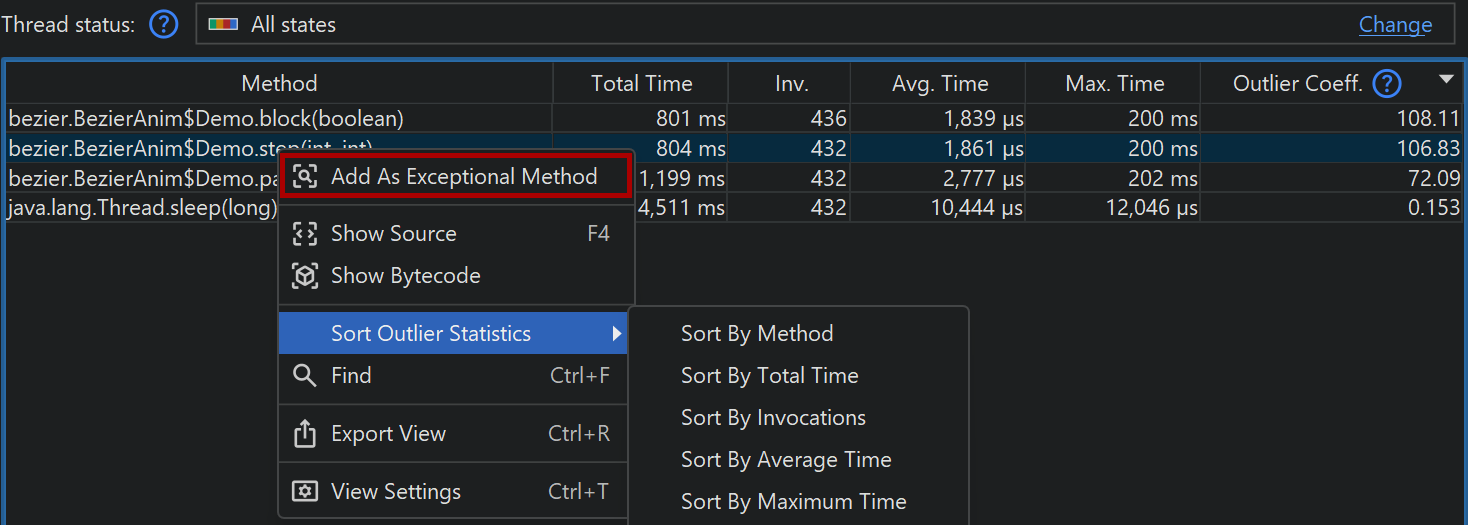
Once you have identified a method that suffers from exceptional call durations, you can add it as an exceptional method in the context menu. The same context menu action is also available in the call tree view.
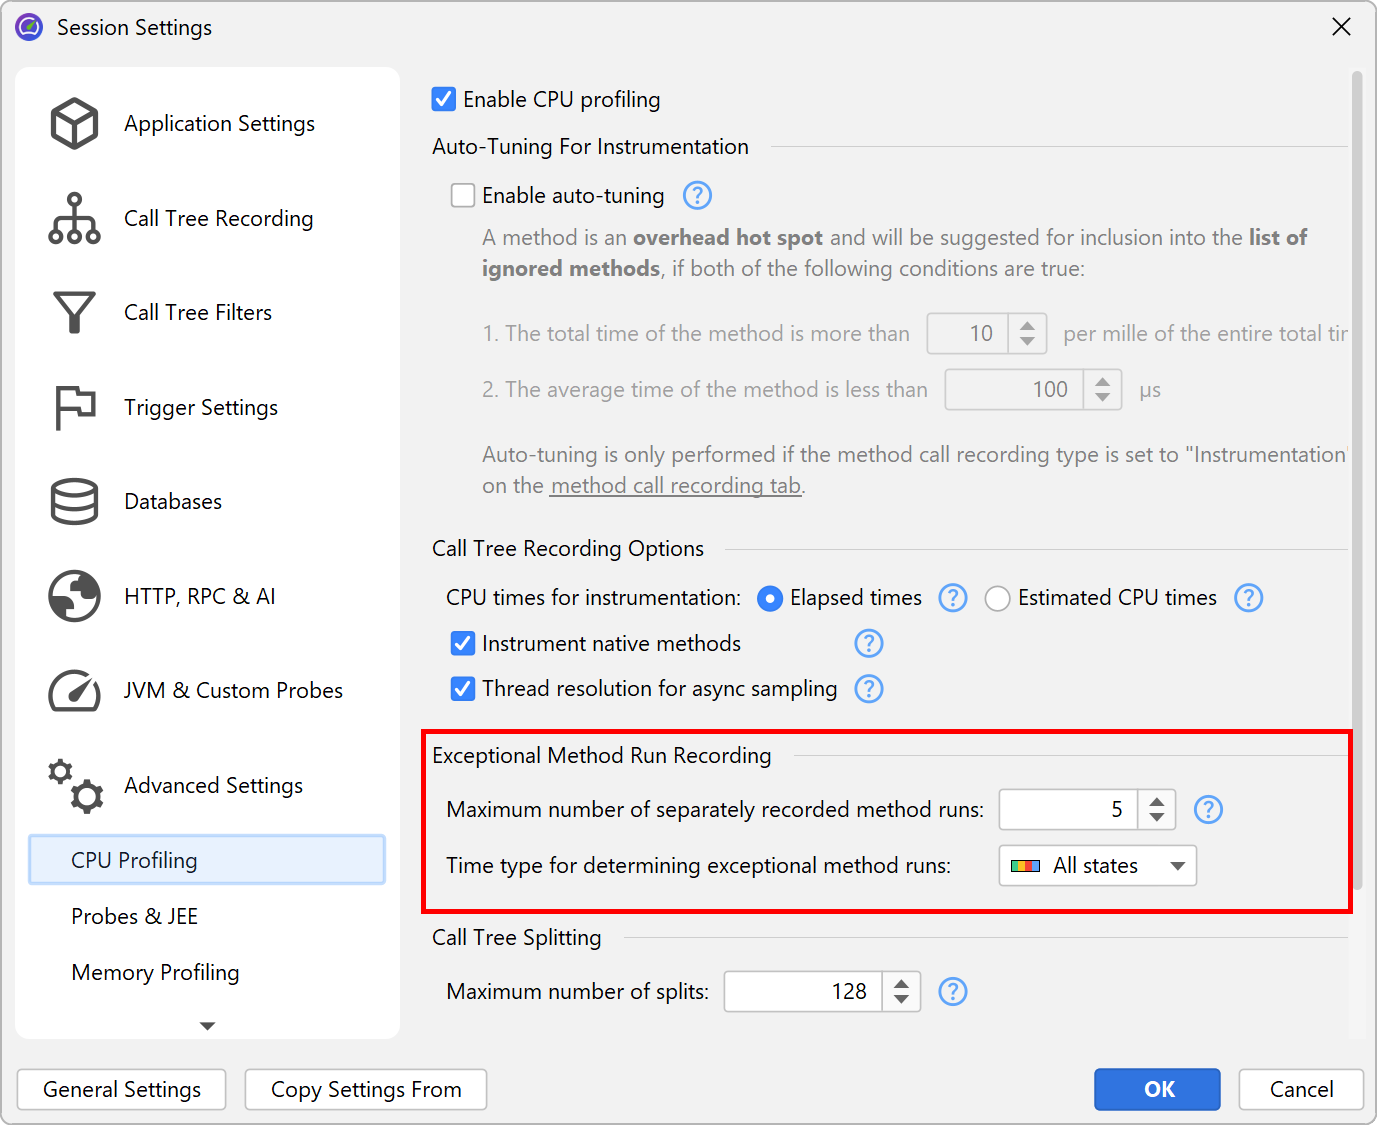
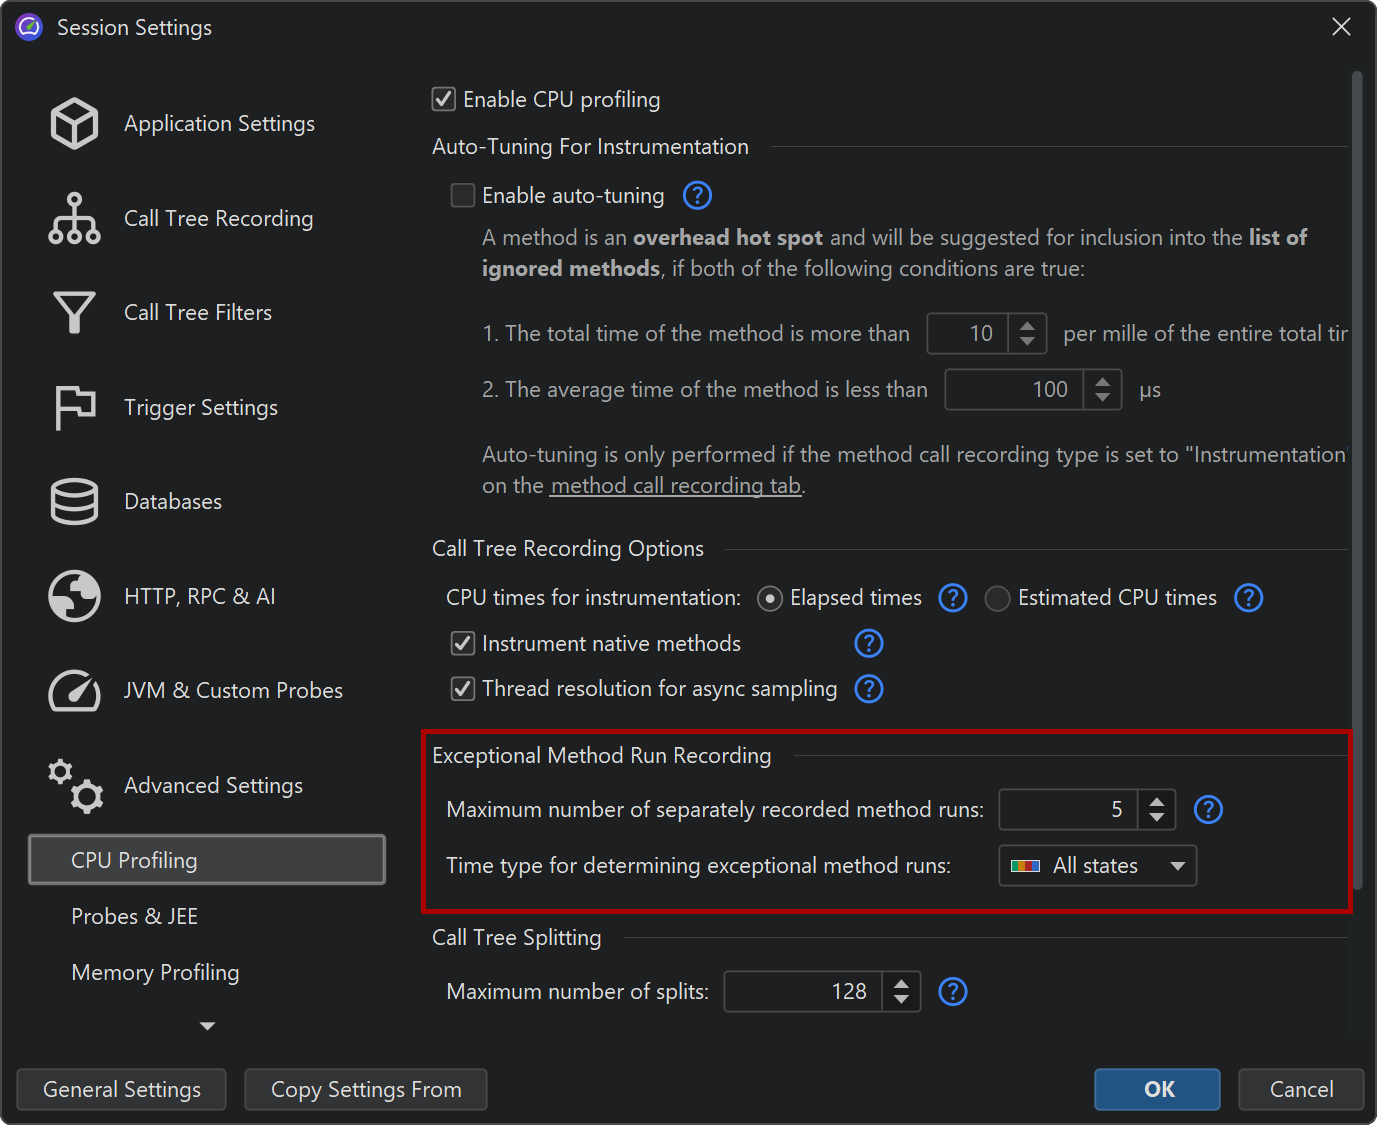
When you register a method for exceptional method recording, a few of the slowest invocations will be retained separately in the call tree. The other invocations will be merged into a single method node as usual. The number of separately retained invocations can be configured in the profiling settings. By default, it is set to 5.
When discriminating slow method invocations, a certain thread state has to be used for the time measurement. This cannot be the thread status selection in the CPU views, because that is just a display option and not a recording option. By default, the wall clock time is used, but a different thread status can be configured in the profiling settings. The same thread state is used for the outlier detection view.
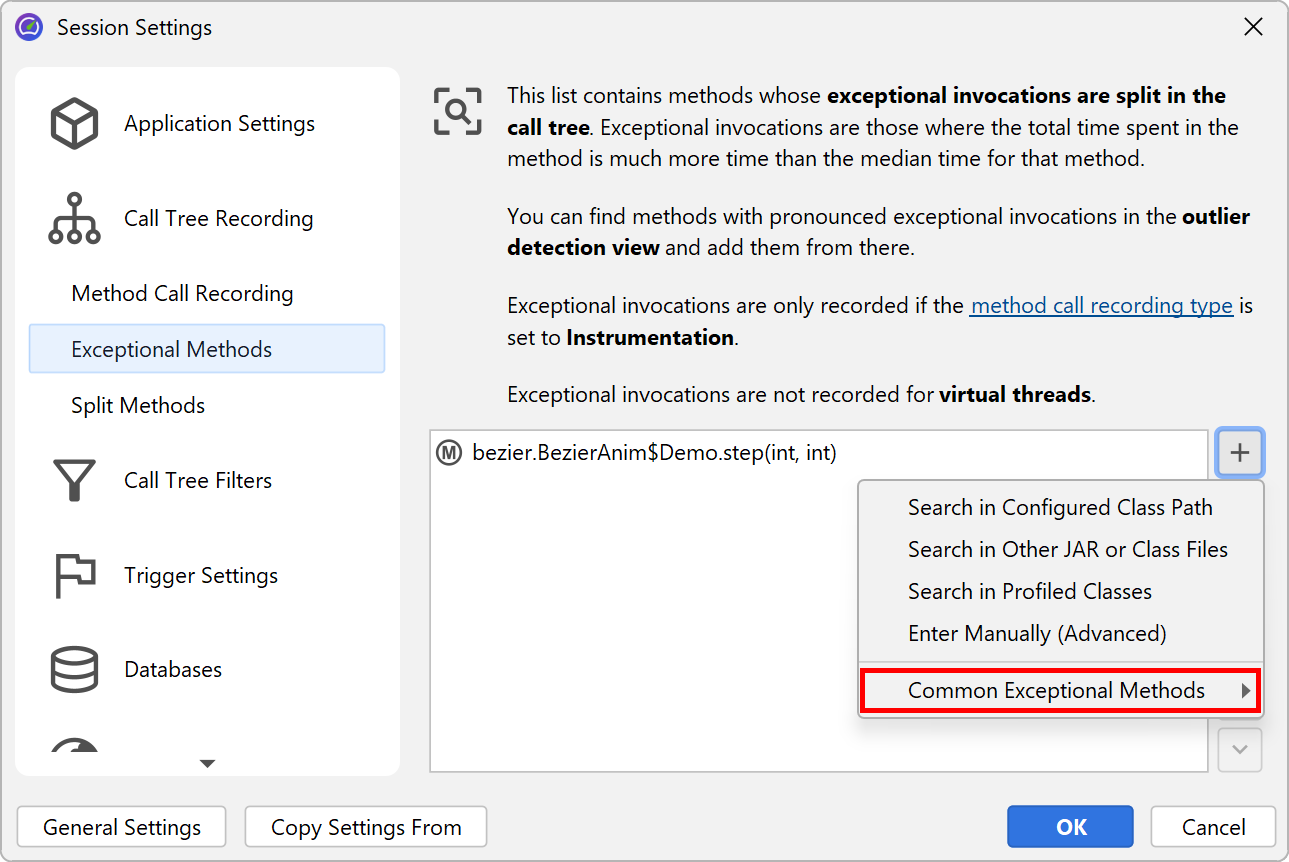
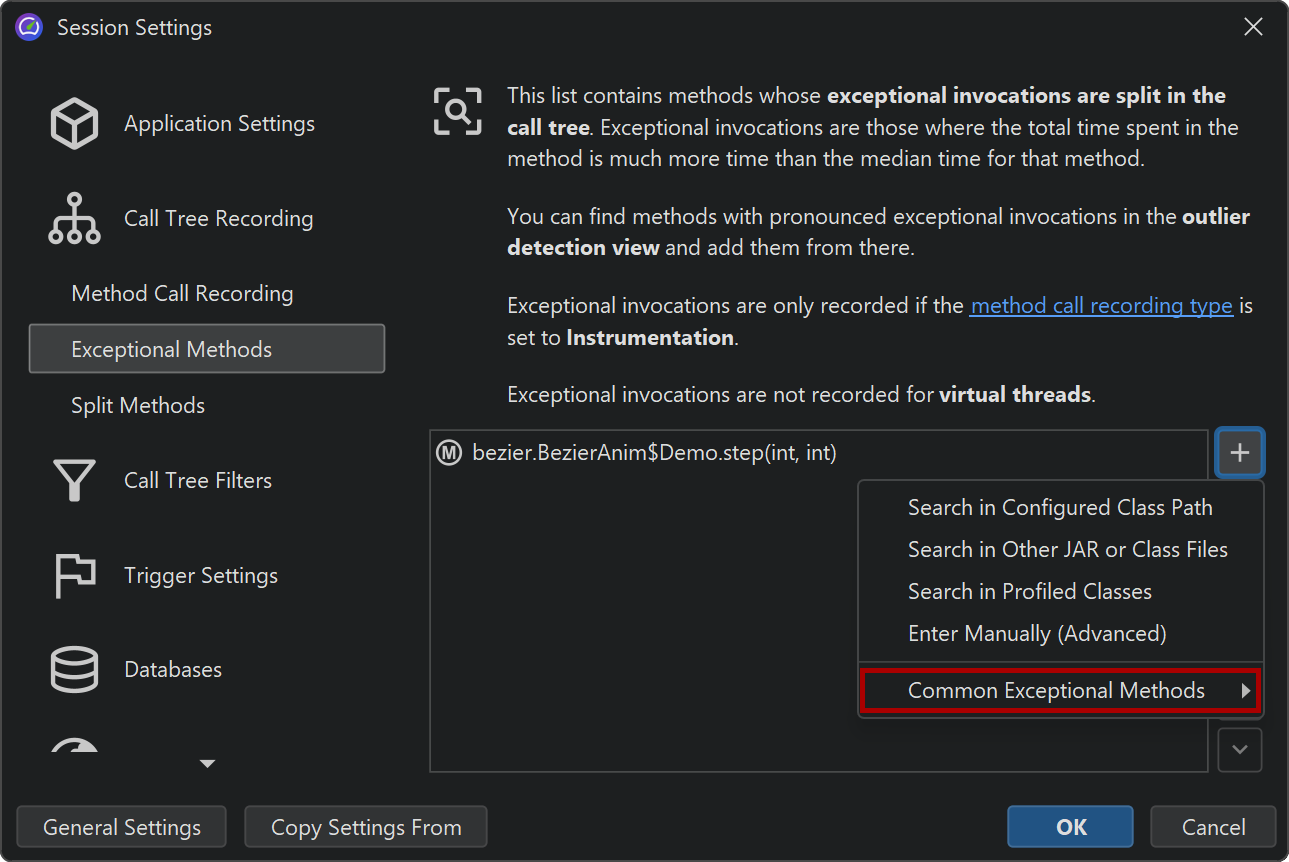
In the session settings, you can remove exceptional methods or add new ones without the context of the call tree or the outlier detection view. Also, the exceptional method configuration provides the option to add exceptional method definitions for well-known systems, like the AWT and JavaFX event dispatch mechanisms where exceptionally long-running events are a major problem.
Exceptional methods in the call tree
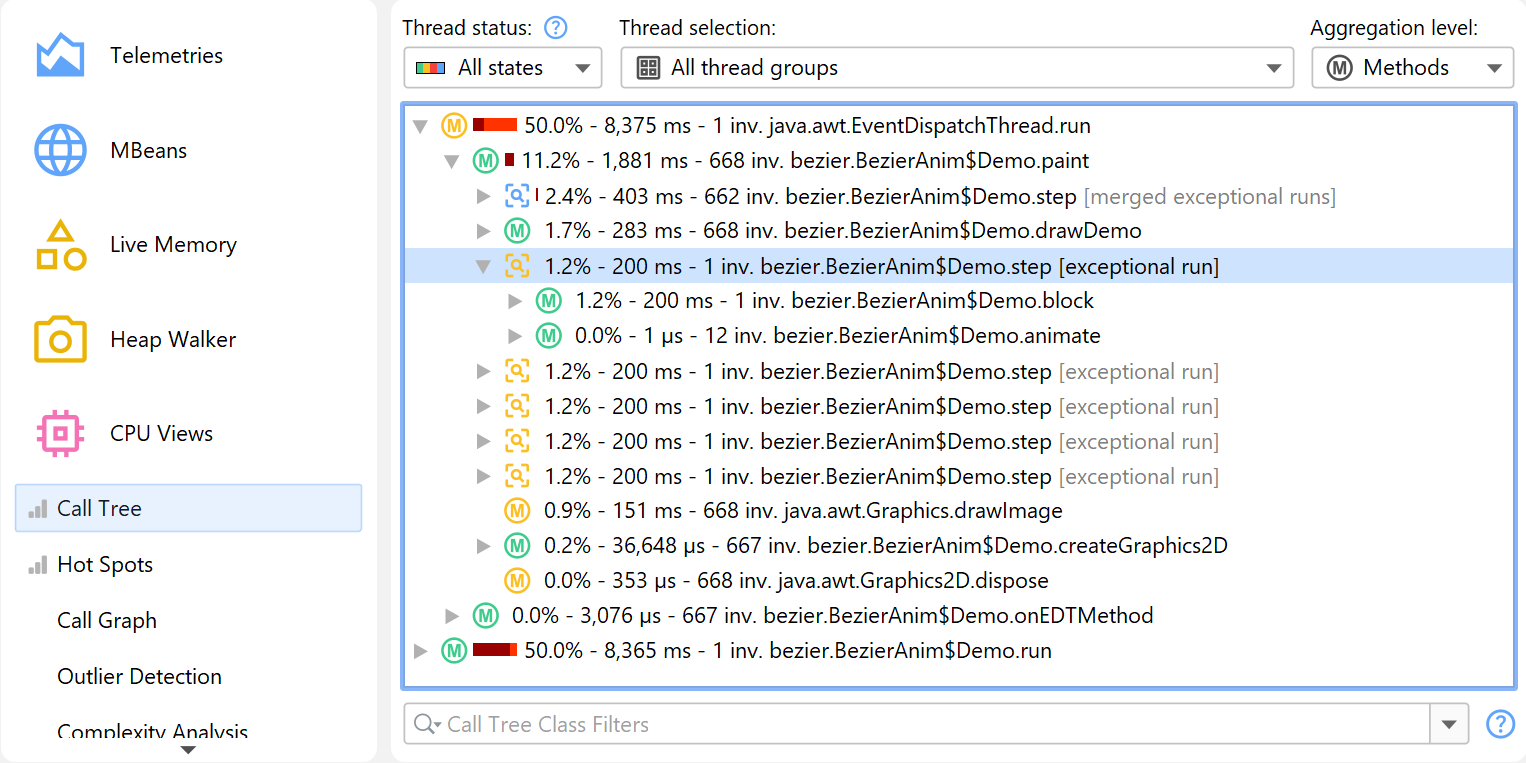
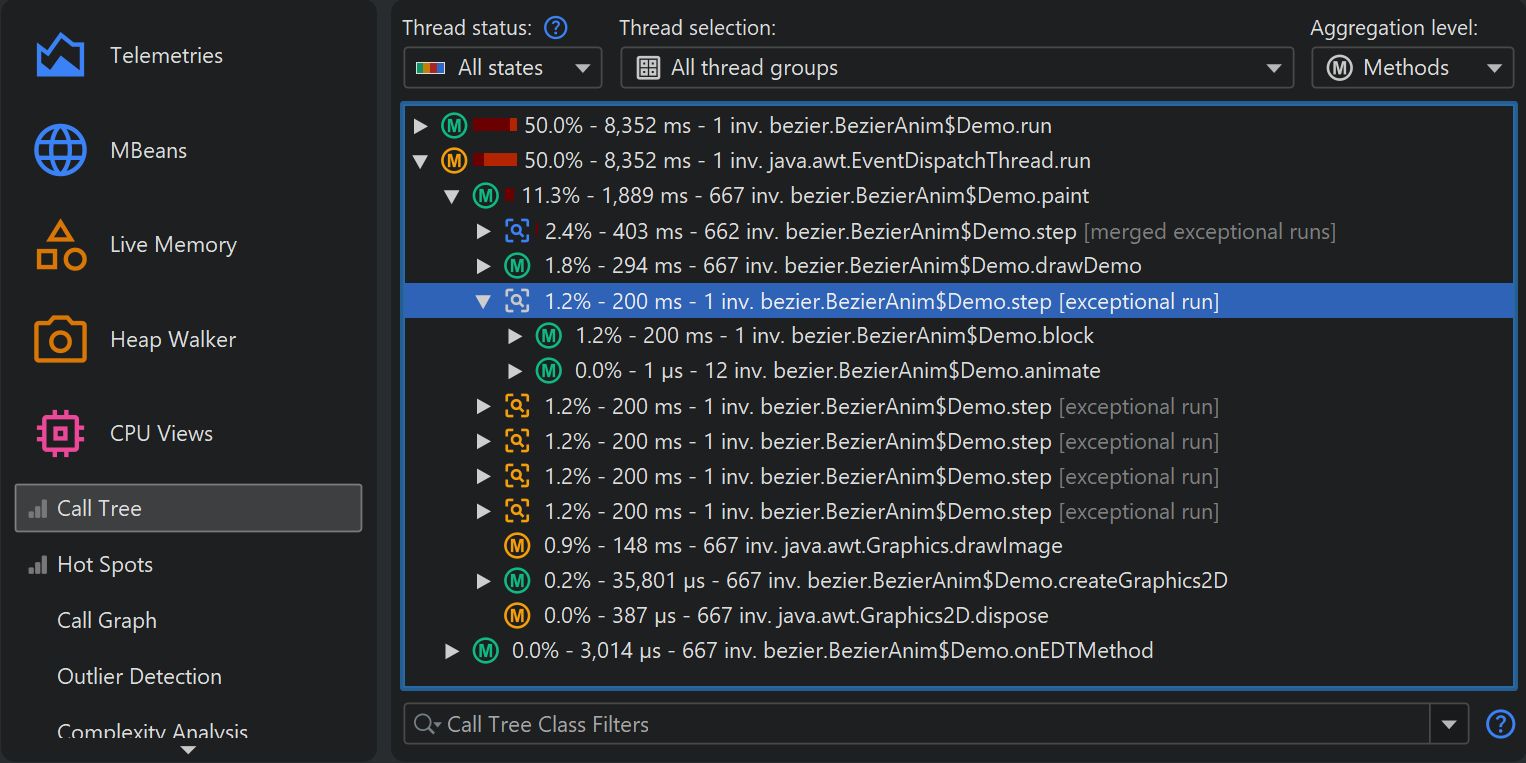
Exceptional method runs are displayed differently in the call tree view.
The split method nodes have modified icons and show additional text:
-
[exceptional run]
Such a node contains an exceptionally slow method run. By definition, it will have an invocation count of one. If many other method runs are slower later on, this node may disappear and be added to the "merged exceptional runs" node depending on the configured maximum number of separately recorded method runs. -
[merged exceptional runs]
Method invocations that do not qualify as exceptionally slow are merged into this node. For any call stack, there can only be one such node per exceptional method. -
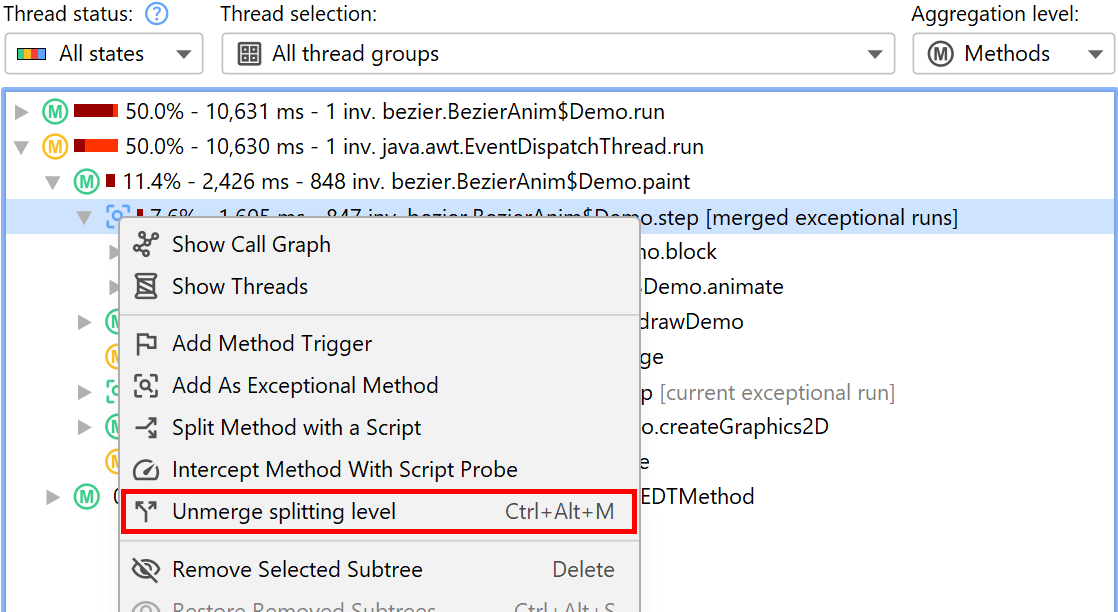
[current exceptional run]
If an invocation was in progress while the call tree view was transmitted to the JProfiler GUI, it was not yet known whether the invocation was exceptionally slow or not. The "current exceptional run" shows the separately maintained tree for the current invocation. After the invocation completes, it will either be maintained as a separate "exceptional run" node or be merged into the "merged exceptional runs" node.
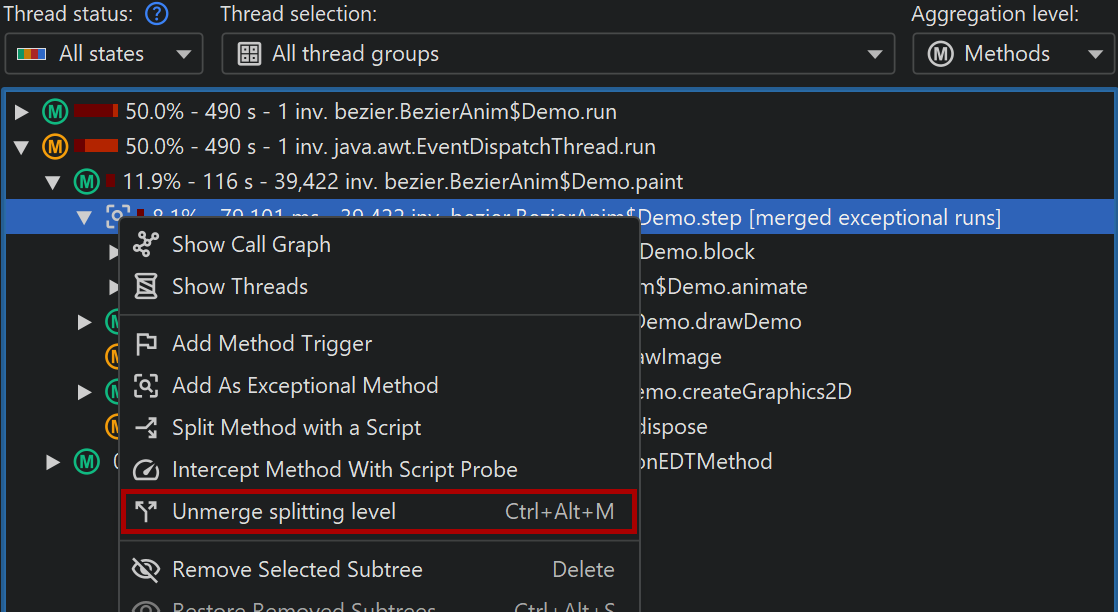
Like for call tree splitting by probes and split methods, an exceptional method node has a Merge Splitting Level action in the context menu that lets you merge and unmerge all invocations on the fly.