为什么选择 JProfiler?
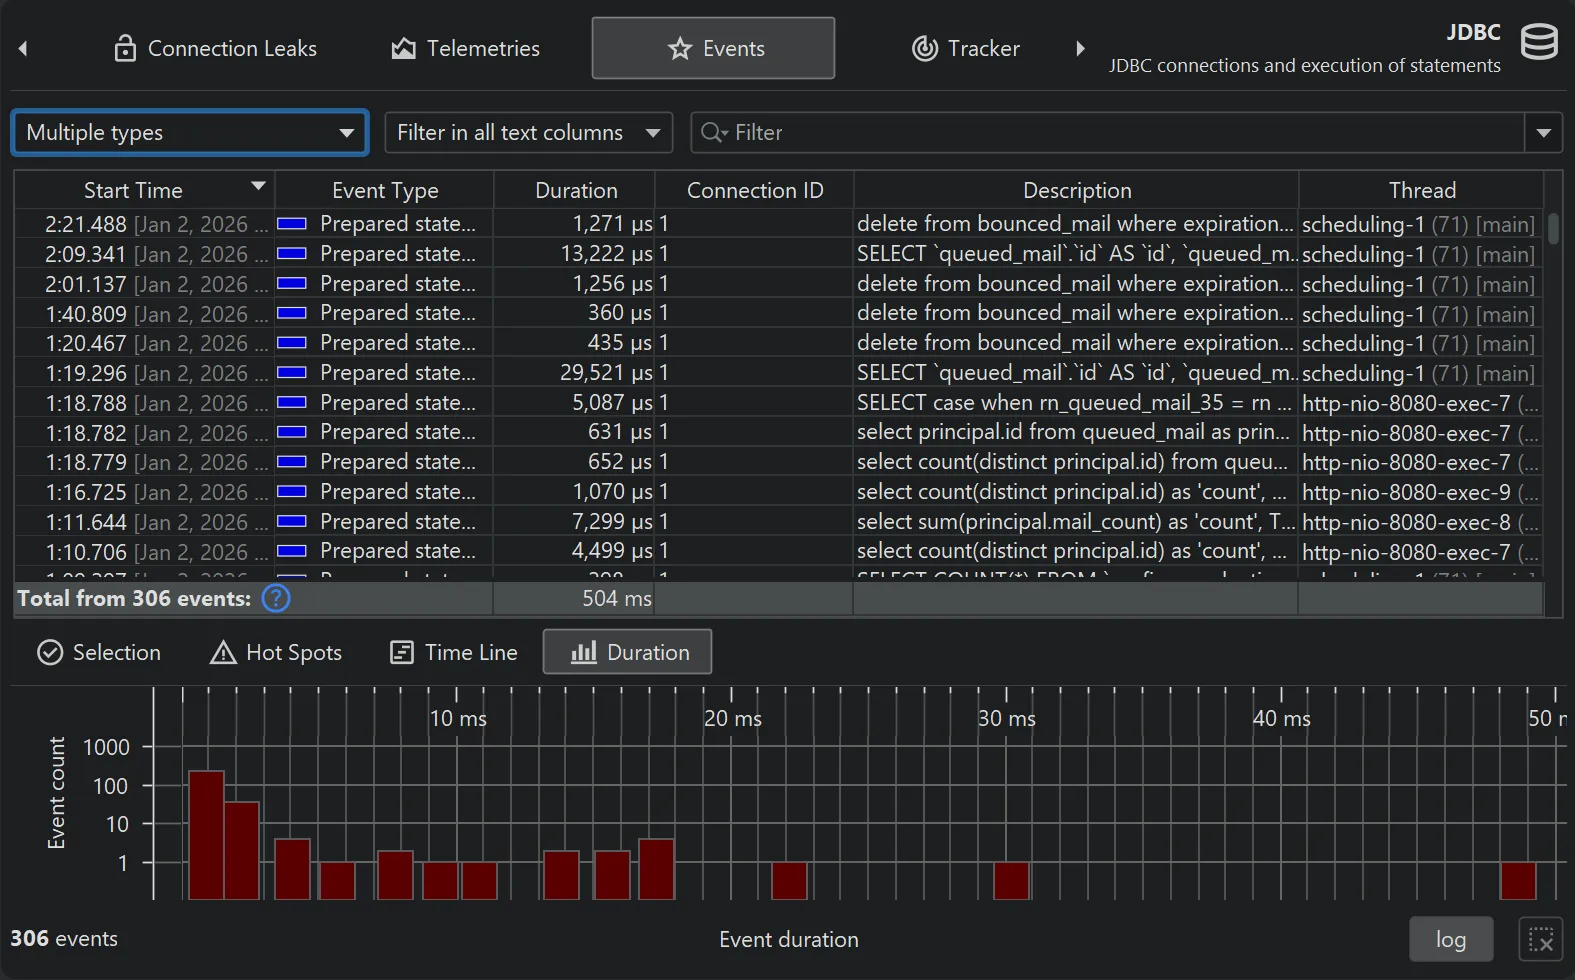
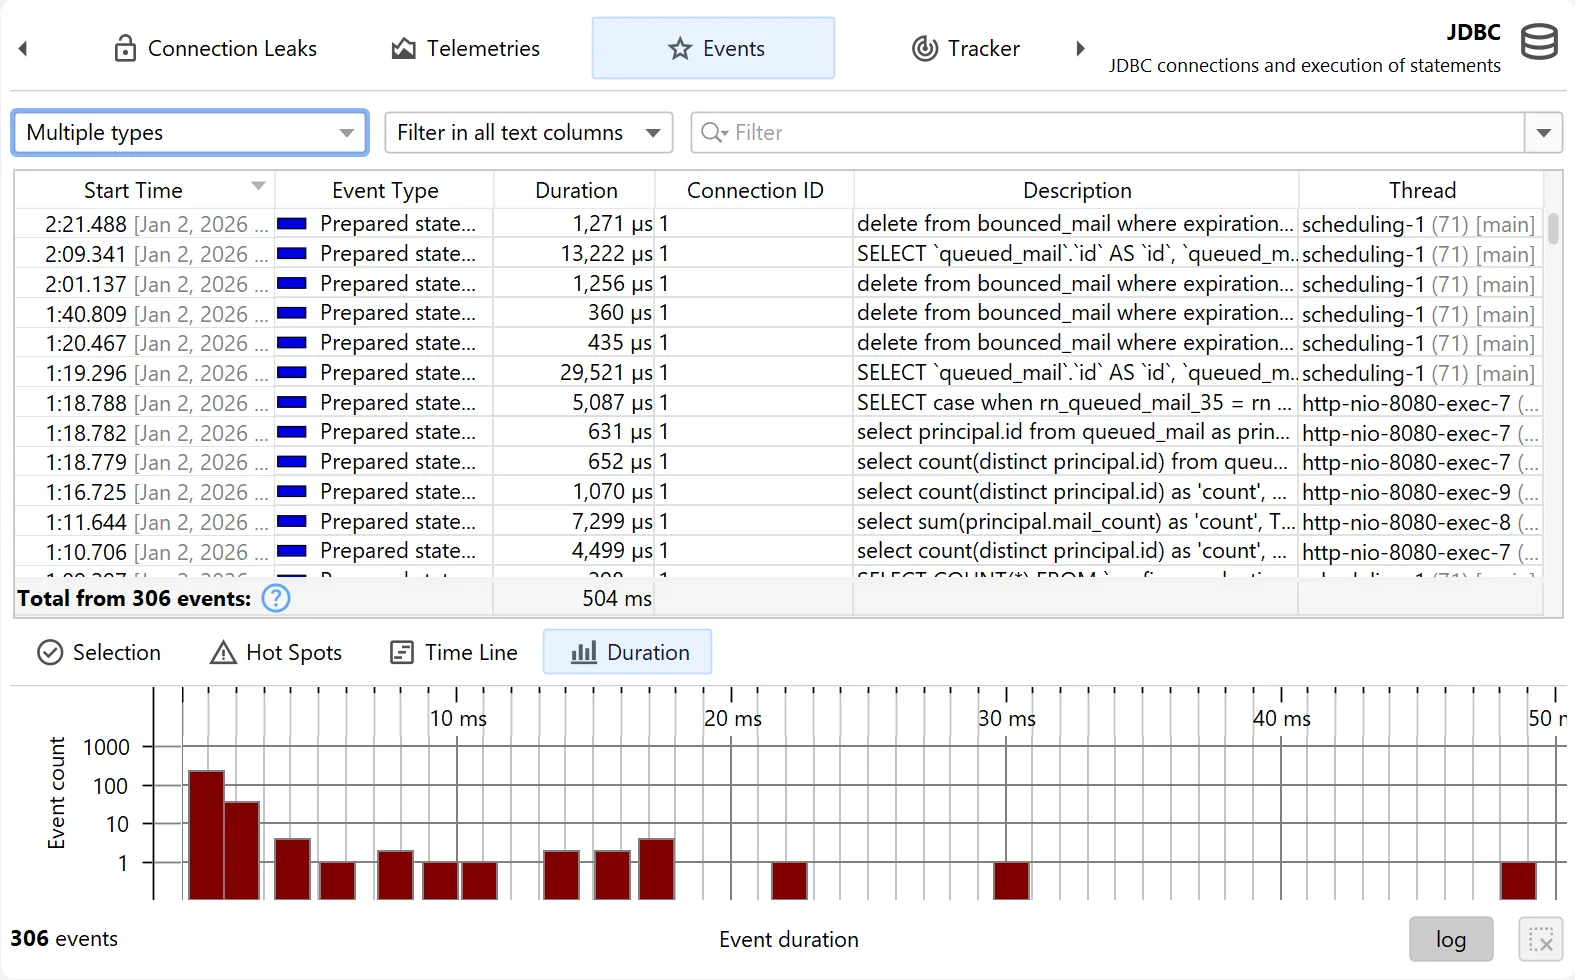
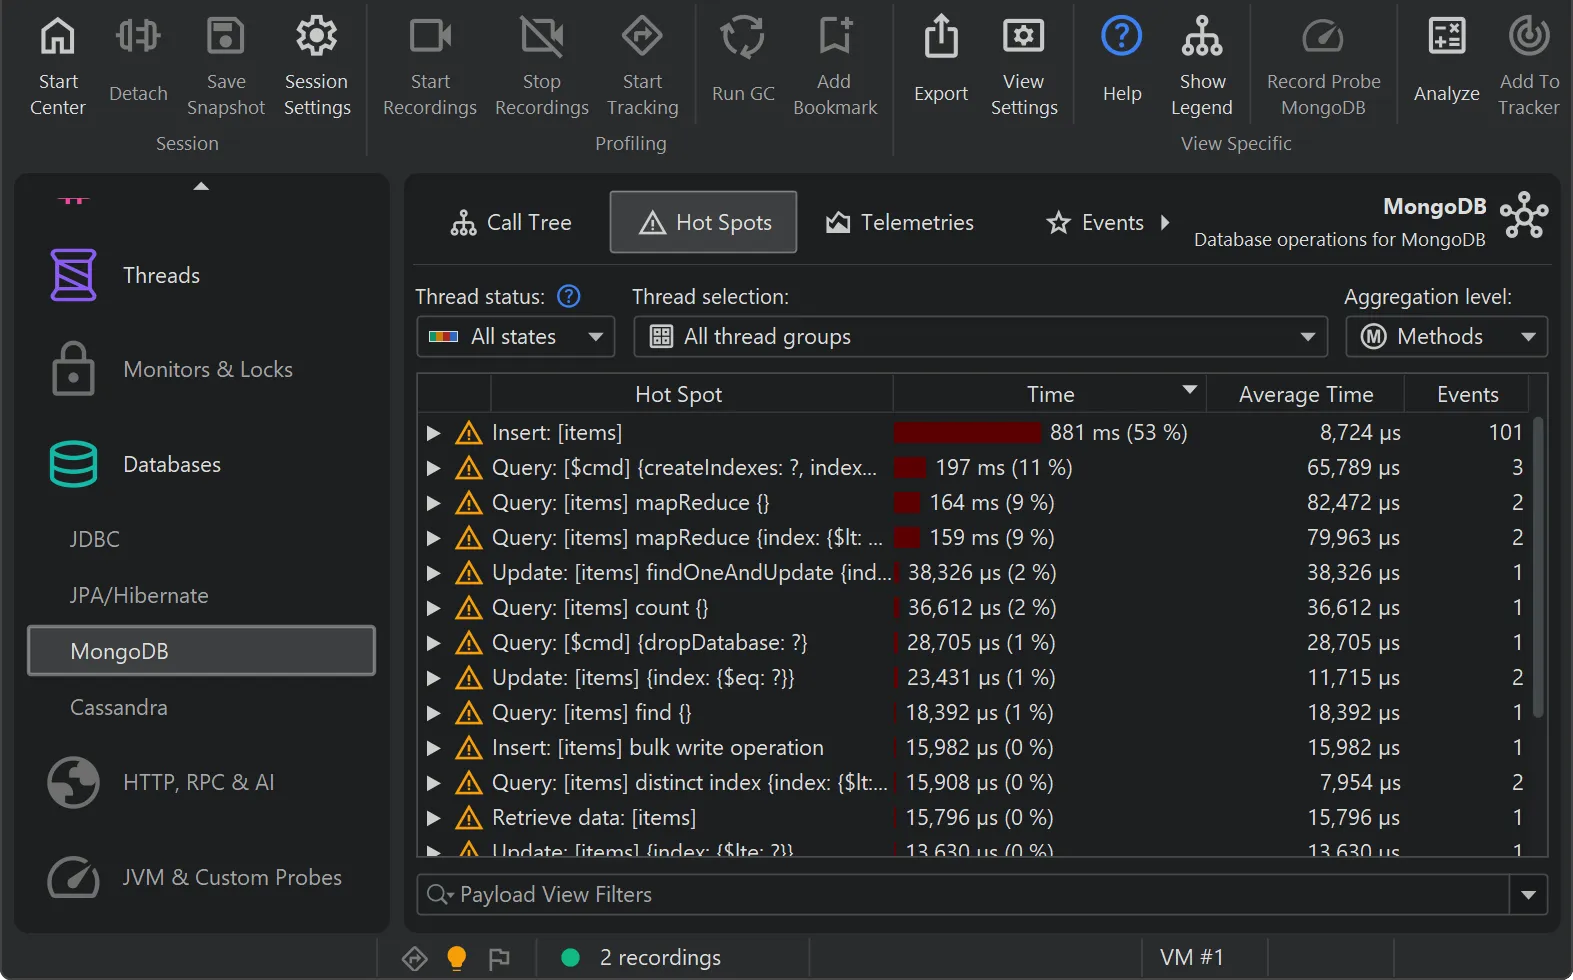
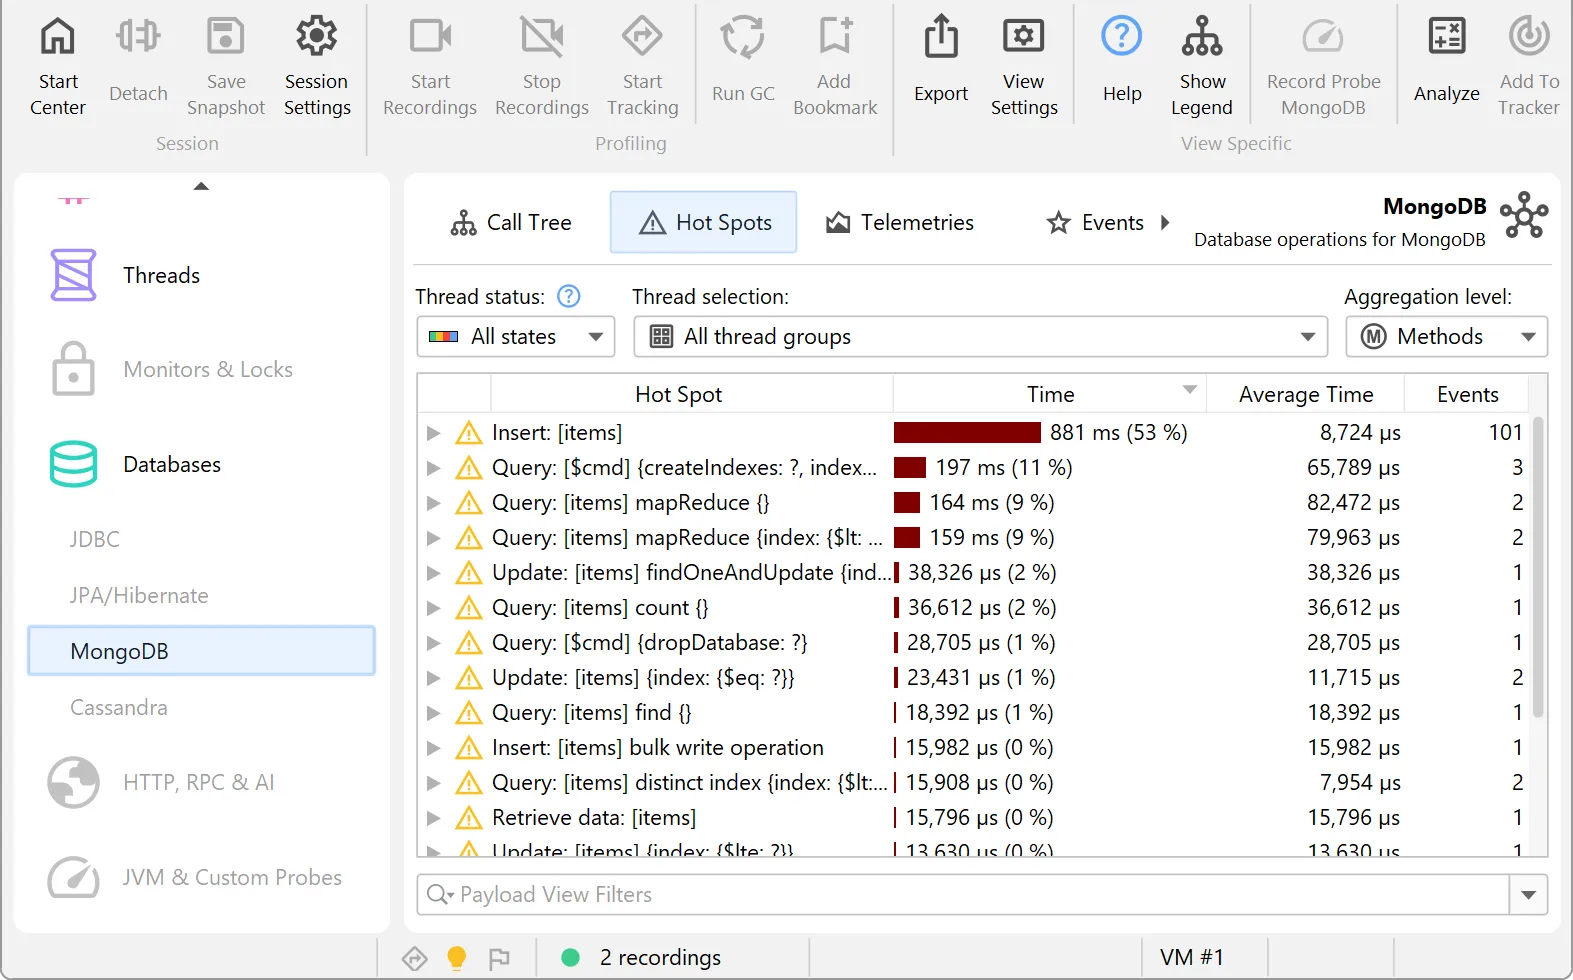
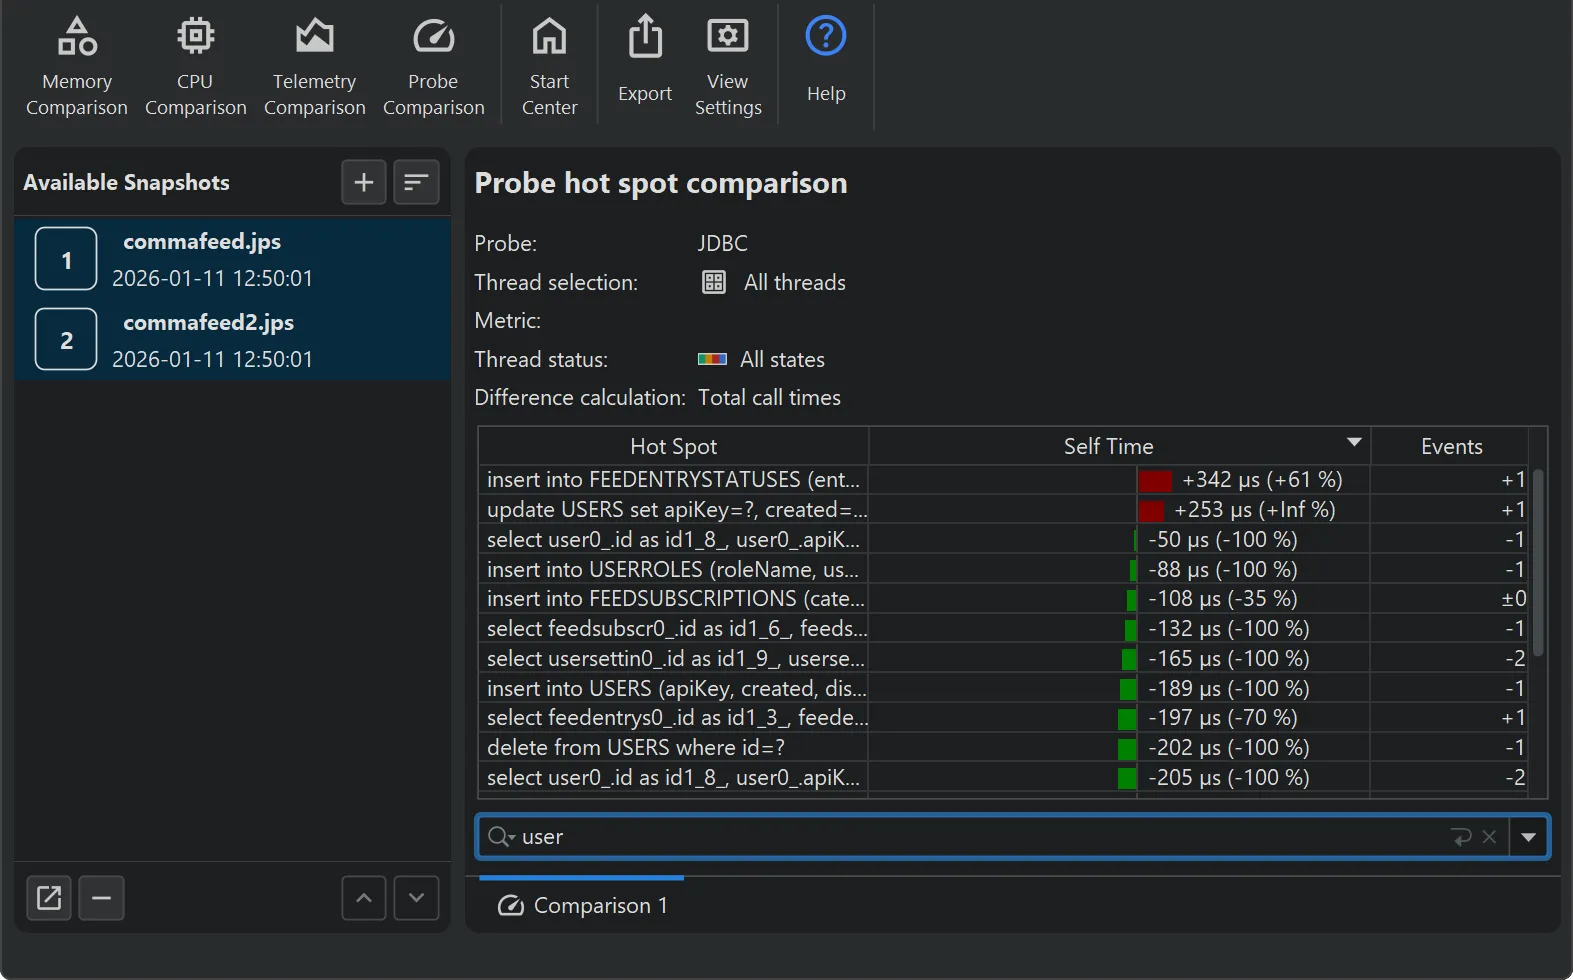
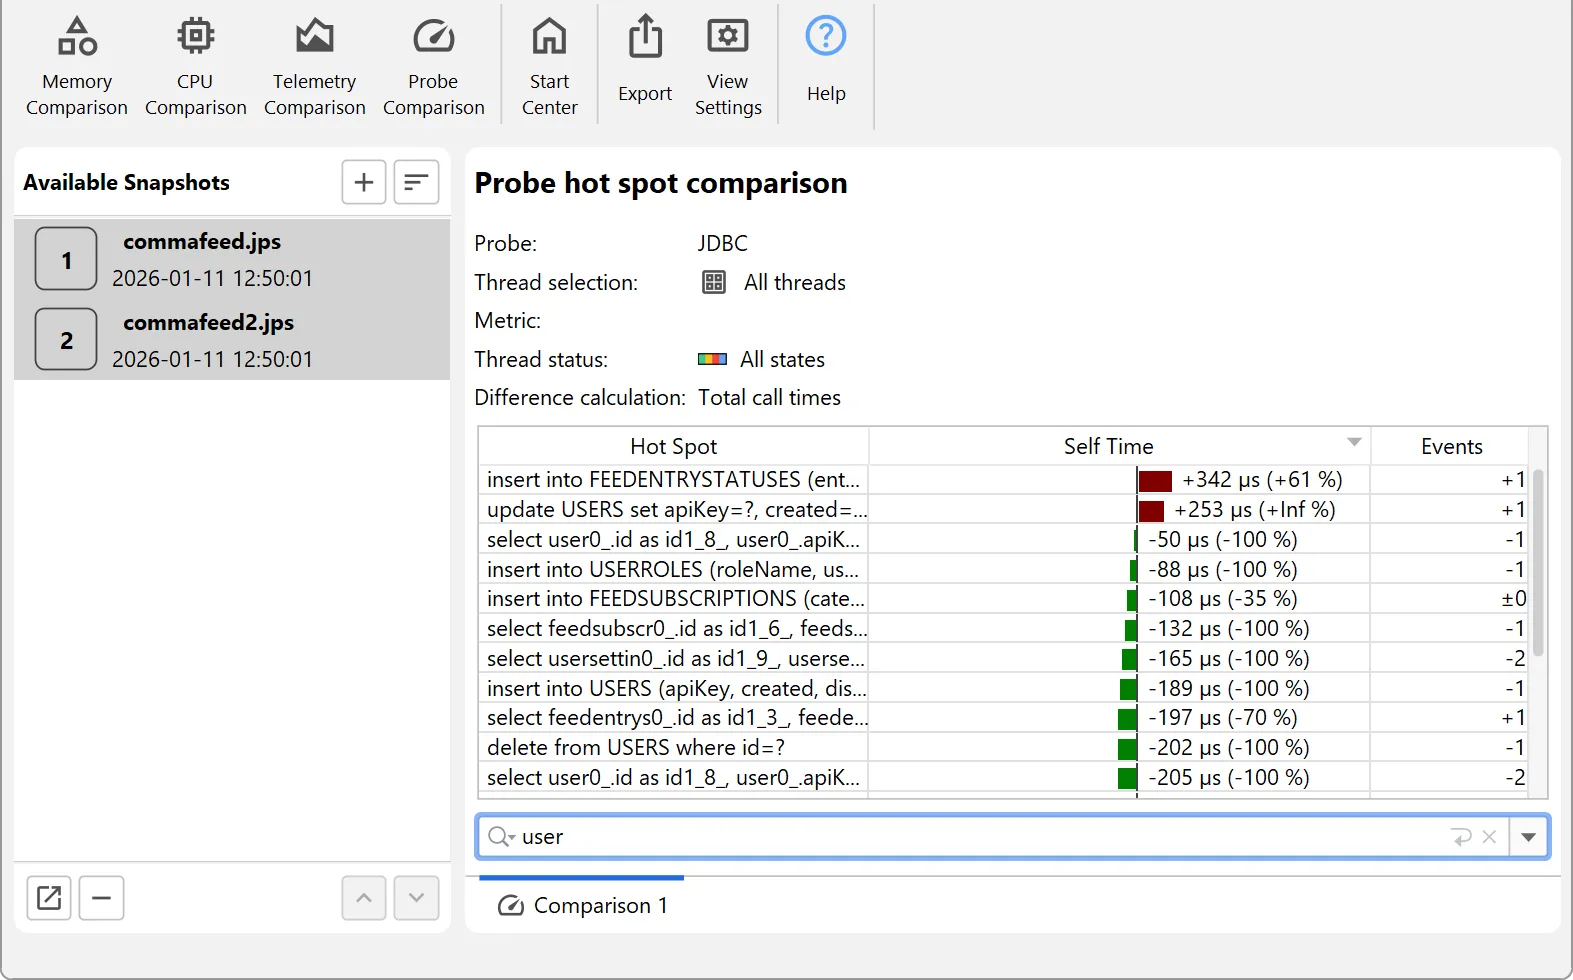
深入洞察 JDBC 和 JPA
数据库调用是性能问题的主要根源。JProfiler 帮助您以前所未有的速度找到并修复这些问题。
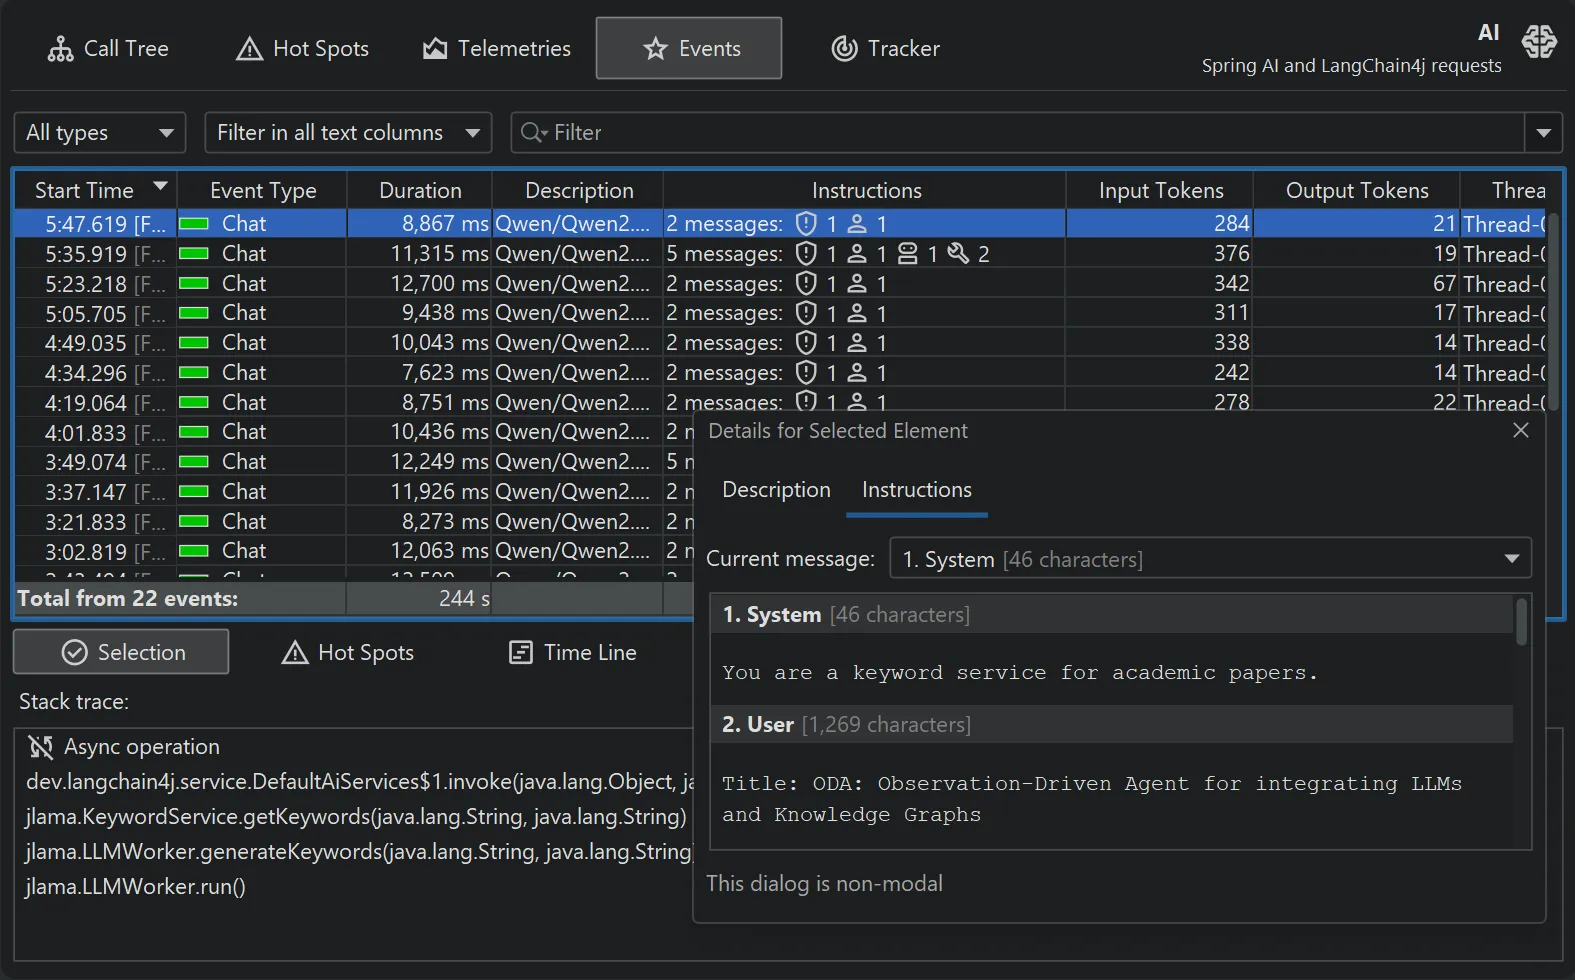
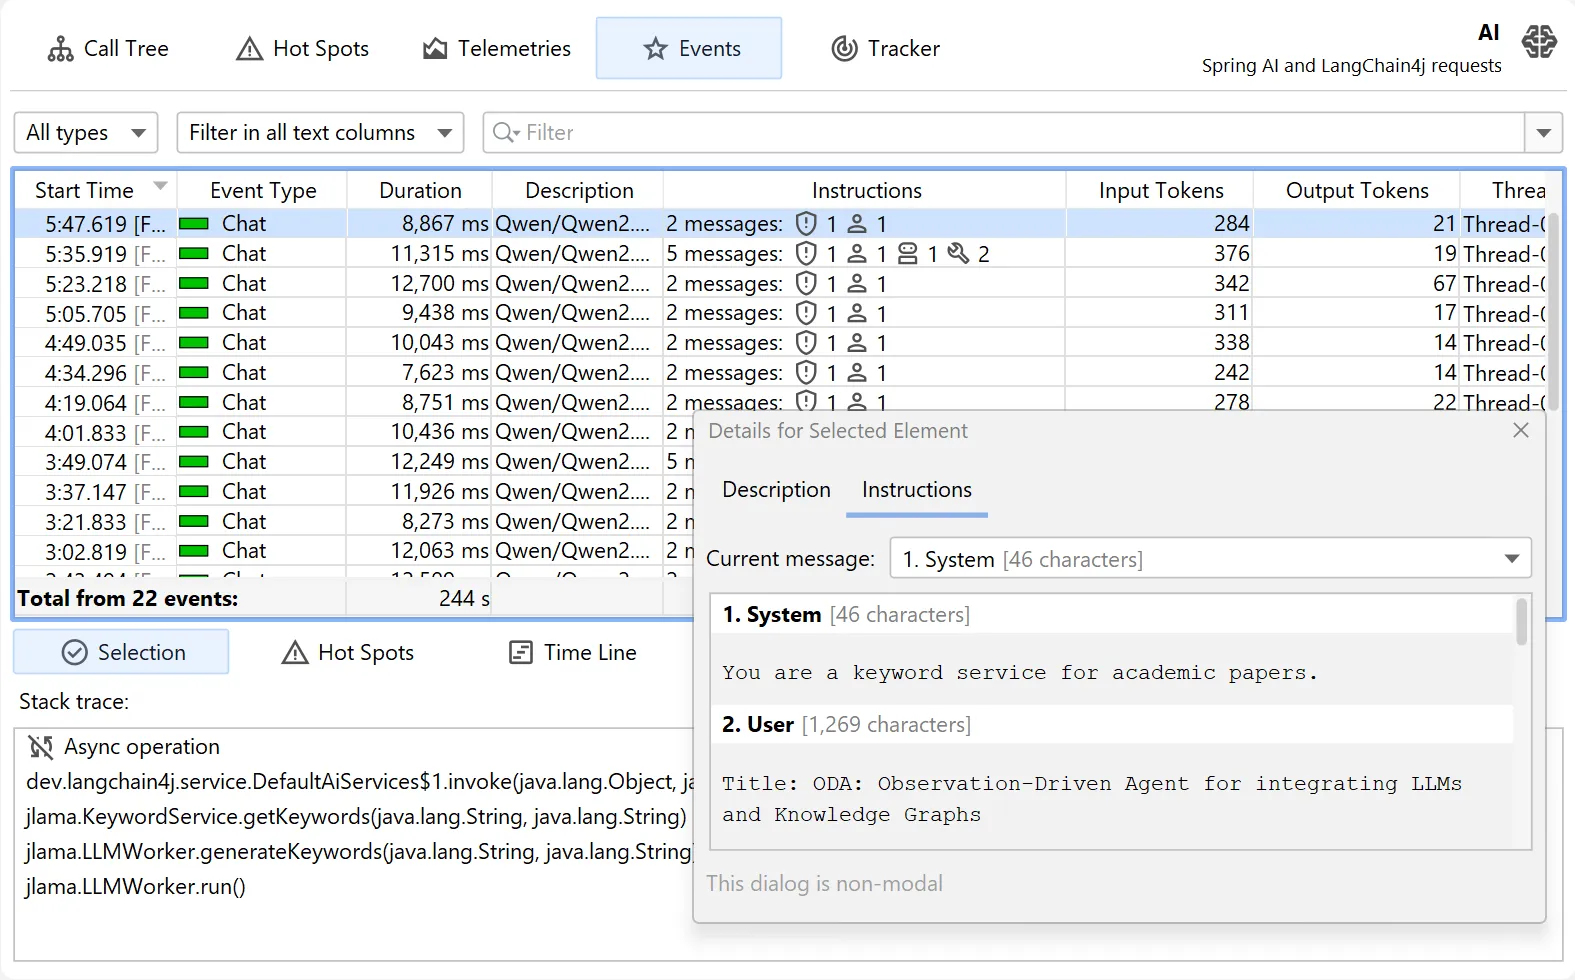
一流的 AI 可观测性
分析 AI 代理应用的上下文感知指标。JProfiler 帮助您最大限度地降低成本,并优化 LLM 性能。
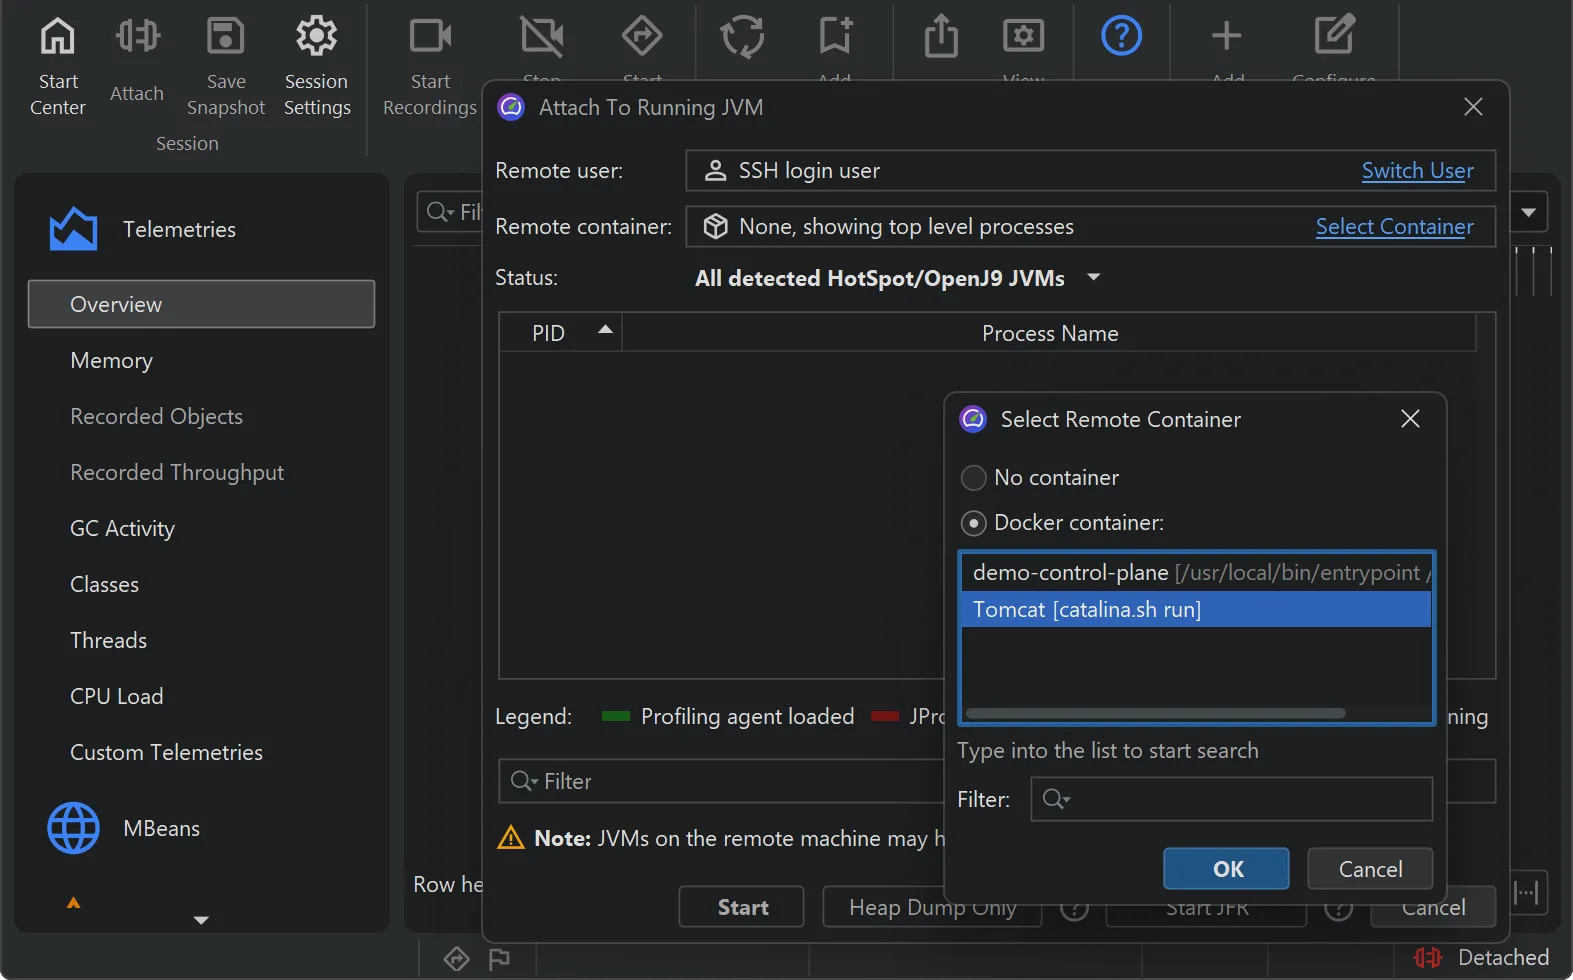
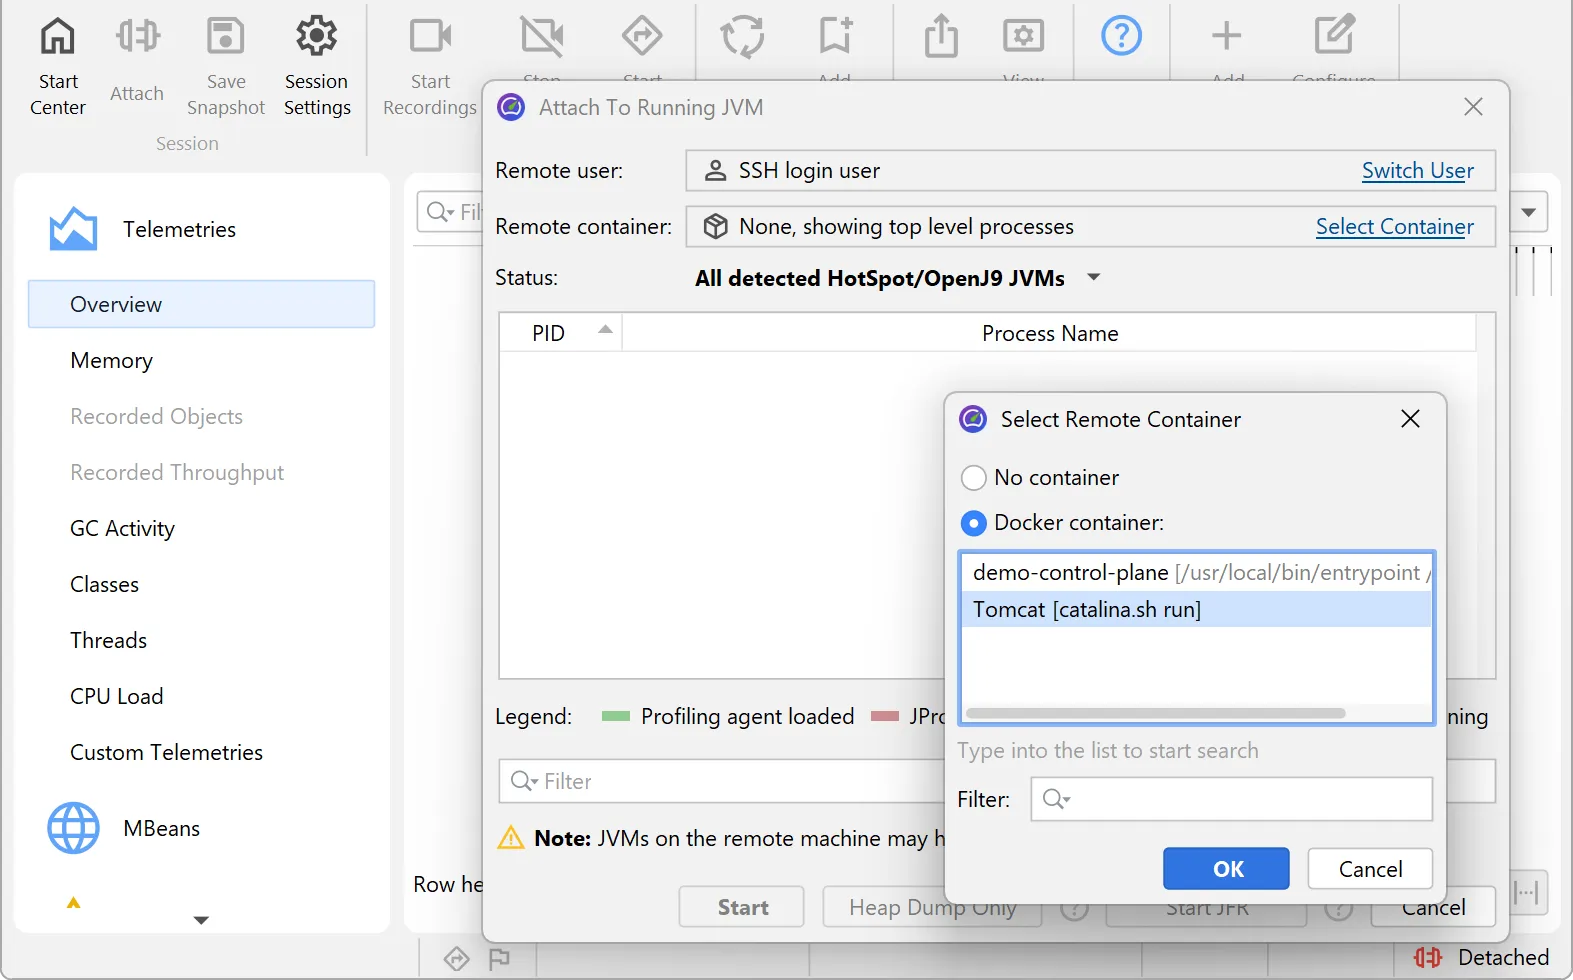
内置 Kubernetes 和 Docker 支持
分析容器中的 JVM 本不该如此麻烦。直接在 UI 中选择目标 JVM,免去一切繁琐的设置。
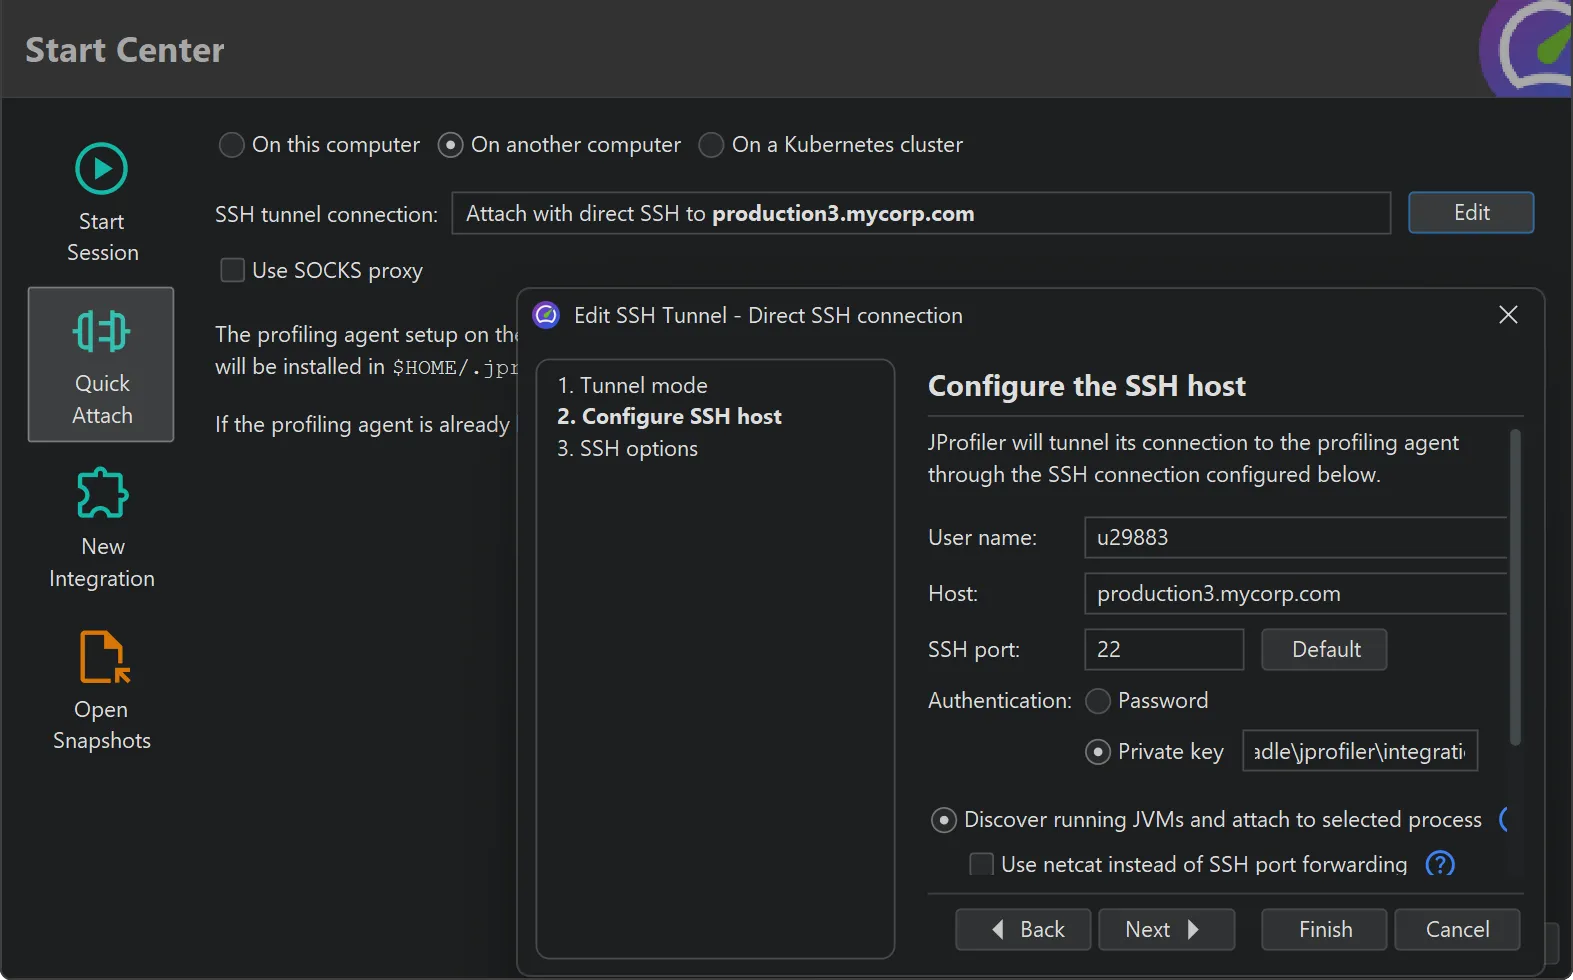
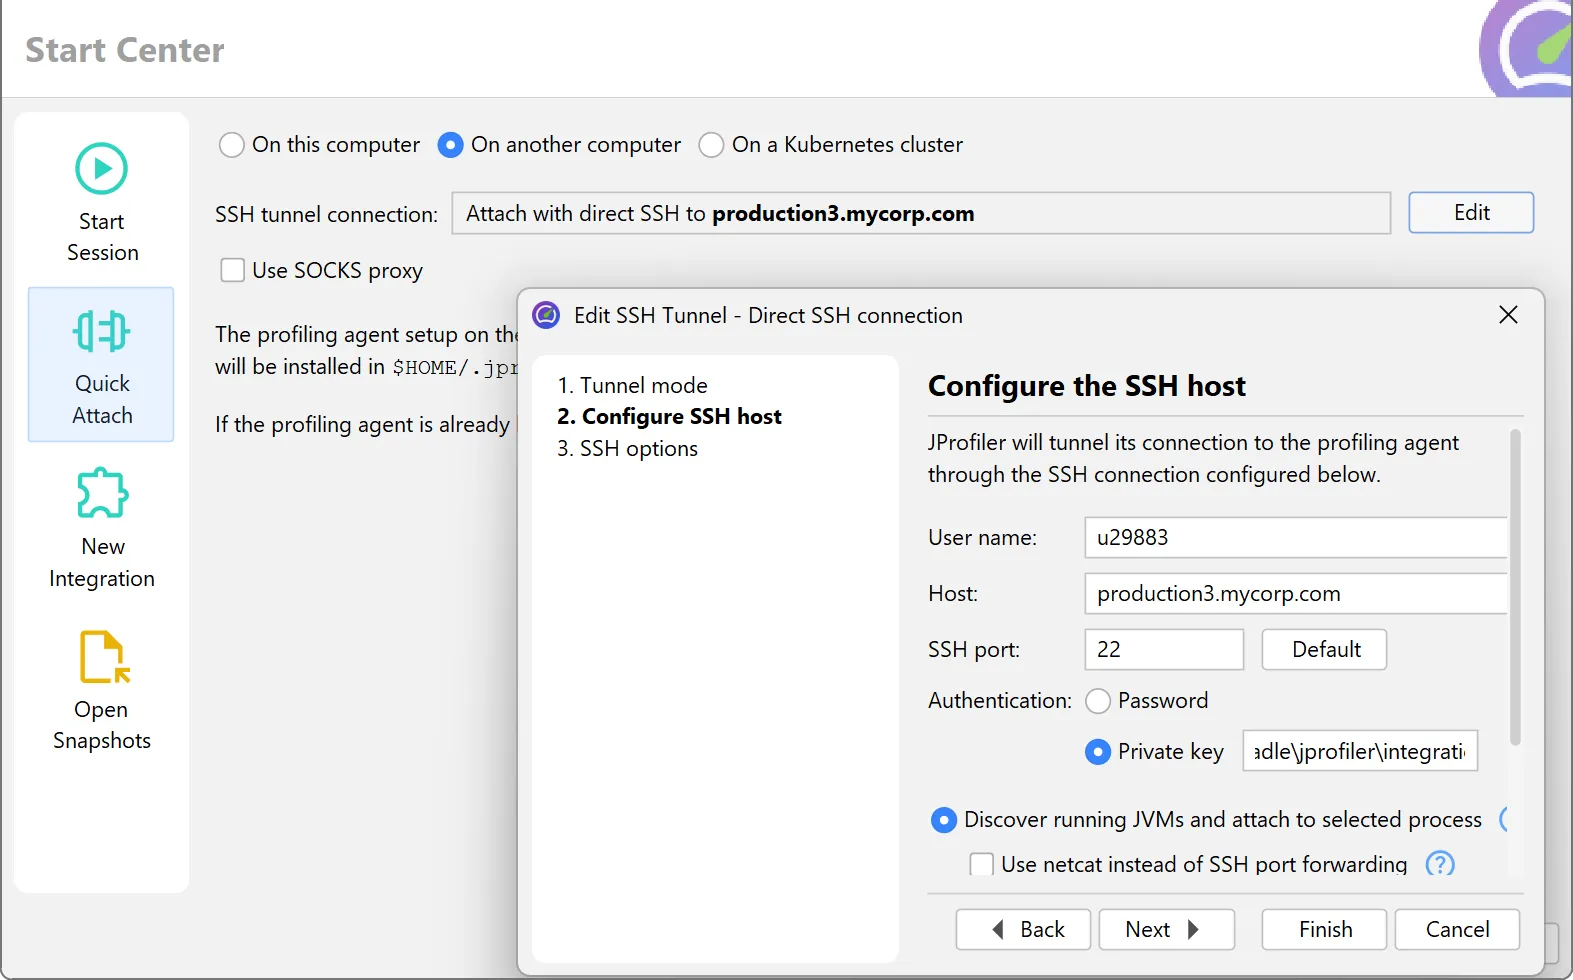
零配置远程分析
使用 SSH 凭据即刻分析远程 JVM,无需远程安装或部署分析代理。
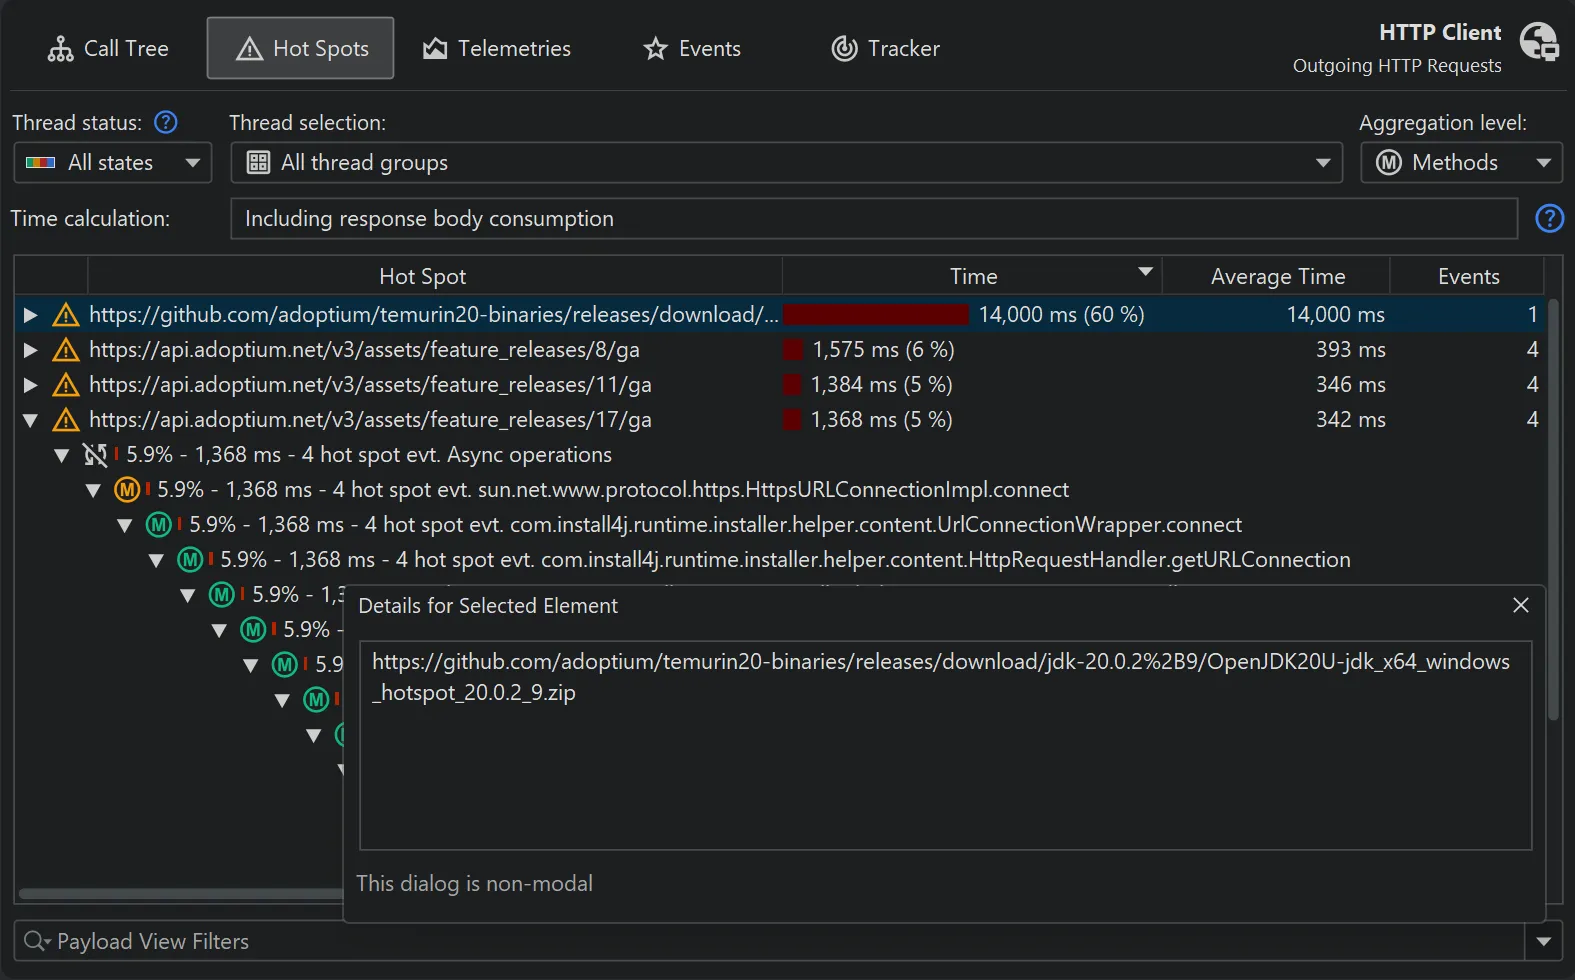
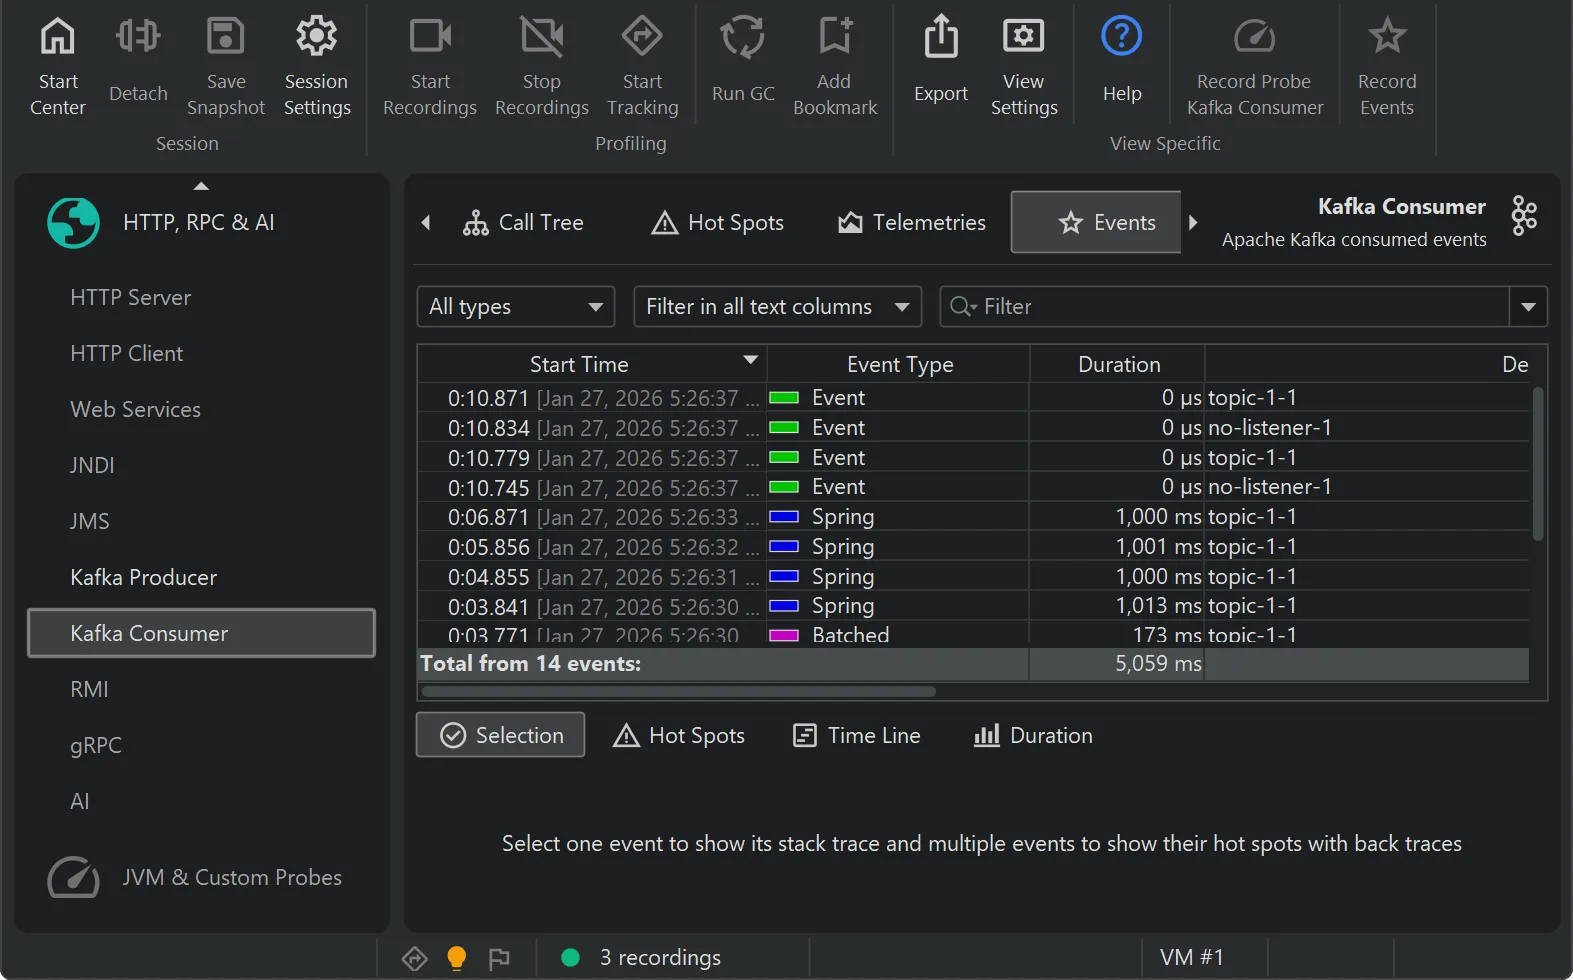
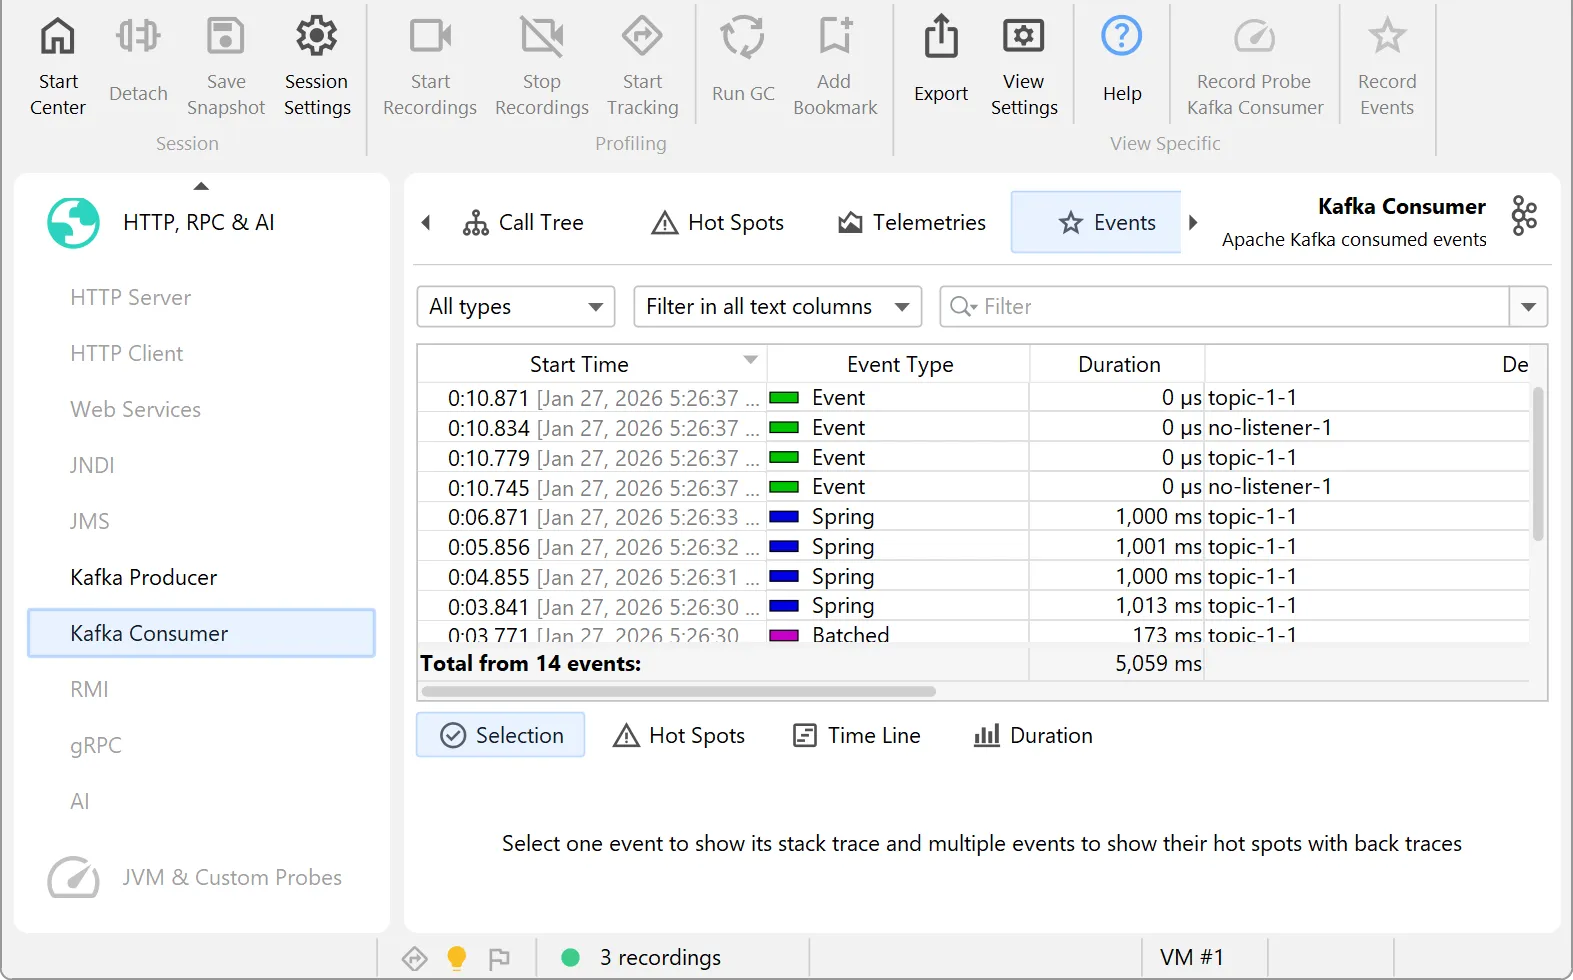
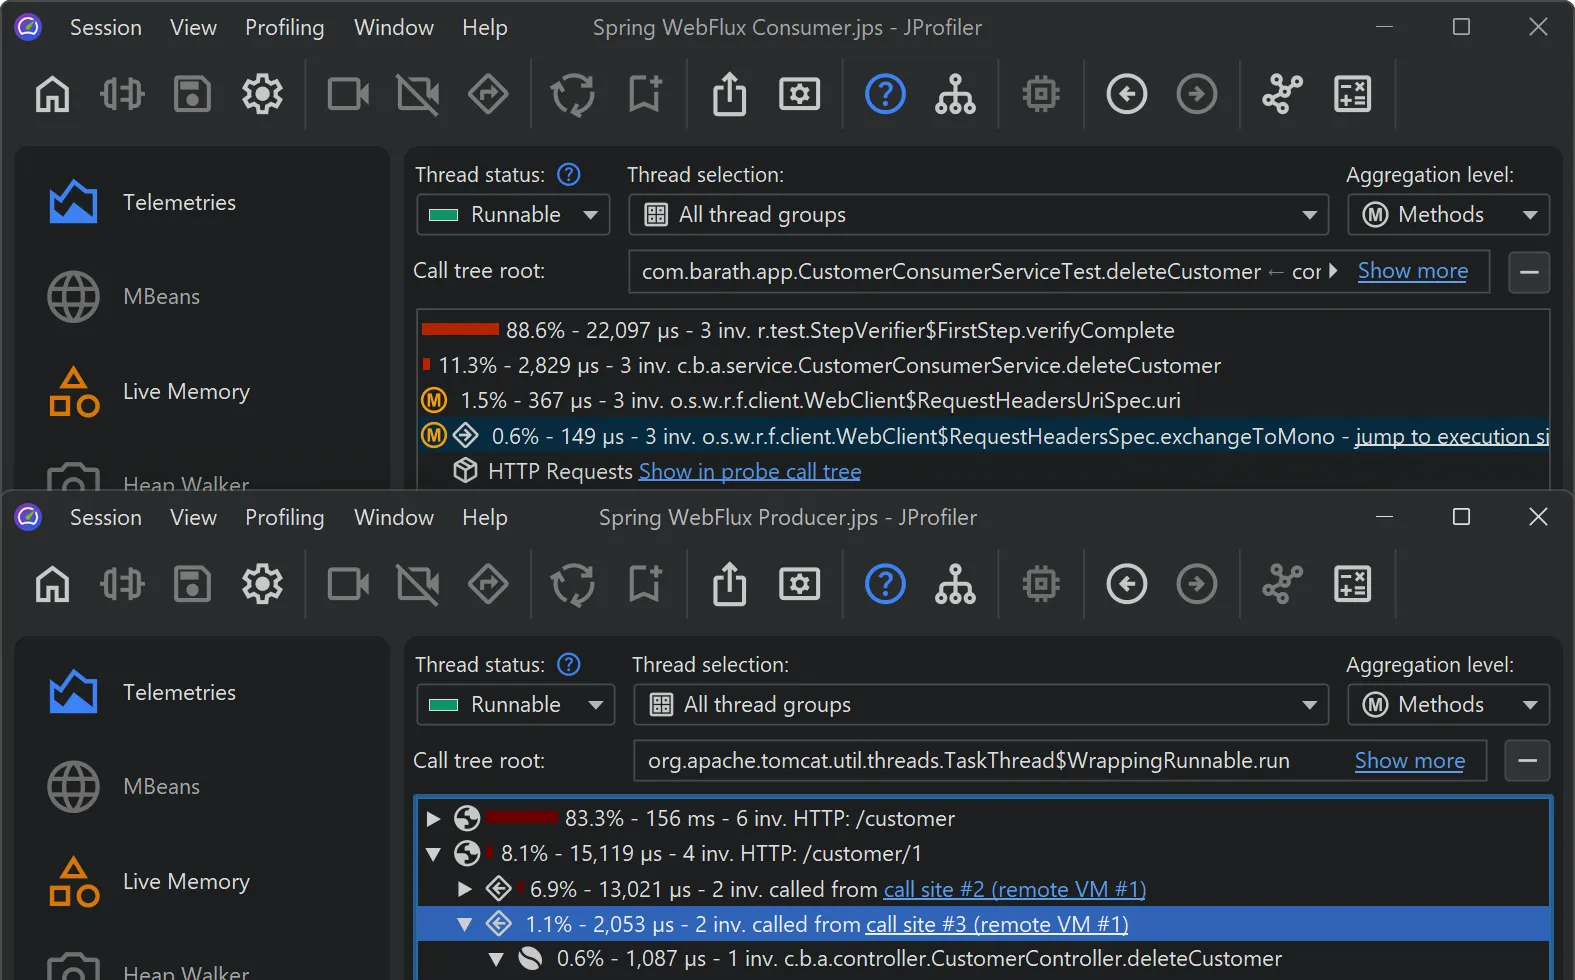
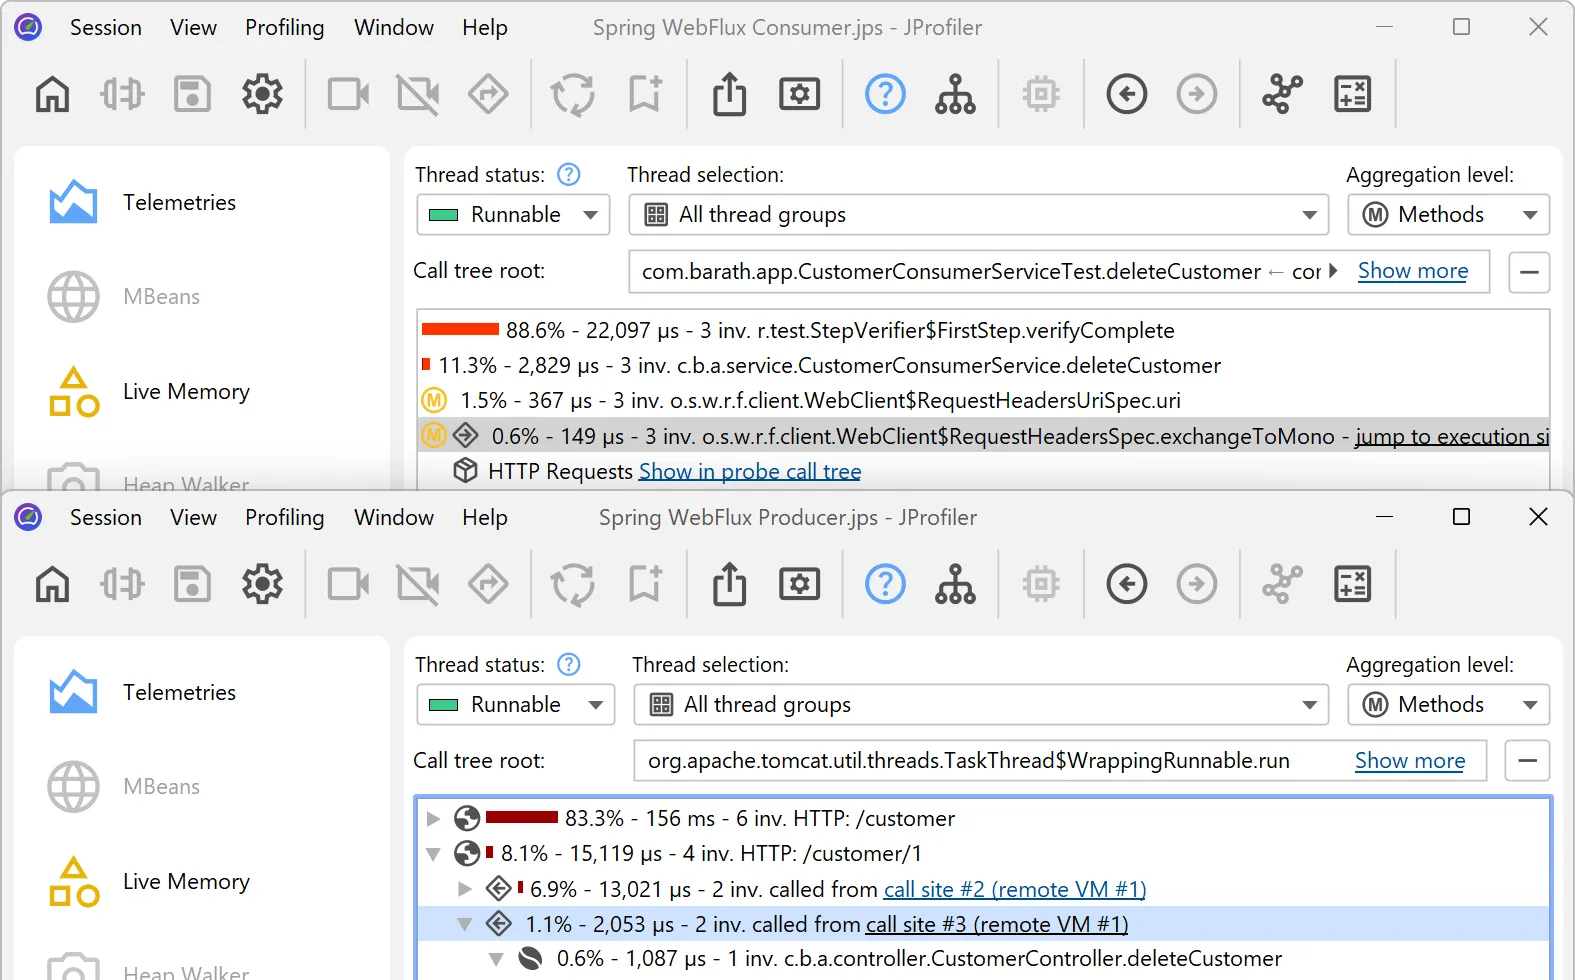
HTTP 调用的高级分析
JProfiler 是分析 HTTP 性能的首选工具,全面覆盖跨 JVM 边界的入站和出站调用。
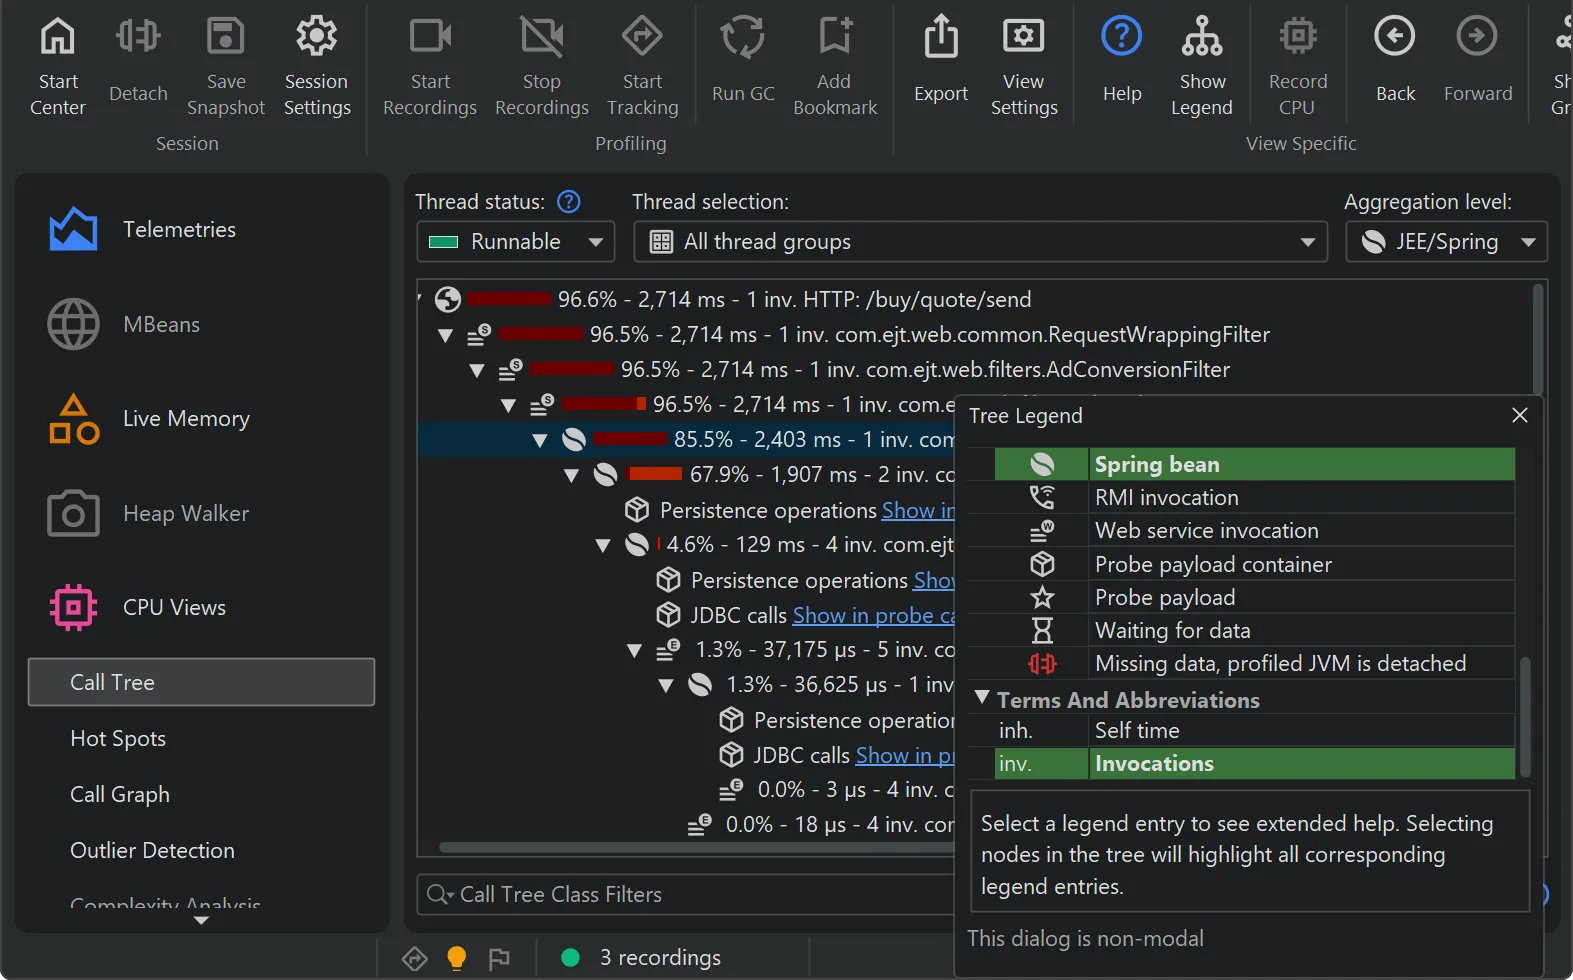
对 Spring 和 JEE 的出色支持
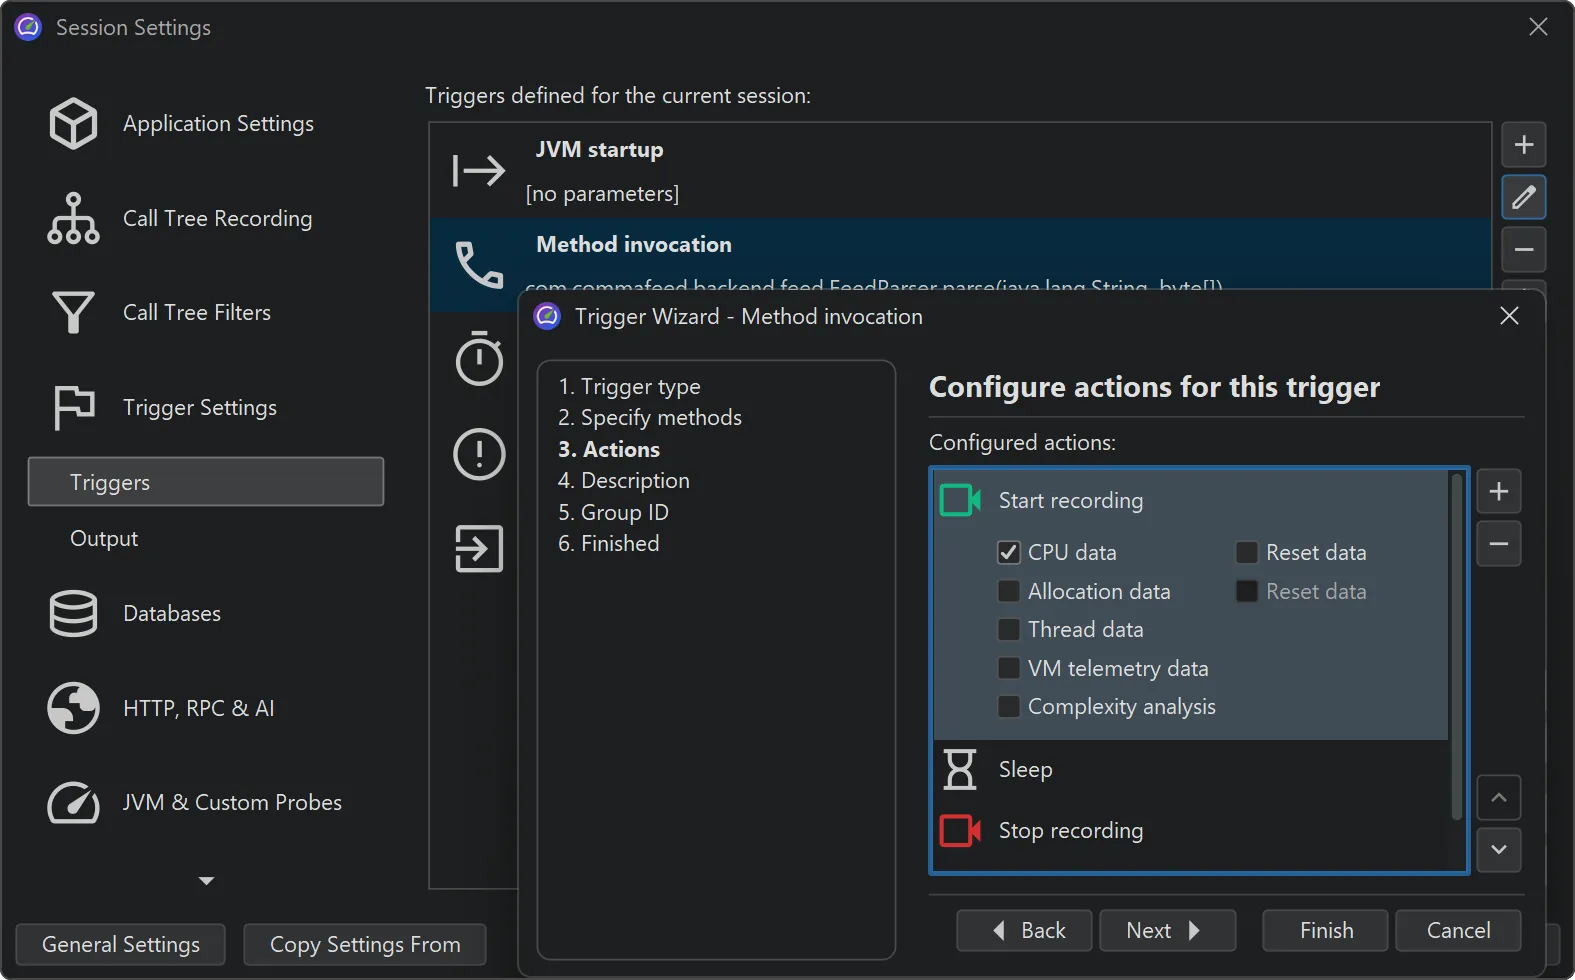
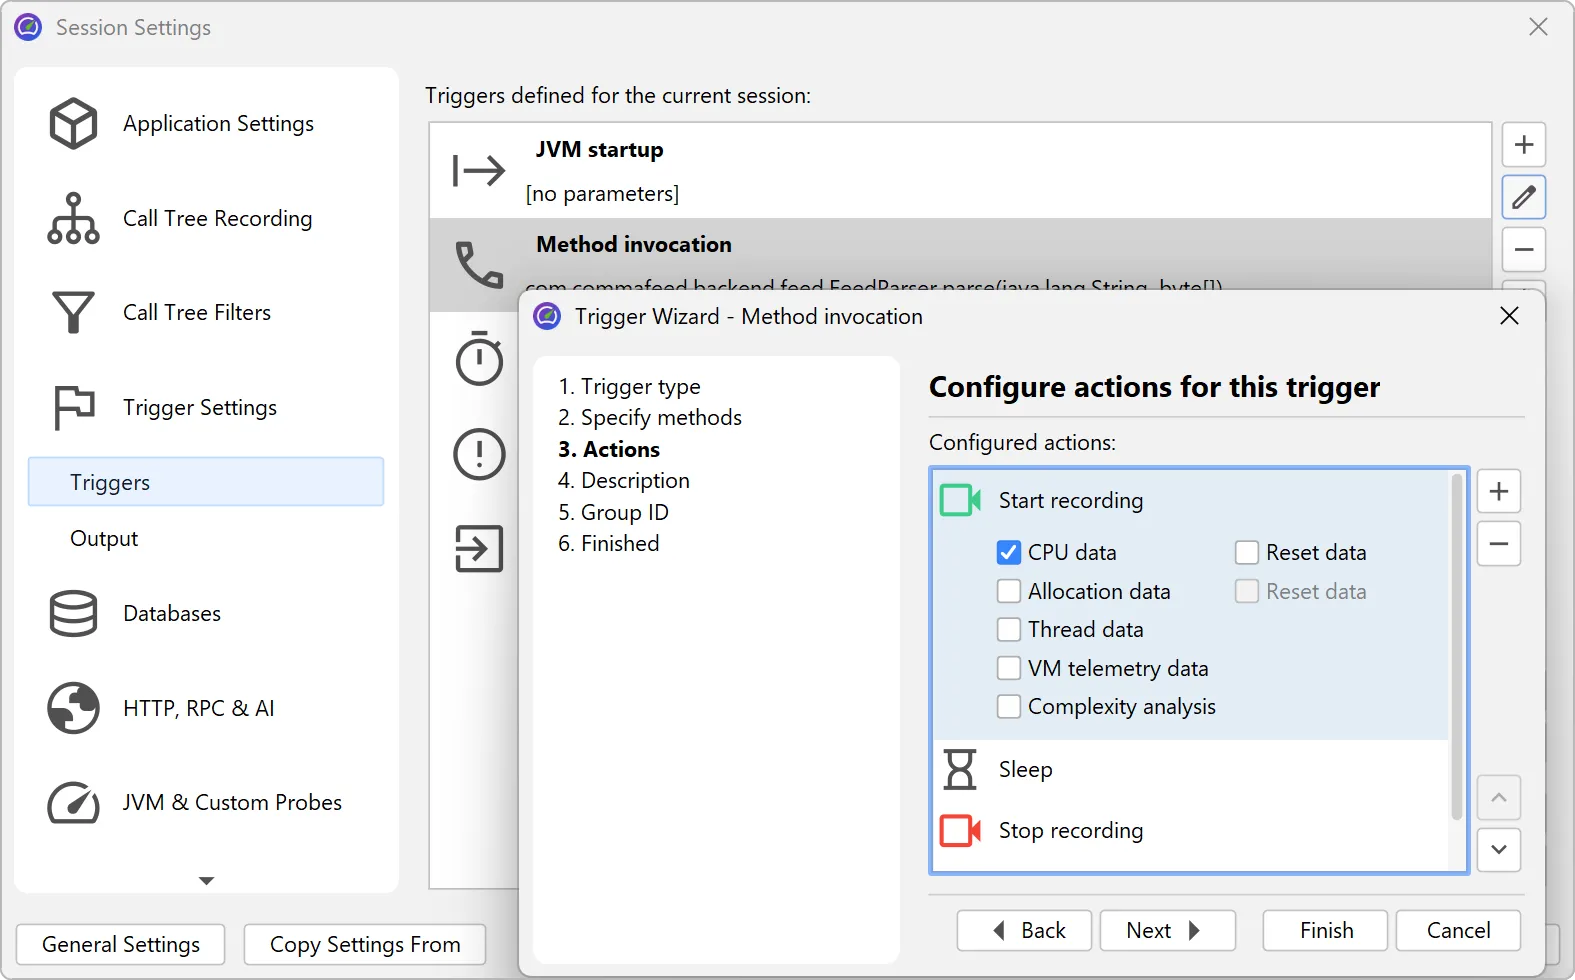
JProfiler 能够理解 Spring 和 JEE 组件,将高层上下文与底层方法调用数据相结合。
……以及更多功能
使用 JProfiler 节省时间和金钱
JProfiler 的成本能够以惊人的速度收回

使用市场上最出色的性能分析工具提升工作效率。借助 JProfiler,您可以:
- 将时间专注于业务逻辑
- 在真正重要的地方解决性能和内存问题
- “先做那些无法规模化的事情,事后再改进” —— Paul Graham

我们的众多客户已将云成本降低了一半。借助 JProfiler,您可以:
- 优化资源使用
- 降低数据传输速率
- 最大限度降低 CPU 和内存需求

生产系统宕机时,每一秒都至关重要。借助 JProfiler,您可以:
- 使用强大的远程附加功能分析运行中的系统
- 使用高级探针实时调试个别案例
- 以 JProfiler 的全部功能分析 JFR 和 HPROF 等事后快照
用户评价
全球 30000 多家客户以及超过 75% 的财富 500 强企业都在使用 JProfiler。

“I recently evaluated JProfiler to identify some performance issues in an app I'm working on in my current consulting gig. I had been banging my head against the wall trying to get tools like VisualVM working against the IBM JVMs that the client uses and then I tried JProfiler. With the IDE plugin support it provides, it just worked and in the last day or so, I've been able to easily identify sources for all our major performance problems.”
“What started out as a search for a memory leak and a trial of JProfiler turned out to be the find of a year. Not only did we find our memory leak, we got started in only minutes of setup work, found slow background processes, reduced server costs and tuned our software to make it faster and more responsive. All this in just a week and a free trial. Given the results it seemed obvious we should add JProfiler to our tool chain!”
“I have evaluated lots of Java profilers. Yours is simply FAN-TA-STIC!. I love the 'live' views and auto-updated profiling information. JProfiler is also the only profiling tool to reliably report time spent in JNI calls, which is very valuable in our Java applications which are JNI intensive.”
观看视频演示
我们在博客中为 JProfiler 发布视频演示,涵盖重要用例和新功能。