왜 JProfiler인가?
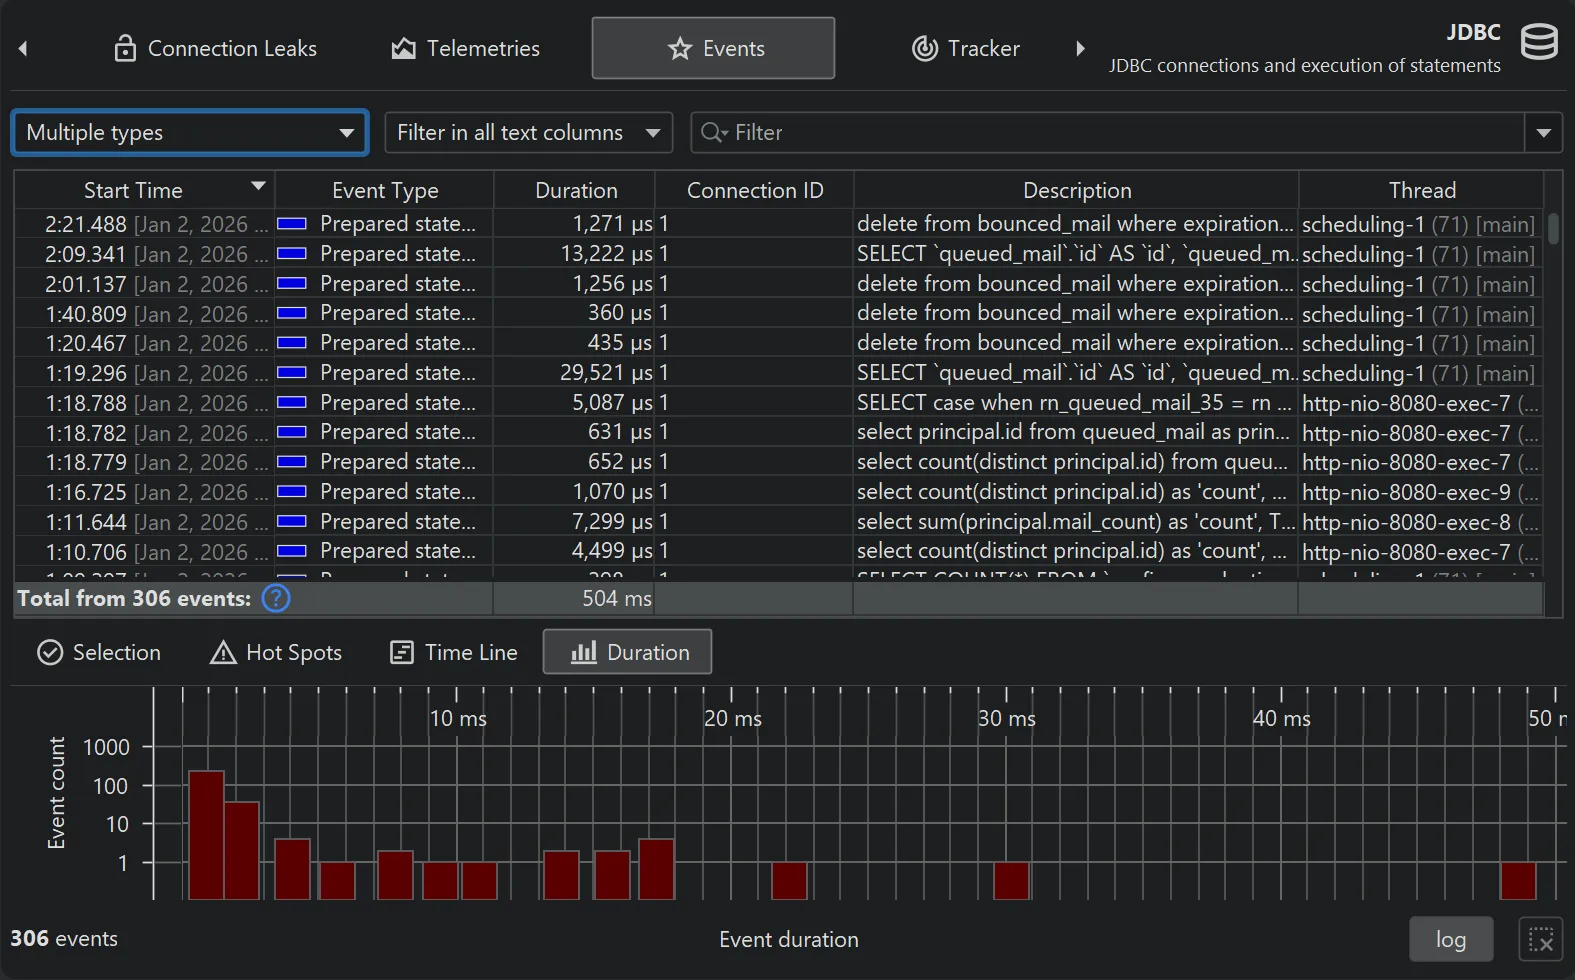
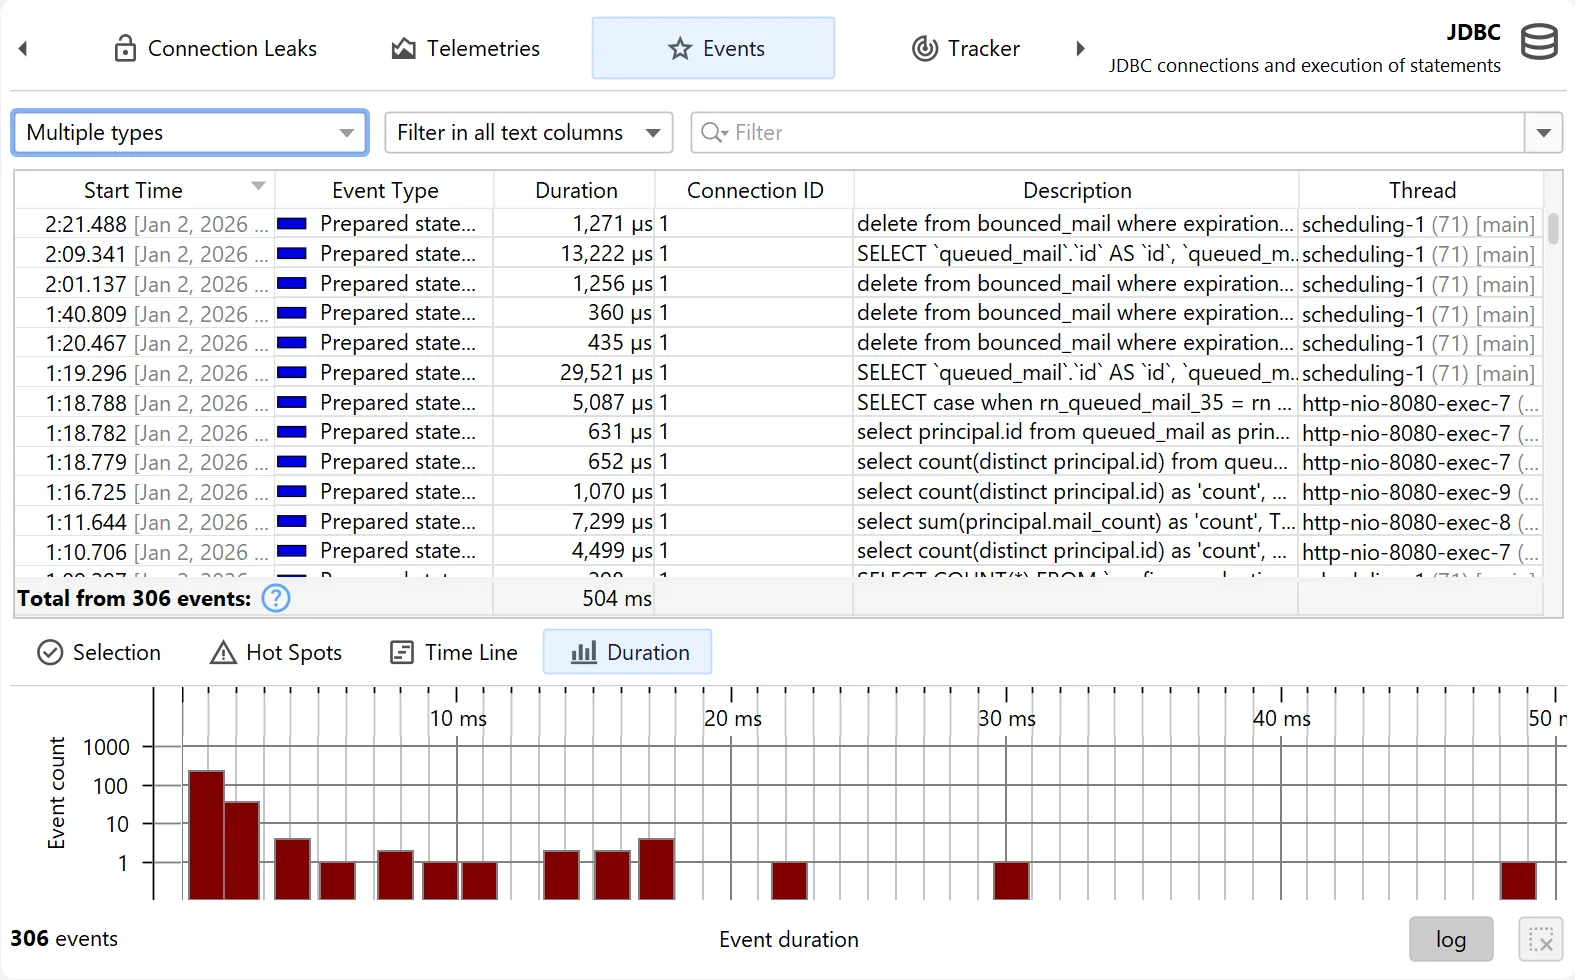
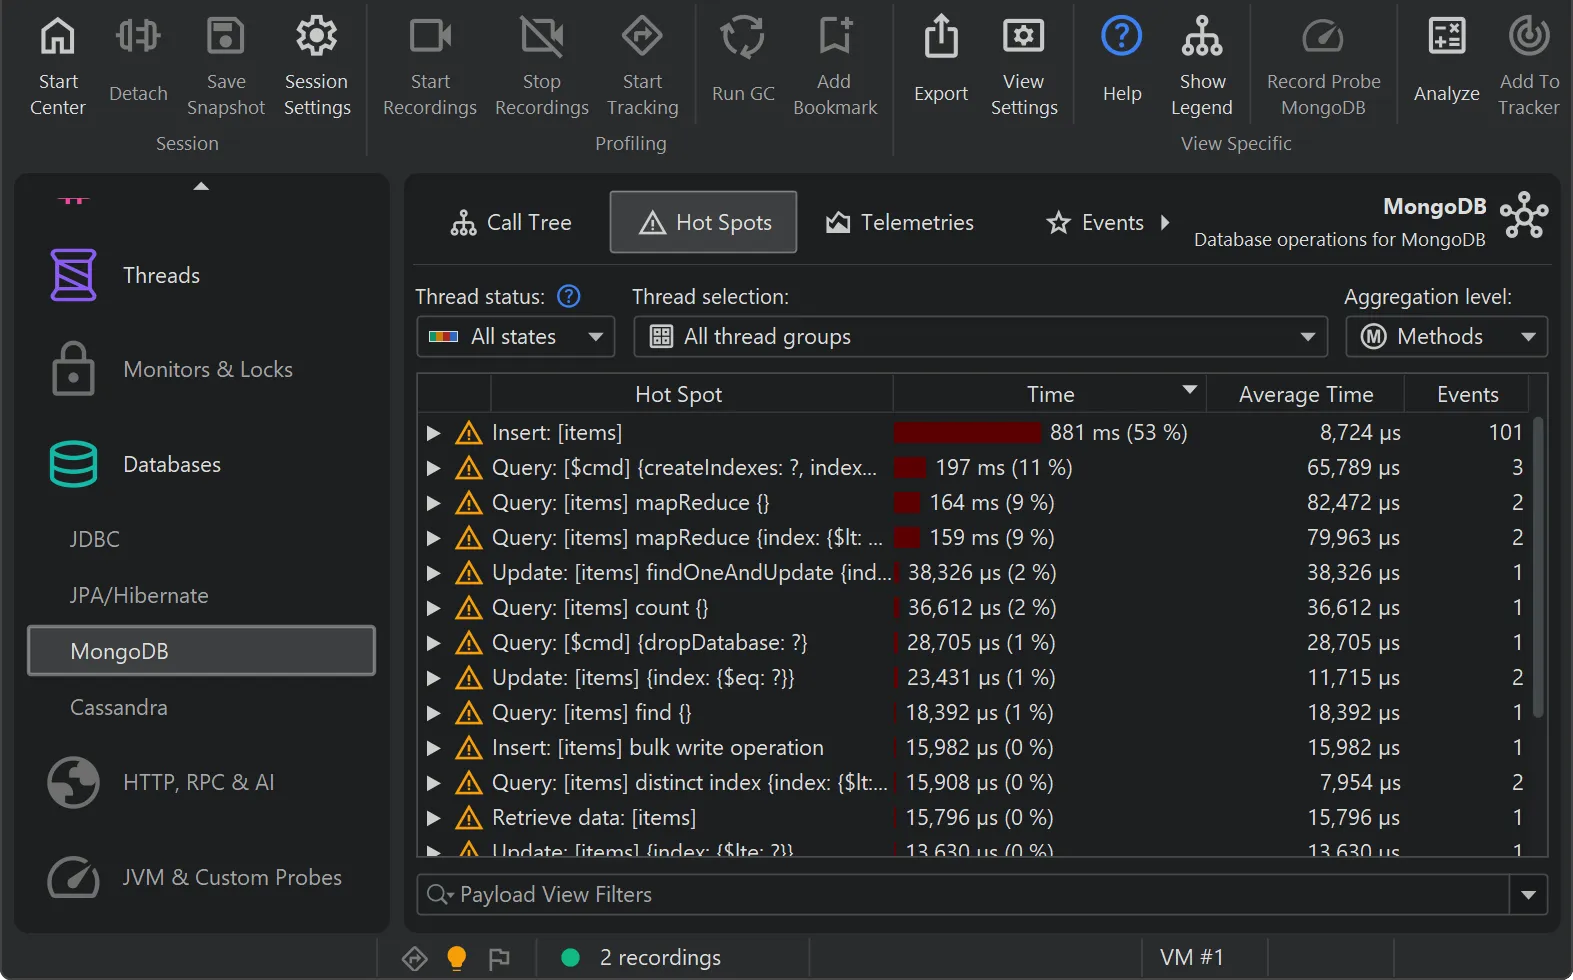
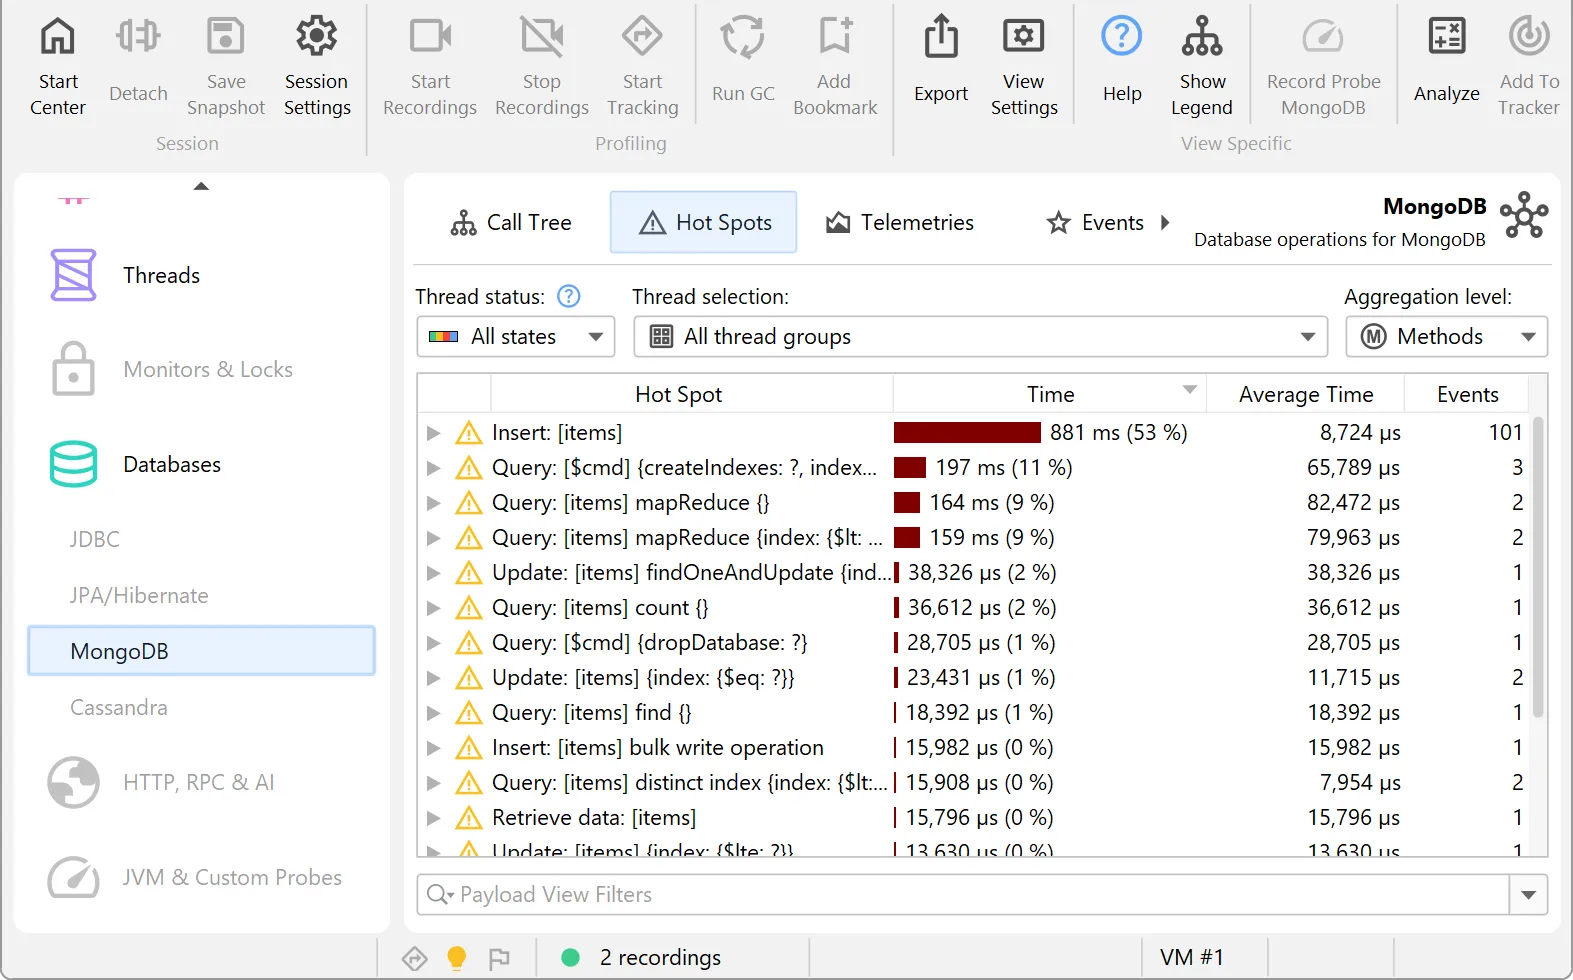
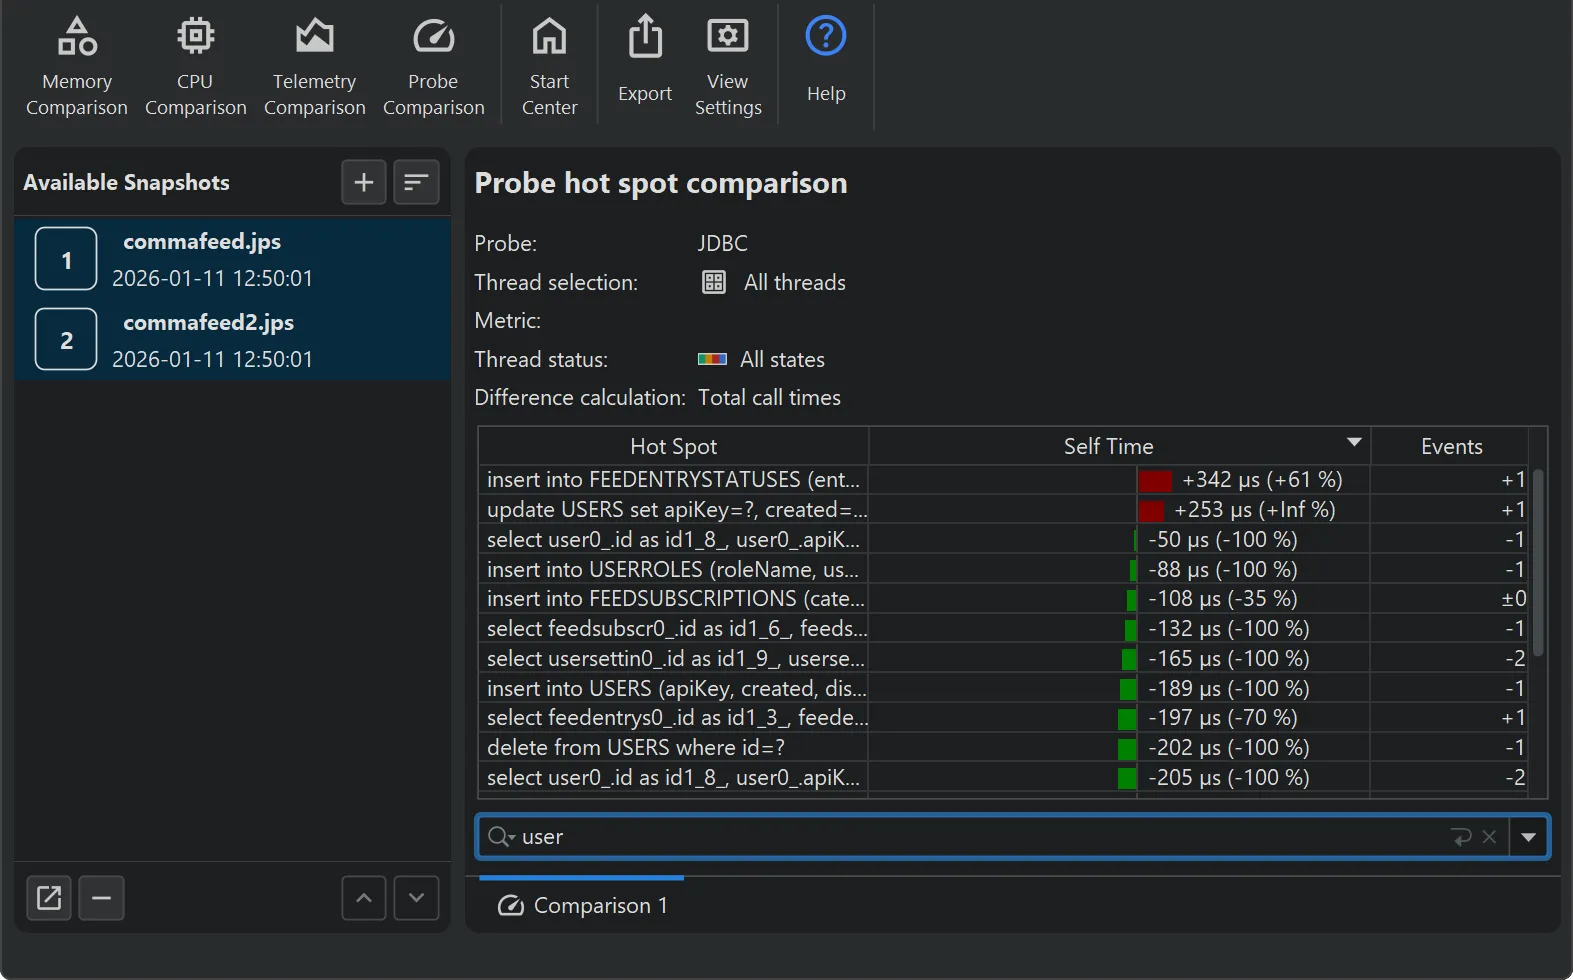
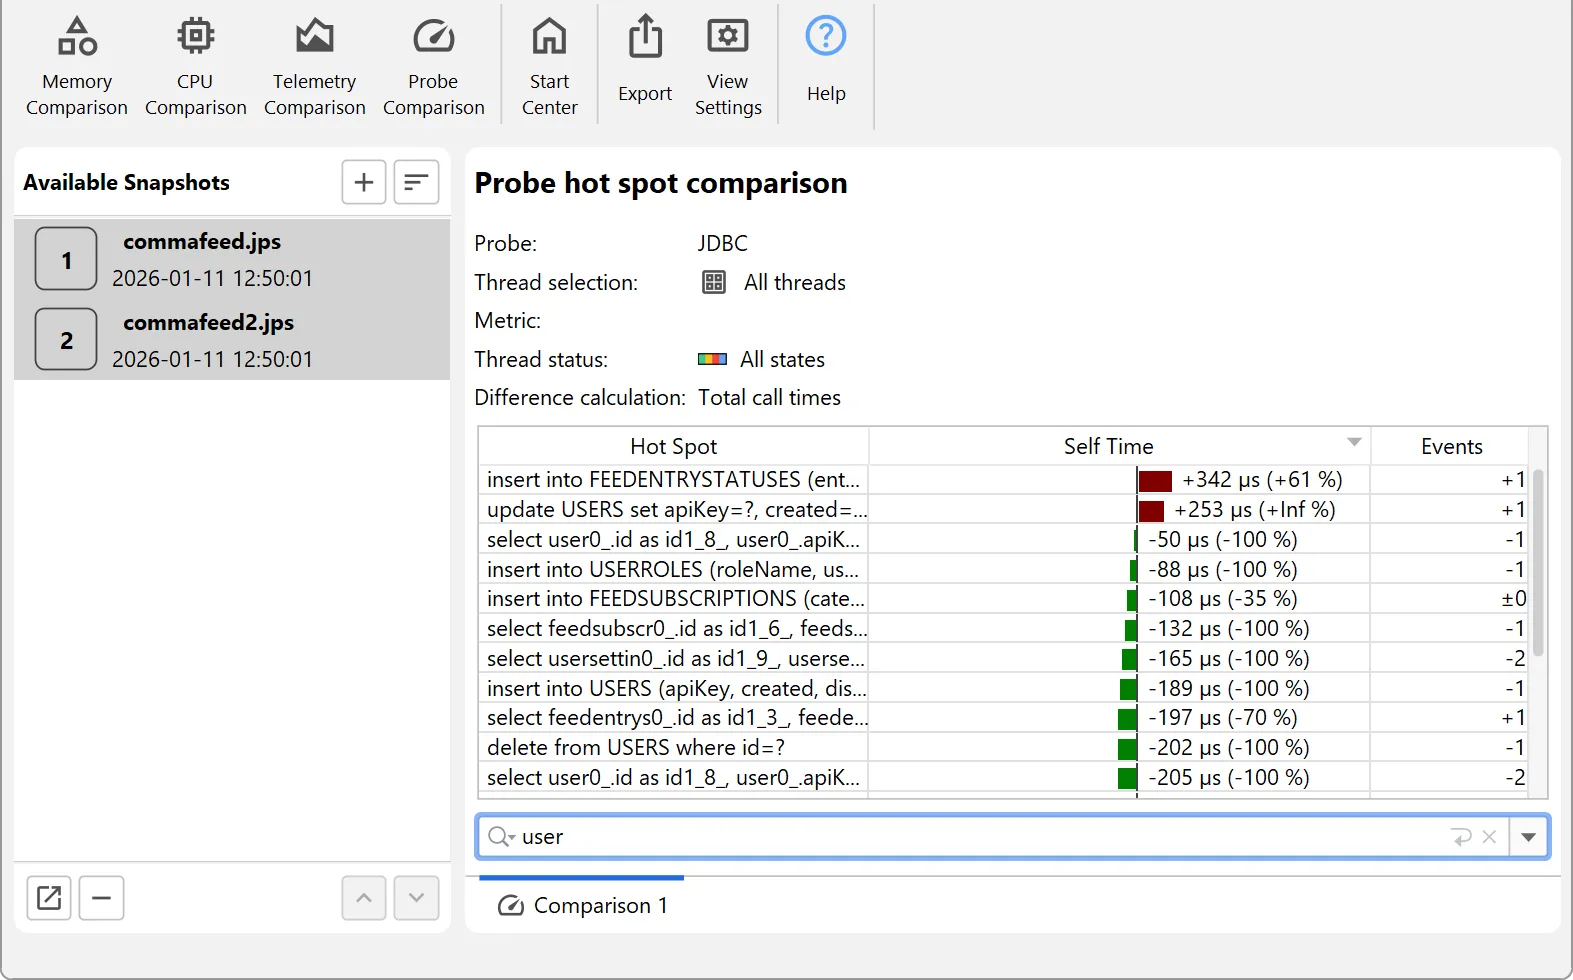
JDBC 및 JPA 심층 분석
데이터베이스 호출은 성능 문제의 주요 원인입니다. JProfiler를 사용하면 그 어느 때보다 빠르게 문제를 찾아 해결할 수 있습니다.
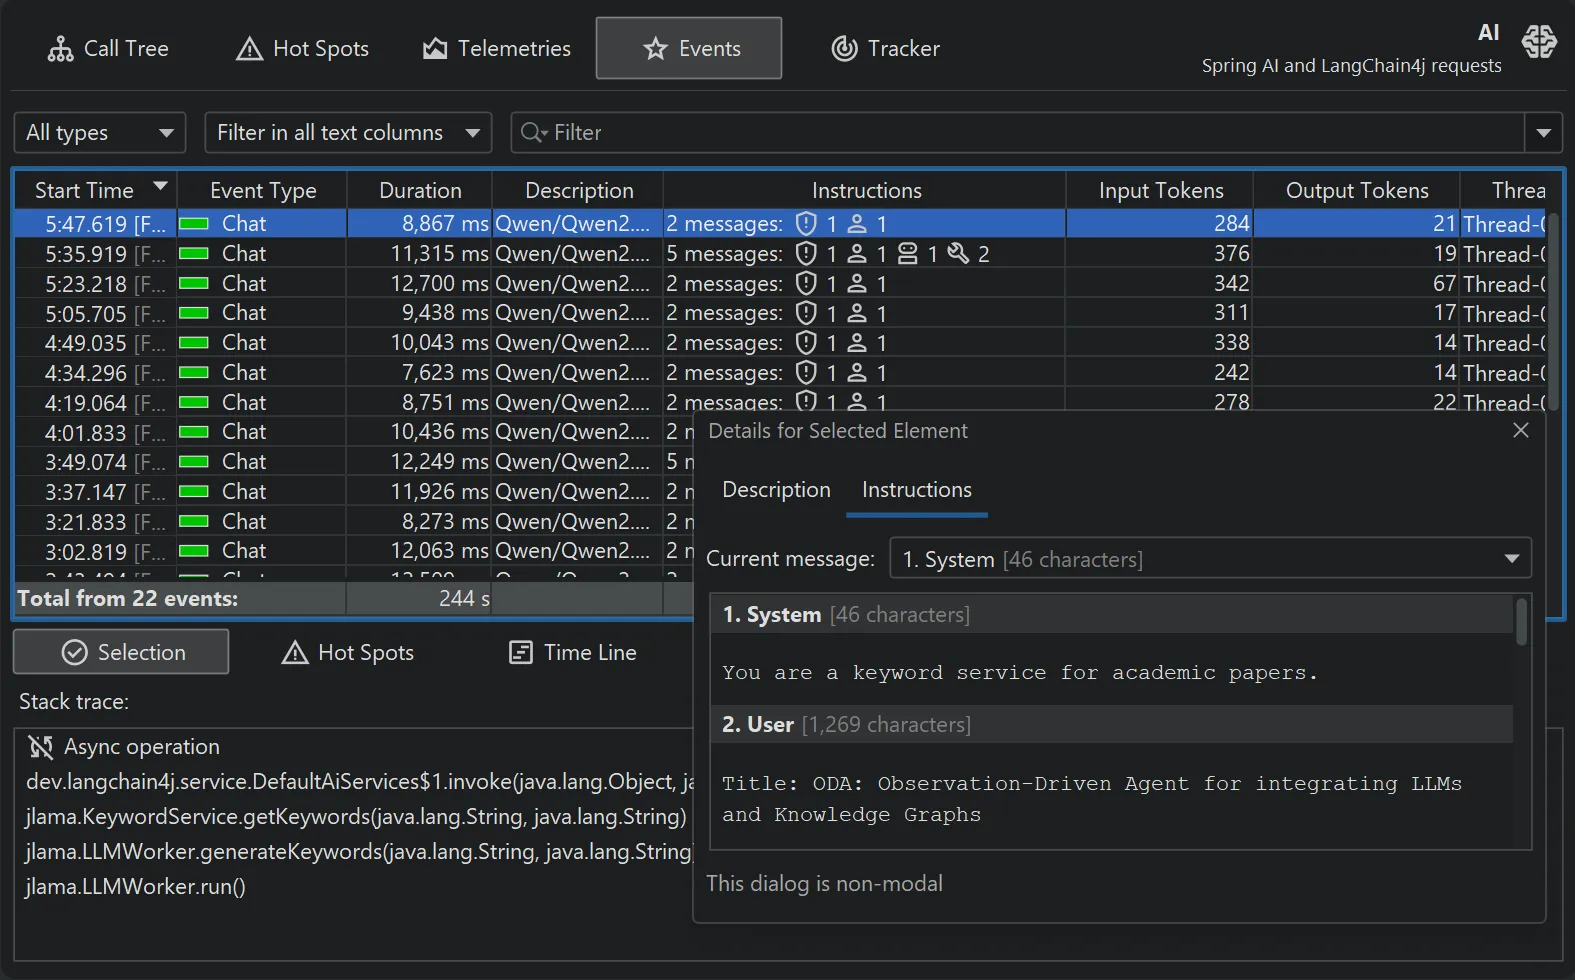
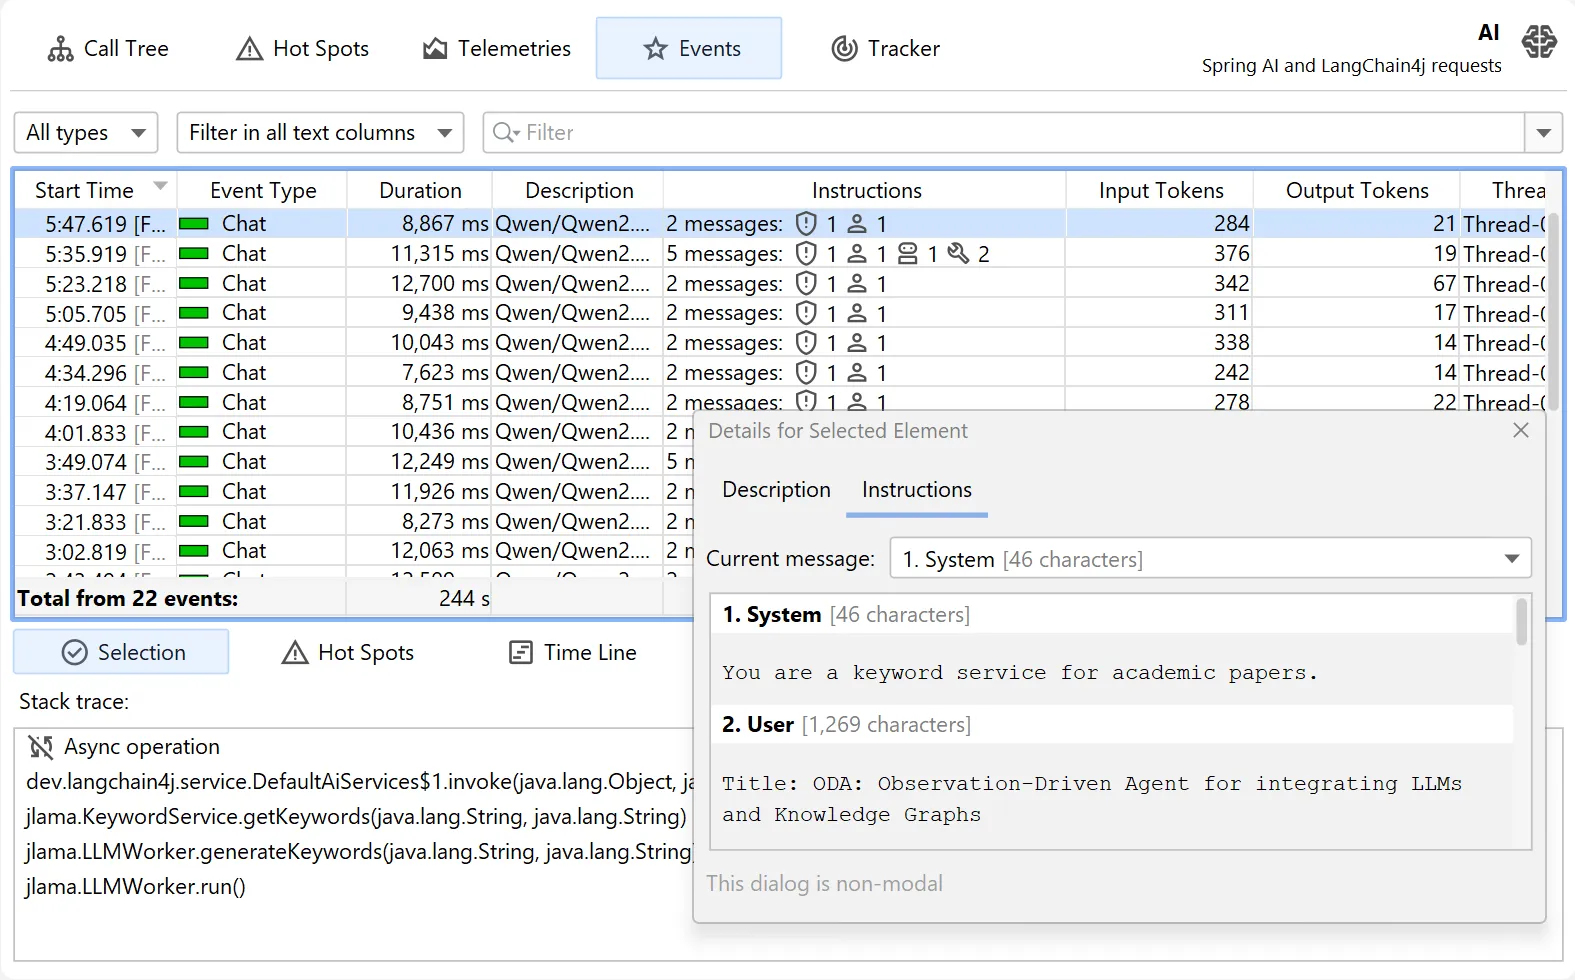
최고 수준의 AI 관측 가능성
에이전트형 애플리케이션을 위한 컨텍스트 인식 메트릭을 분석합니다. JProfiler는 비용 최소화와 LLM 성능 최적화에 도움을 줍니다.
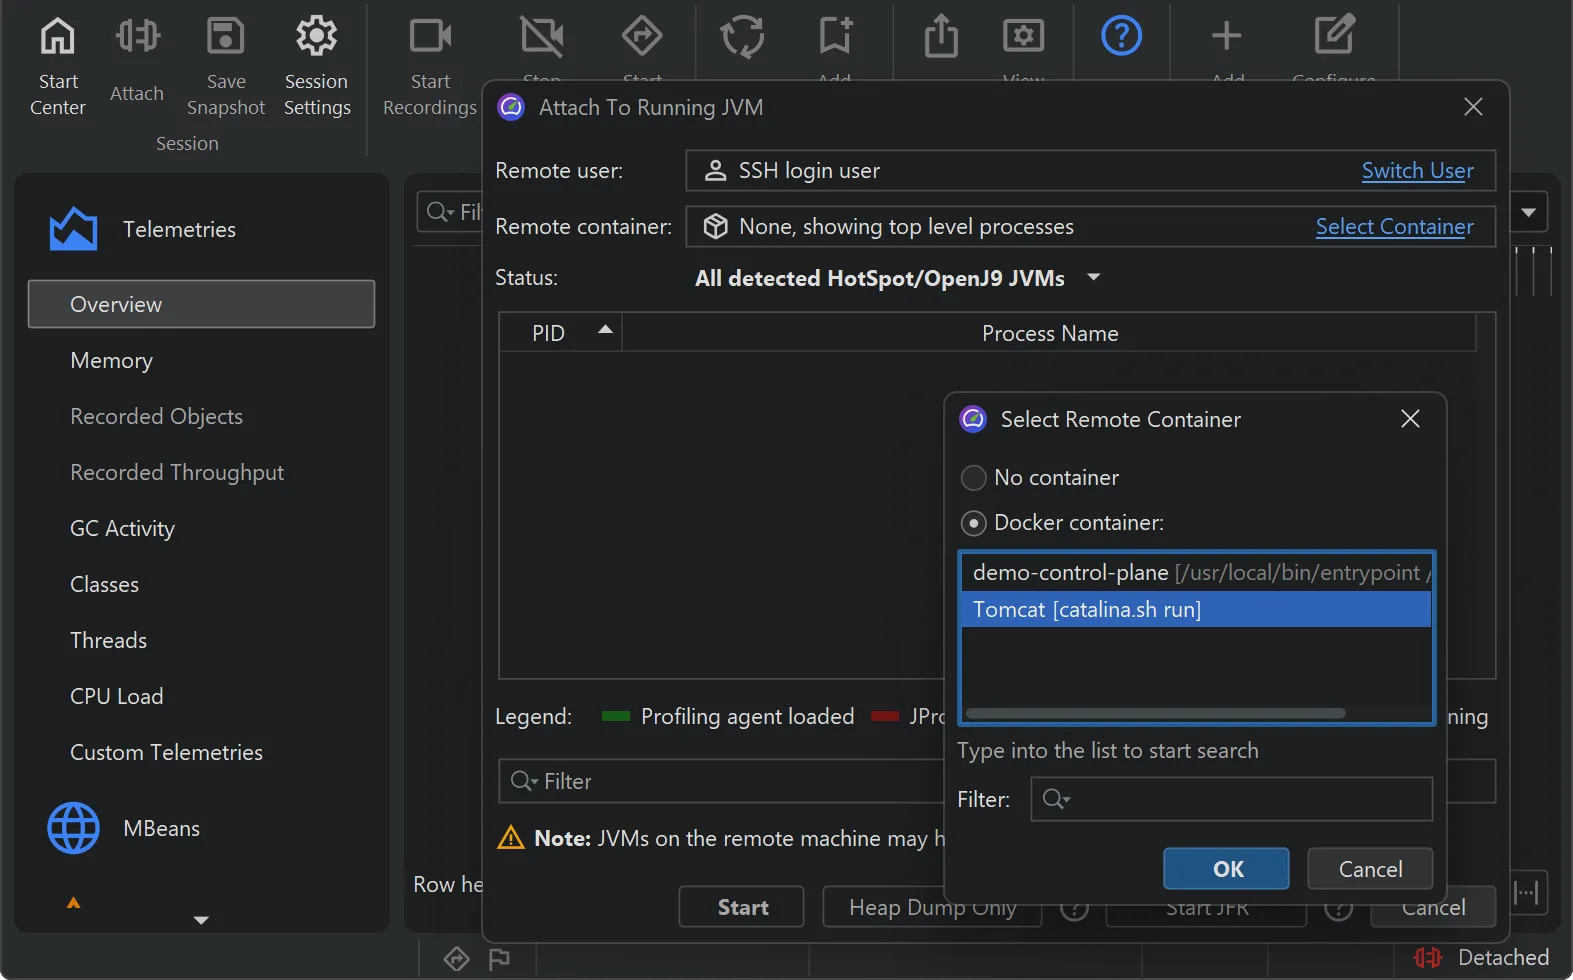
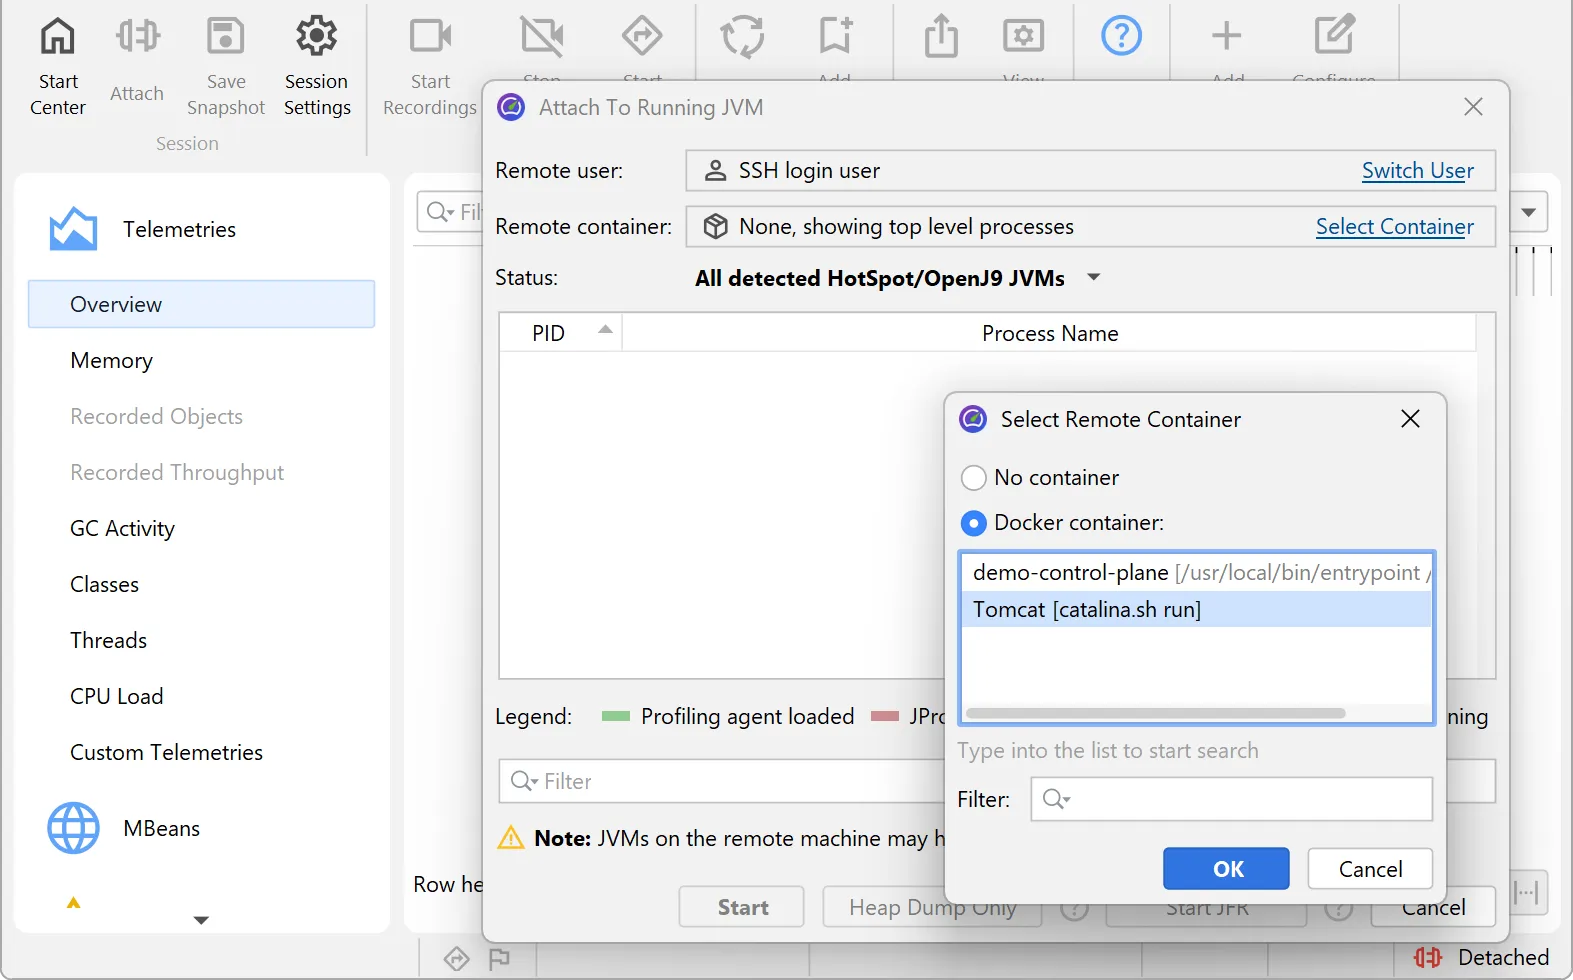
Kubernetes 및 Docker 기본 지원
컨테이너에서 실행 중인 JVM 프로파일링은 어려울 필요가 없습니다. 번거로운 설정 없이 UI에서 직접 선택하세요.
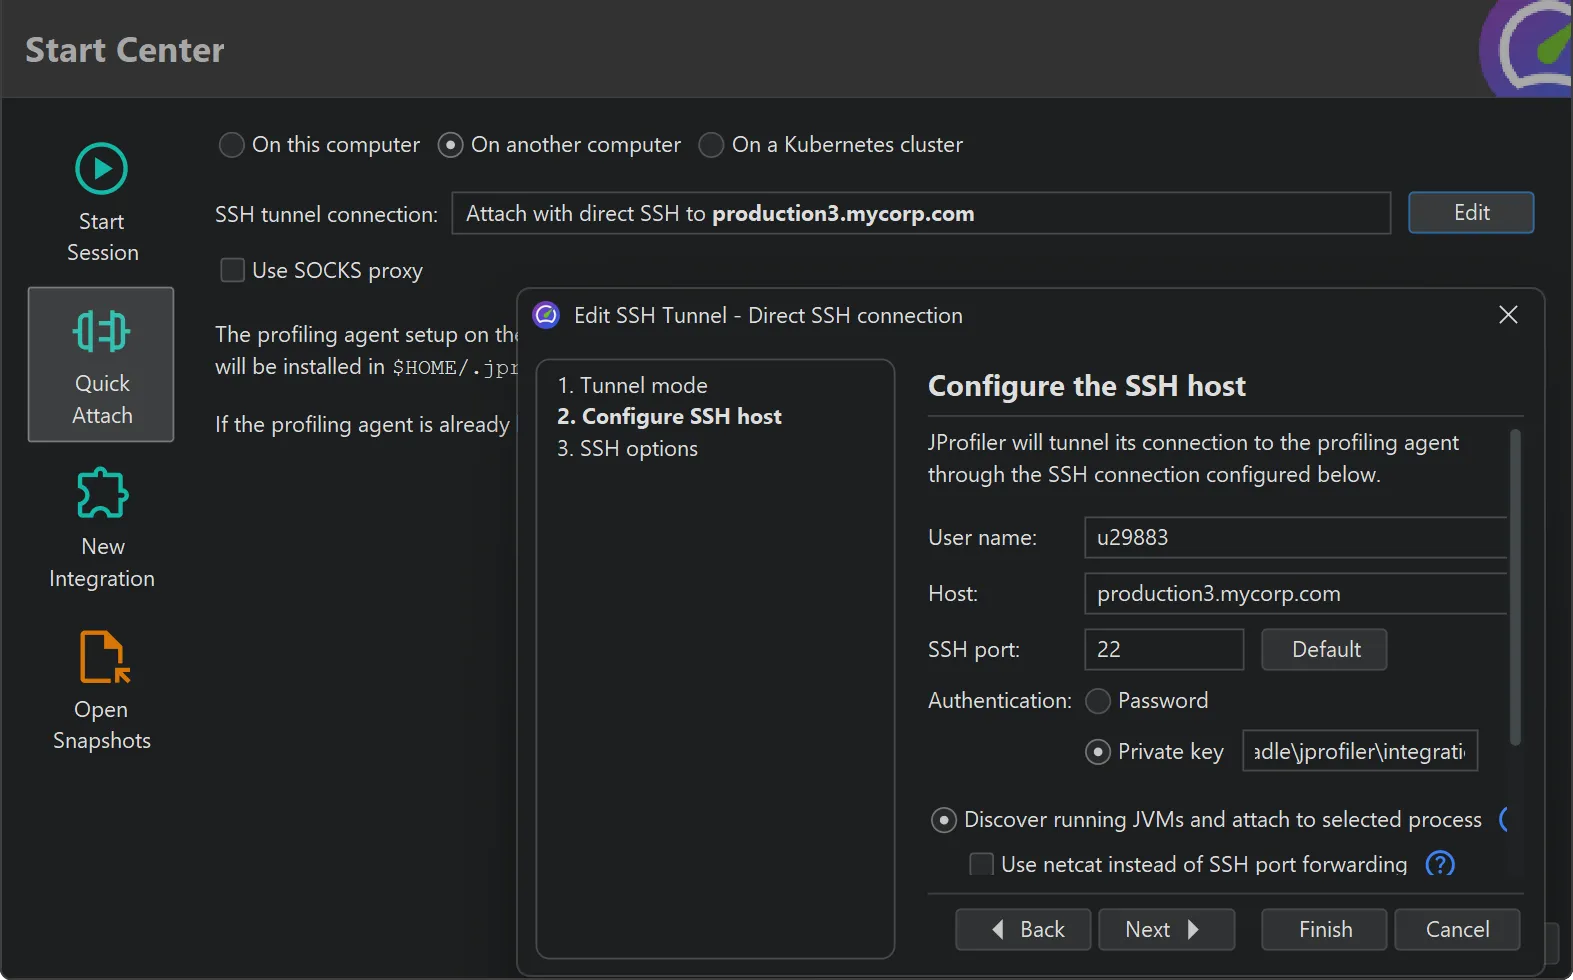
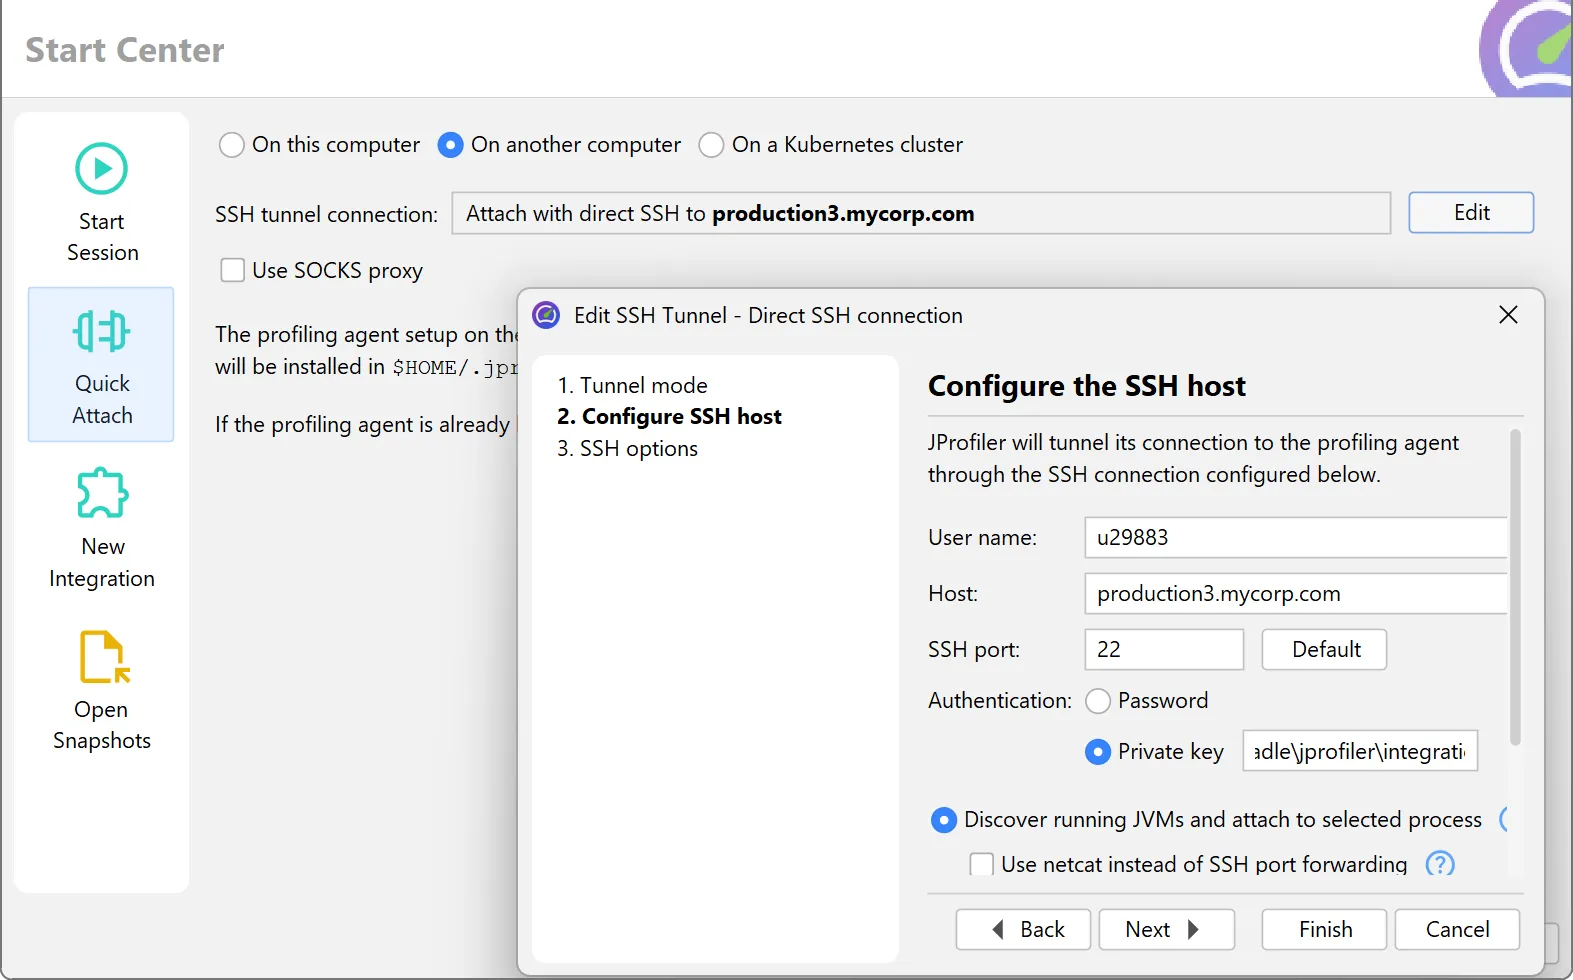
설정 없는 원격 프로파일링
SSH 자격 증명으로 원격 JVM을 즉시 프로파일링할 수 있습니다. 원격 설치나 에이전트 배포가 필요하지 않습니다.
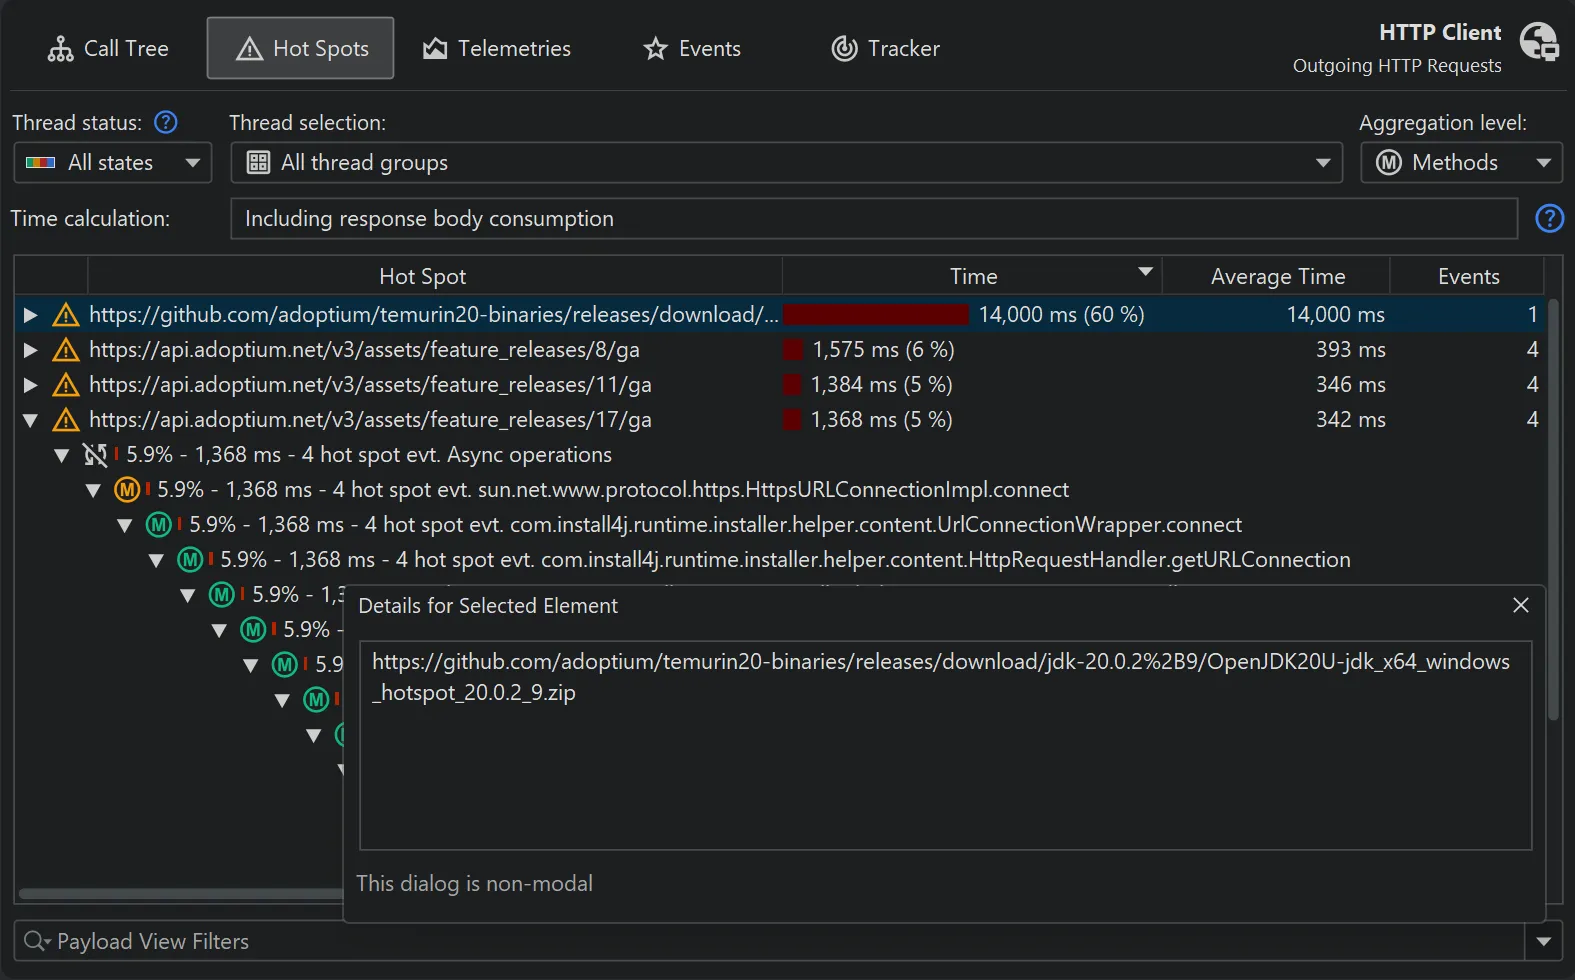
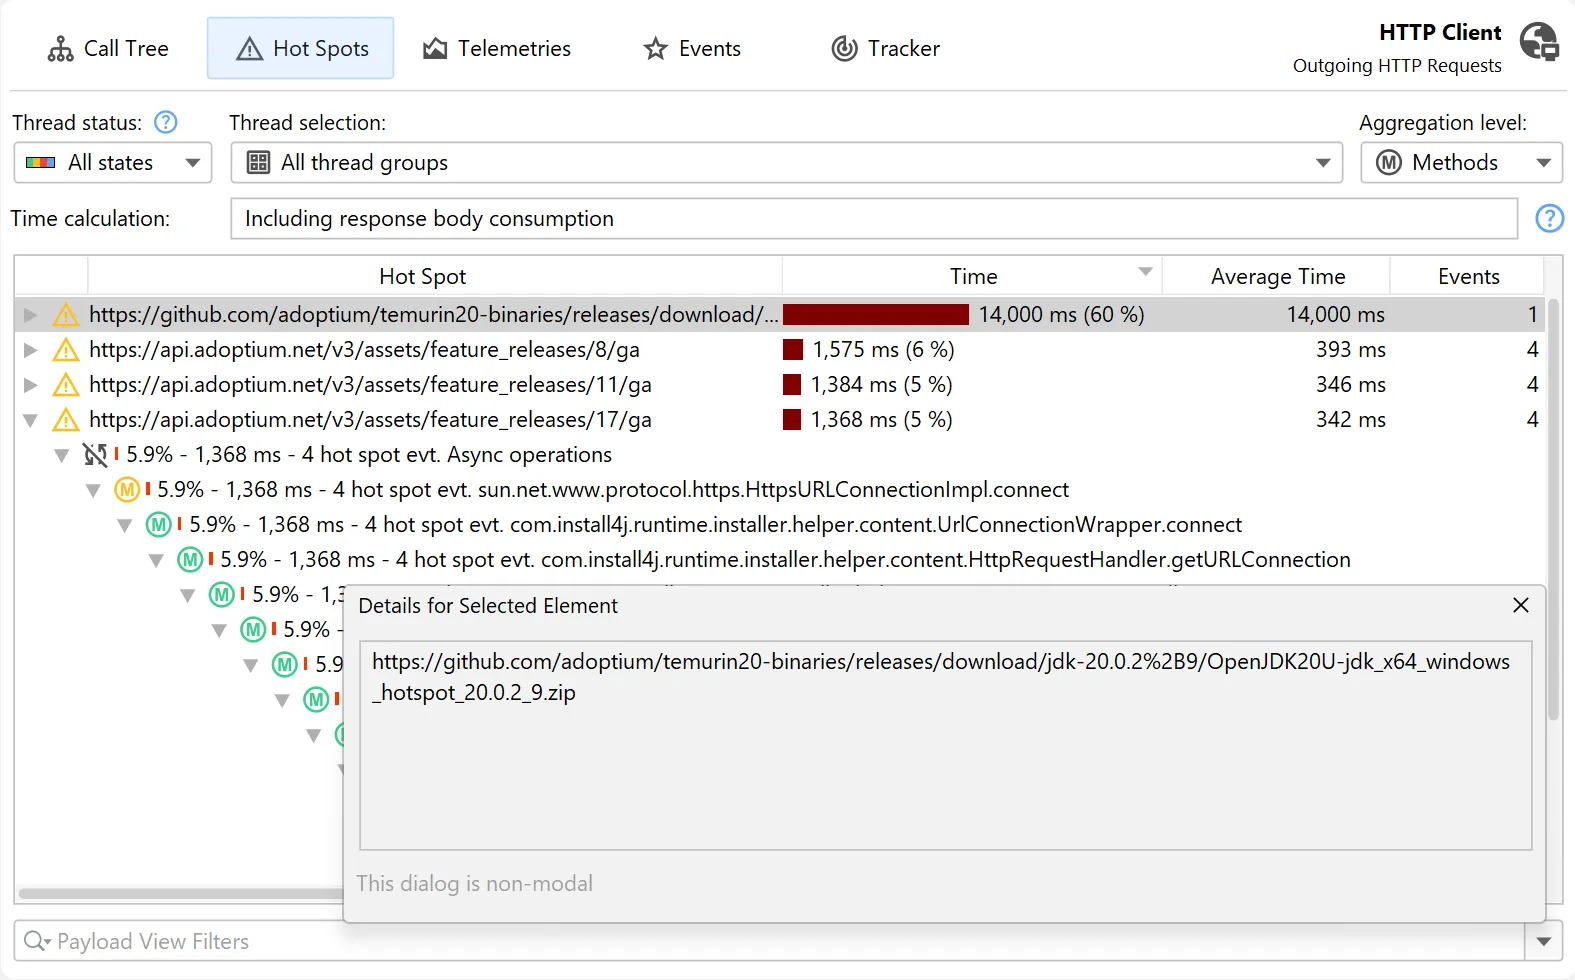
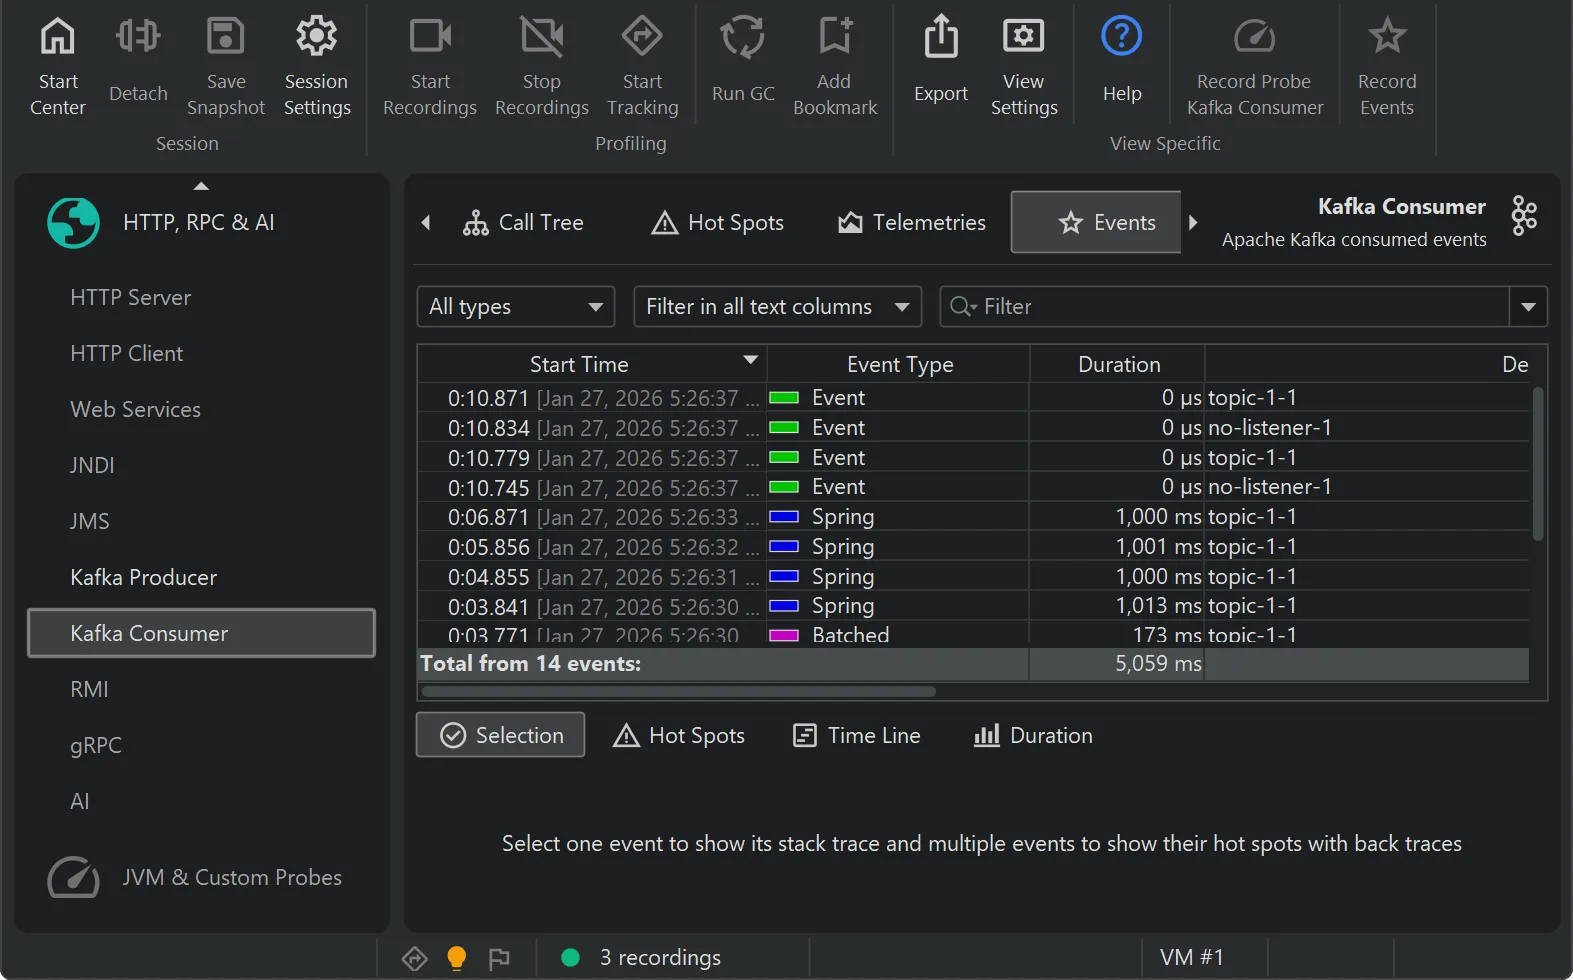
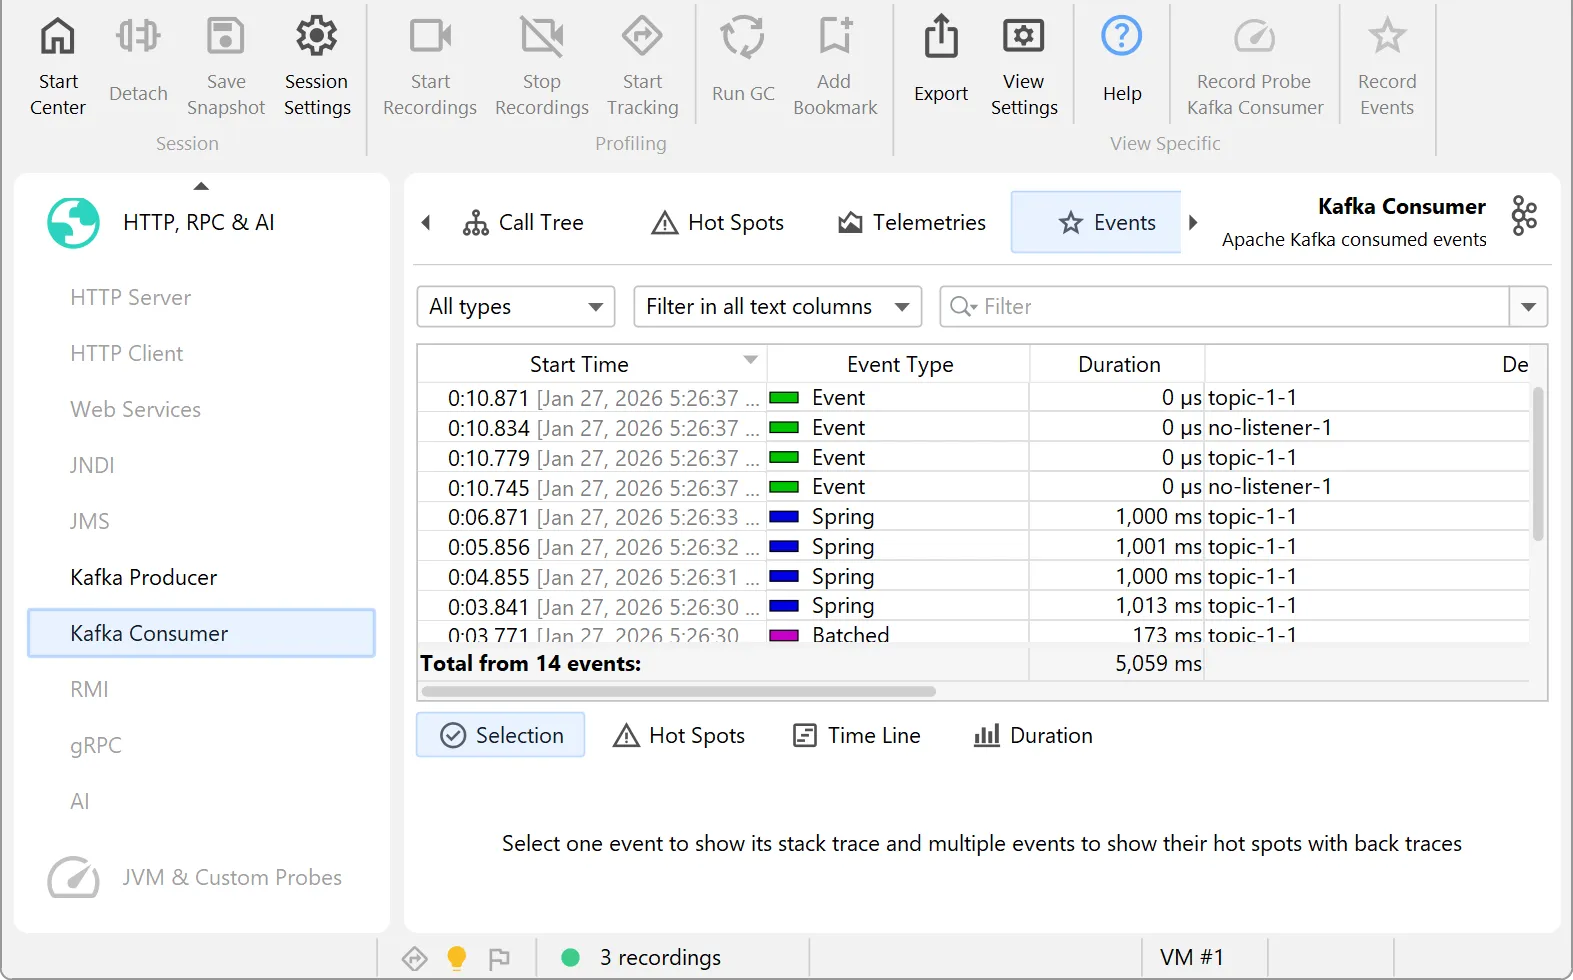
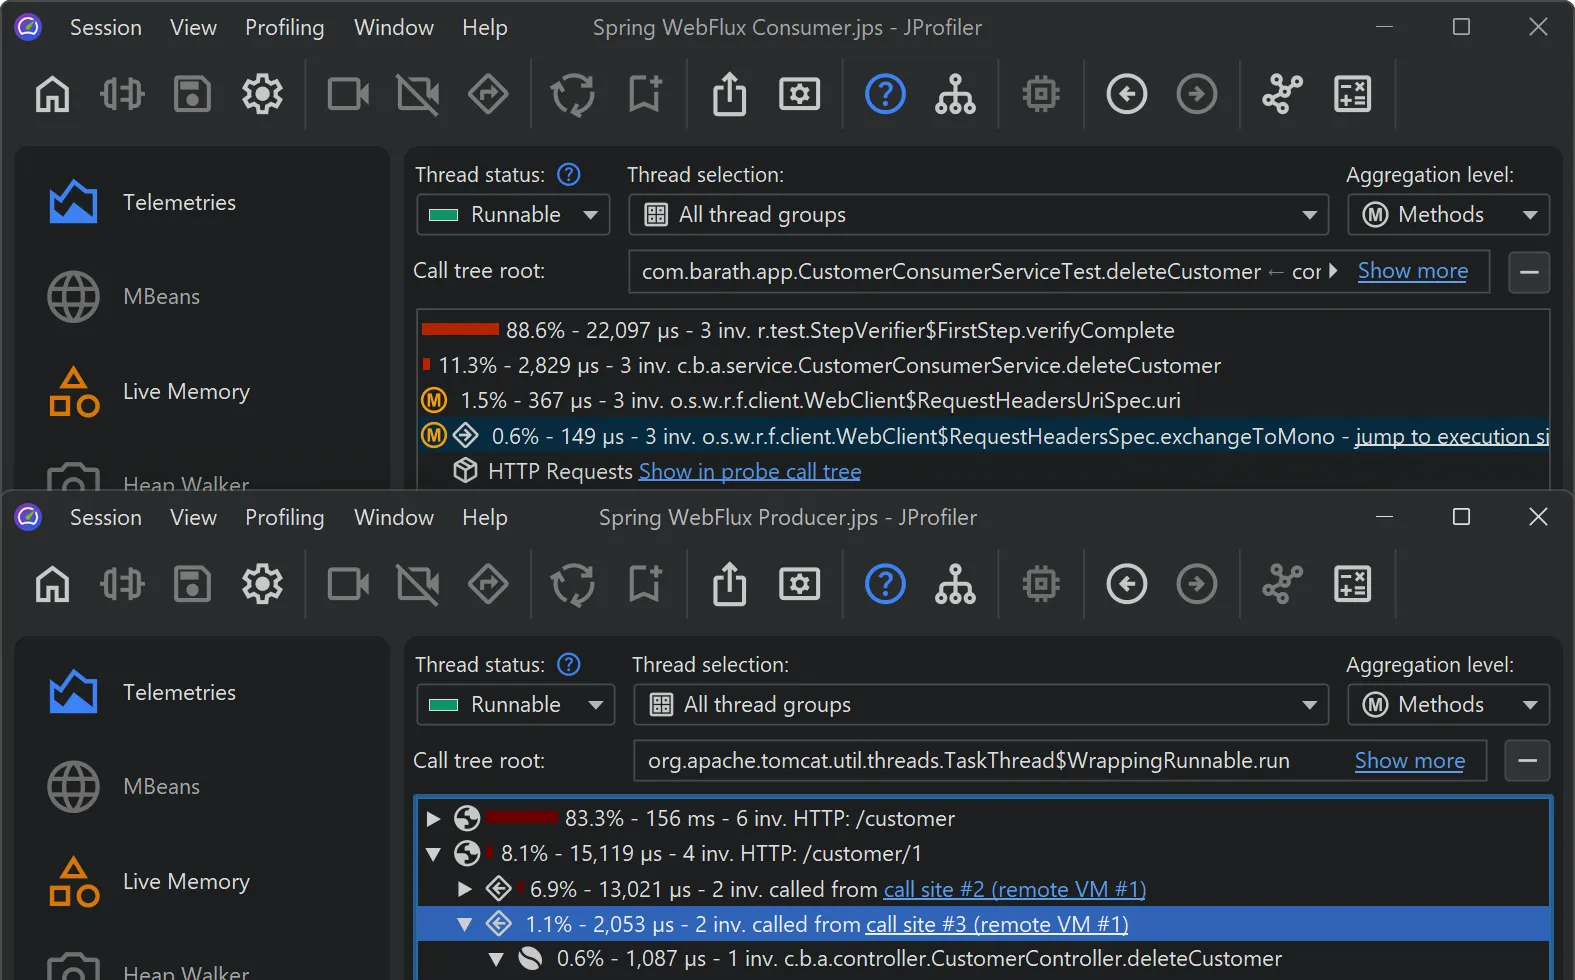
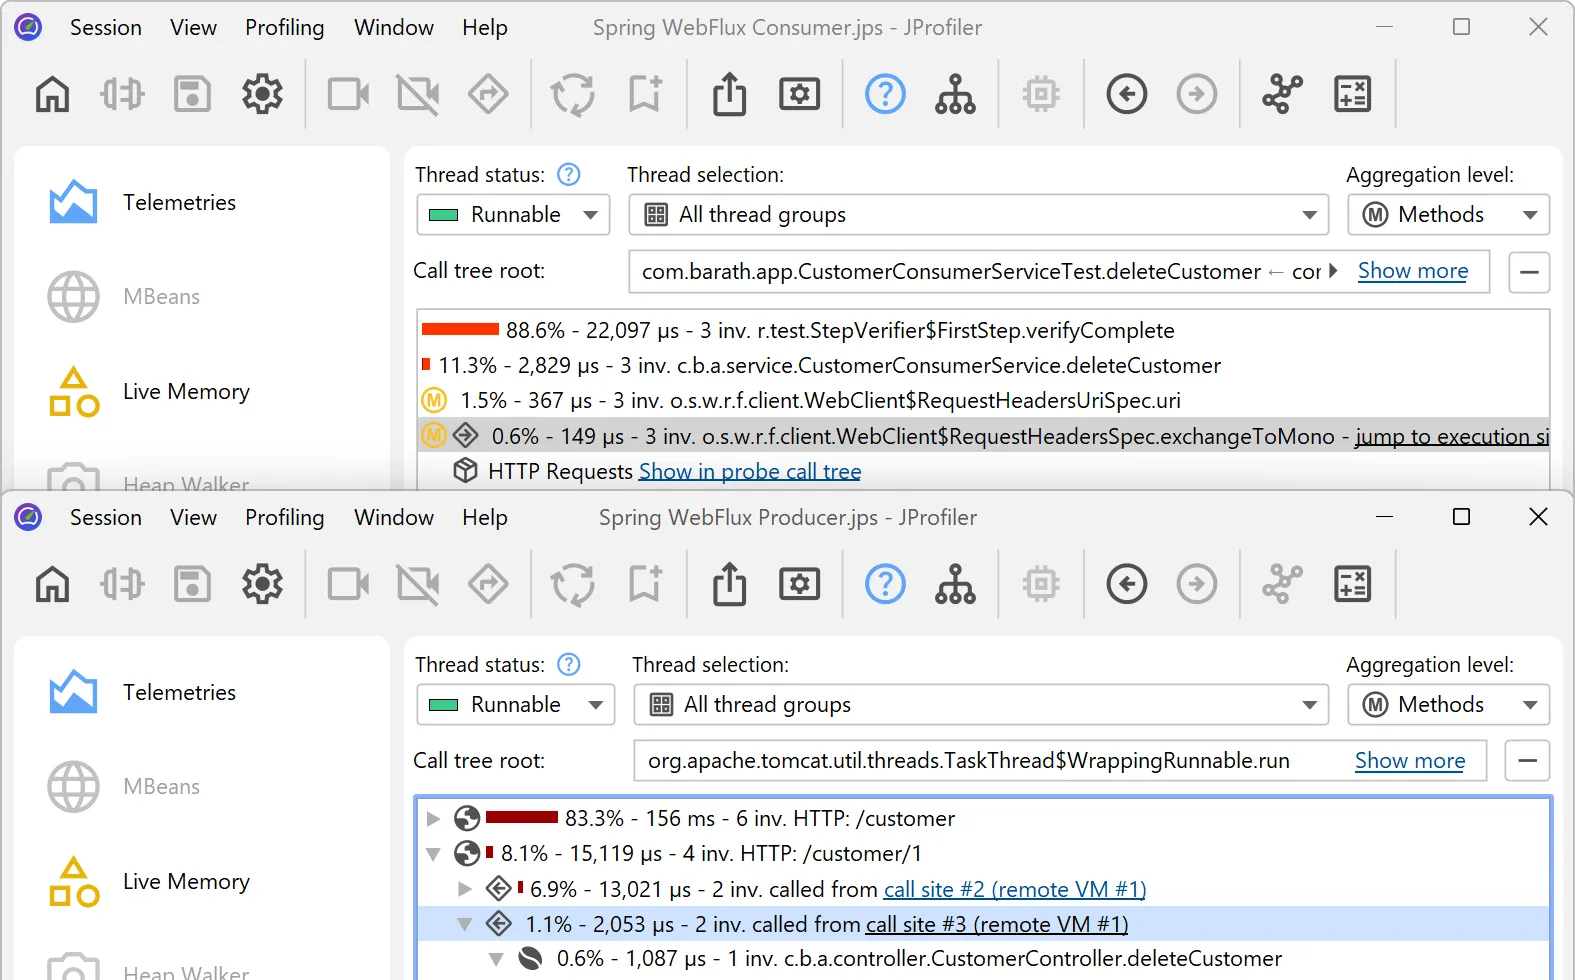
고급 HTTP 호출 프로파일링
JProfiler는 HTTP 성능 분석의 최고 도구로, JVM 경계를 넘는 인바운드 및 아웃바운드 호출까지 모두 다룹니다.
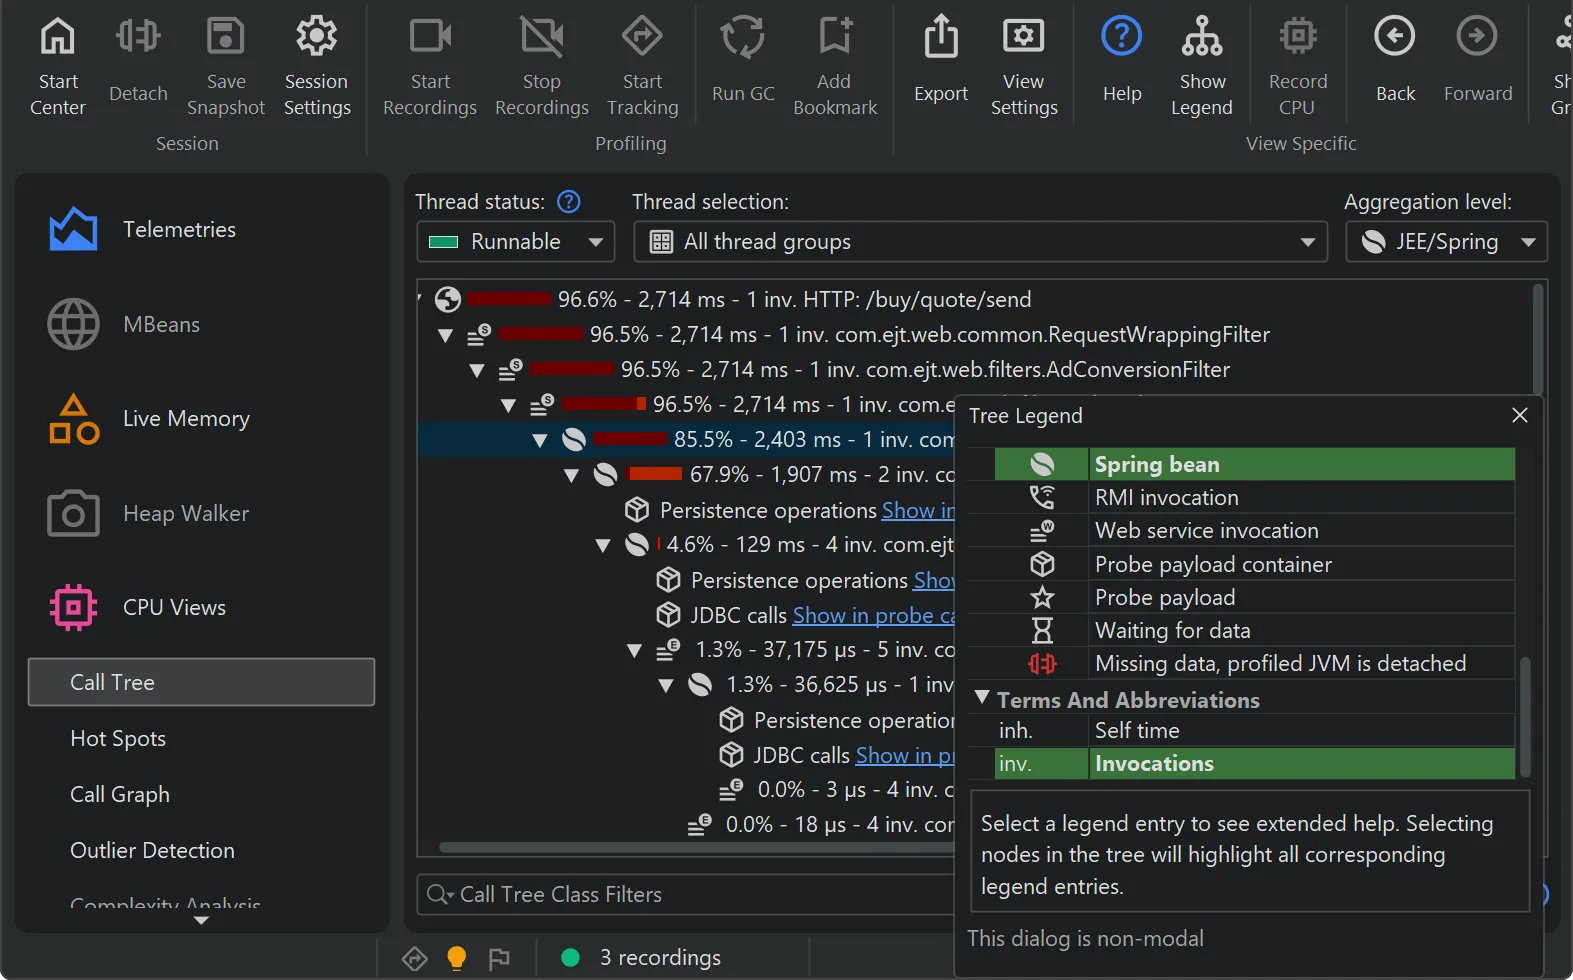
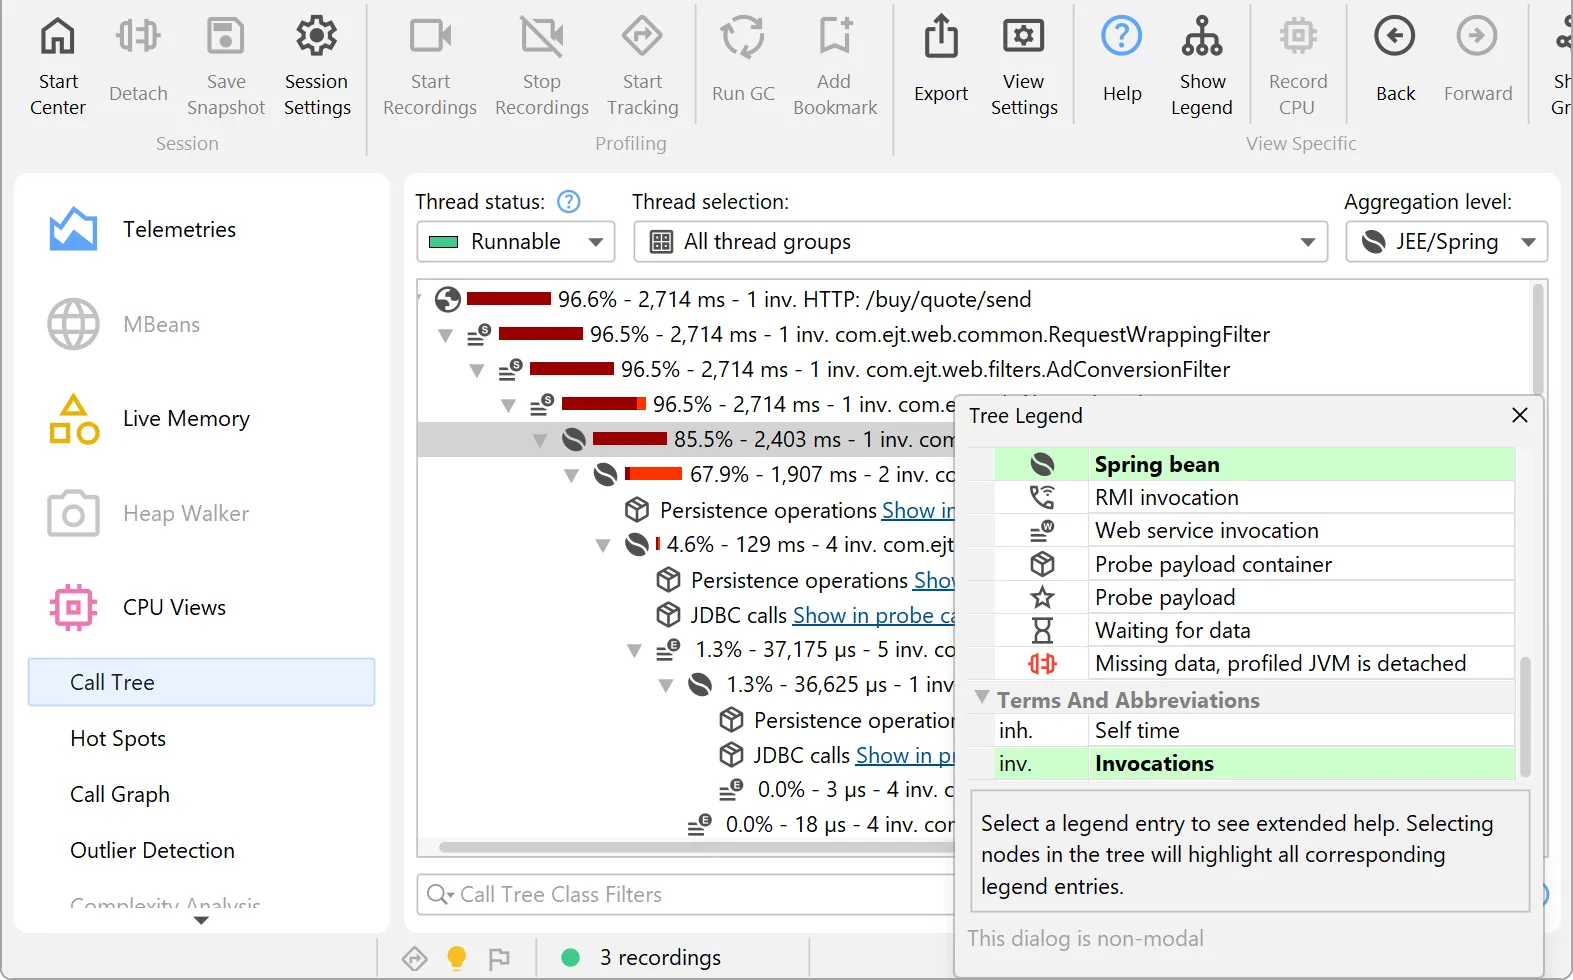
뛰어난 Spring 및 JEE 지원
JProfiler는 Spring과 JEE 컴포넌트를 이해하여 고수준 컨텍스트와 저수준 메서드 호출 데이터를 결합합니다.
... 그리고 더 많은 기능
JProfiler로 시간과 비용을 절약하세요
JProfiler 비용은 놀랍도록 빠르게 회수됩니다

시장 최고의 프로파일링 도구로 생산성을 한 단계 높이세요. JProfiler를 통해 다음을 할 수 있습니다:
- 비즈니스 로직에 시간 집중
- 실제로 중요한 부분의 성능 및 메모리 문제 해결
- "스케일되지 않는 일부터 먼저 하고 나중에 개선하라" — Paul Graham

많은 고객이 클라우드 비용을 절반으로 줄였습니다. JProfiler를 통해 다음을 할 수 있습니다:
- 리소스 사용량 최적화
- 데이터 전송량 감소
- CPU 및 메모리 요구 사항 최소화

프로덕션이 중단되면 매 초가 중요합니다. JProfiler를 통해 다음을 할 수 있습니다:
- 강력한 원격 연결(attach) 기능으로 라이브 시스템 프로파일링
- 고급 프로브로 개별 사례를 실시간으로 디버깅
- JFR, HPROF 같은 사후 분석 스냅샷을 JProfiler의 모든 기능으로 분석
사용자 후기
전 세계 30,000명이 넘는 고객과 포춘 500대 기업의 75% 이상이 JProfiler를 사용합니다.

“I recently evaluated JProfiler to identify some performance issues in an app I'm working on in my current consulting gig. I had been banging my head against the wall trying to get tools like VisualVM working against the IBM JVMs that the client uses and then I tried JProfiler. With the IDE plugin support it provides, it just worked and in the last day or so, I've been able to easily identify sources for all our major performance problems.”
“What started out as a search for a memory leak and a trial of JProfiler turned out to be the find of a year. Not only did we find our memory leak, we got started in only minutes of setup work, found slow background processes, reduced server costs and tuned our software to make it faster and more responsive. All this in just a week and a free trial. Given the results it seemed obvious we should add JProfiler to our tool chain!”
“I have evaluated lots of Java profilers. Yours is simply FAN-TA-STIC!. I love the 'live' views and auto-updated profiling information. JProfiler is also the only profiling tool to reliably report time spent in JNI calls, which is very valuable in our Java applications which are JNI intensive.”
스크린캐스트 시청
중요한 사용 사례와 새 기능을 다루는 JProfiler 스크린캐스트를 블로그에 게시하고 있습니다.