JProfiler – No.1のJavaプロファイラー
より速い開発のためにより低いクラウドコストのためにより少ない障害のためにより速い開発のために




JProfilerが選ばれる理由
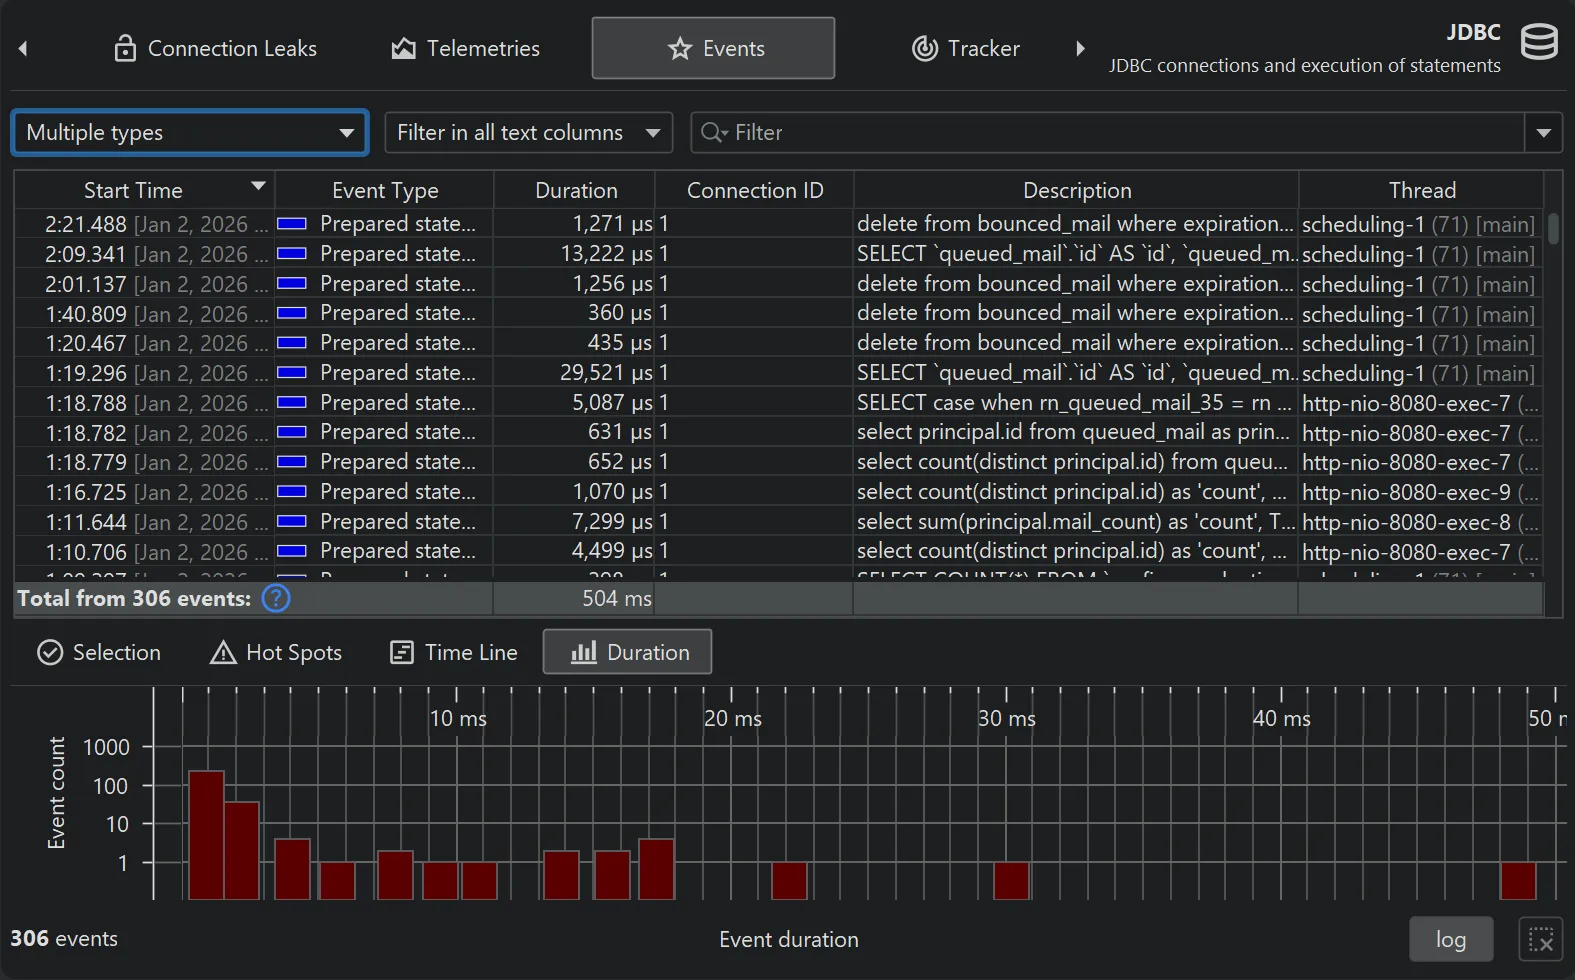
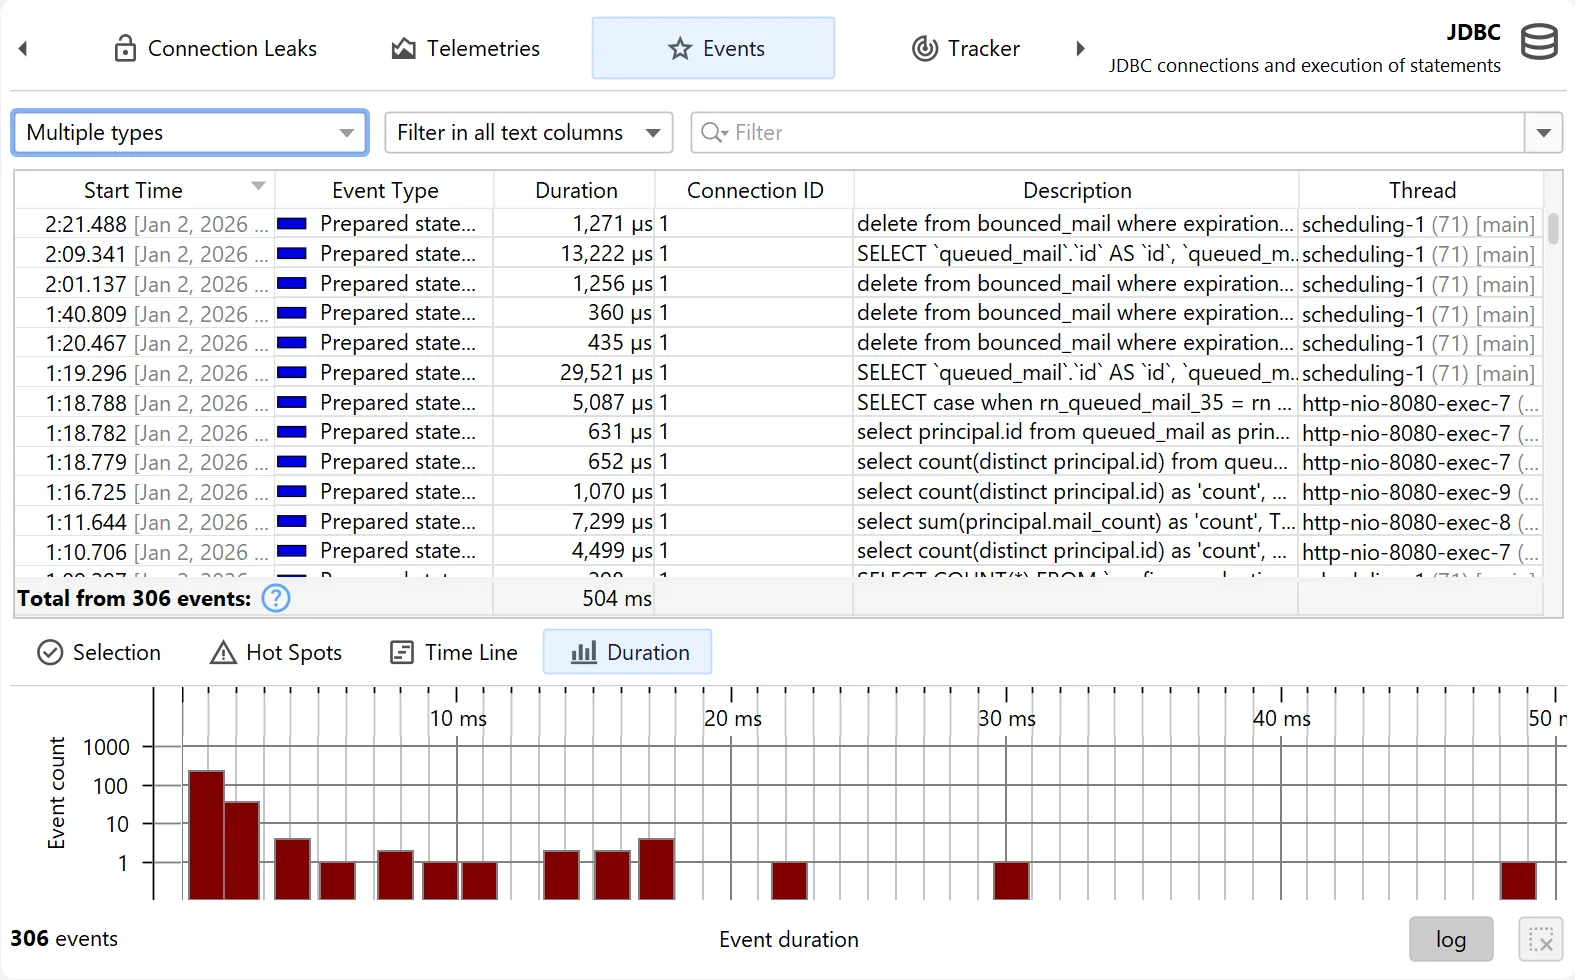
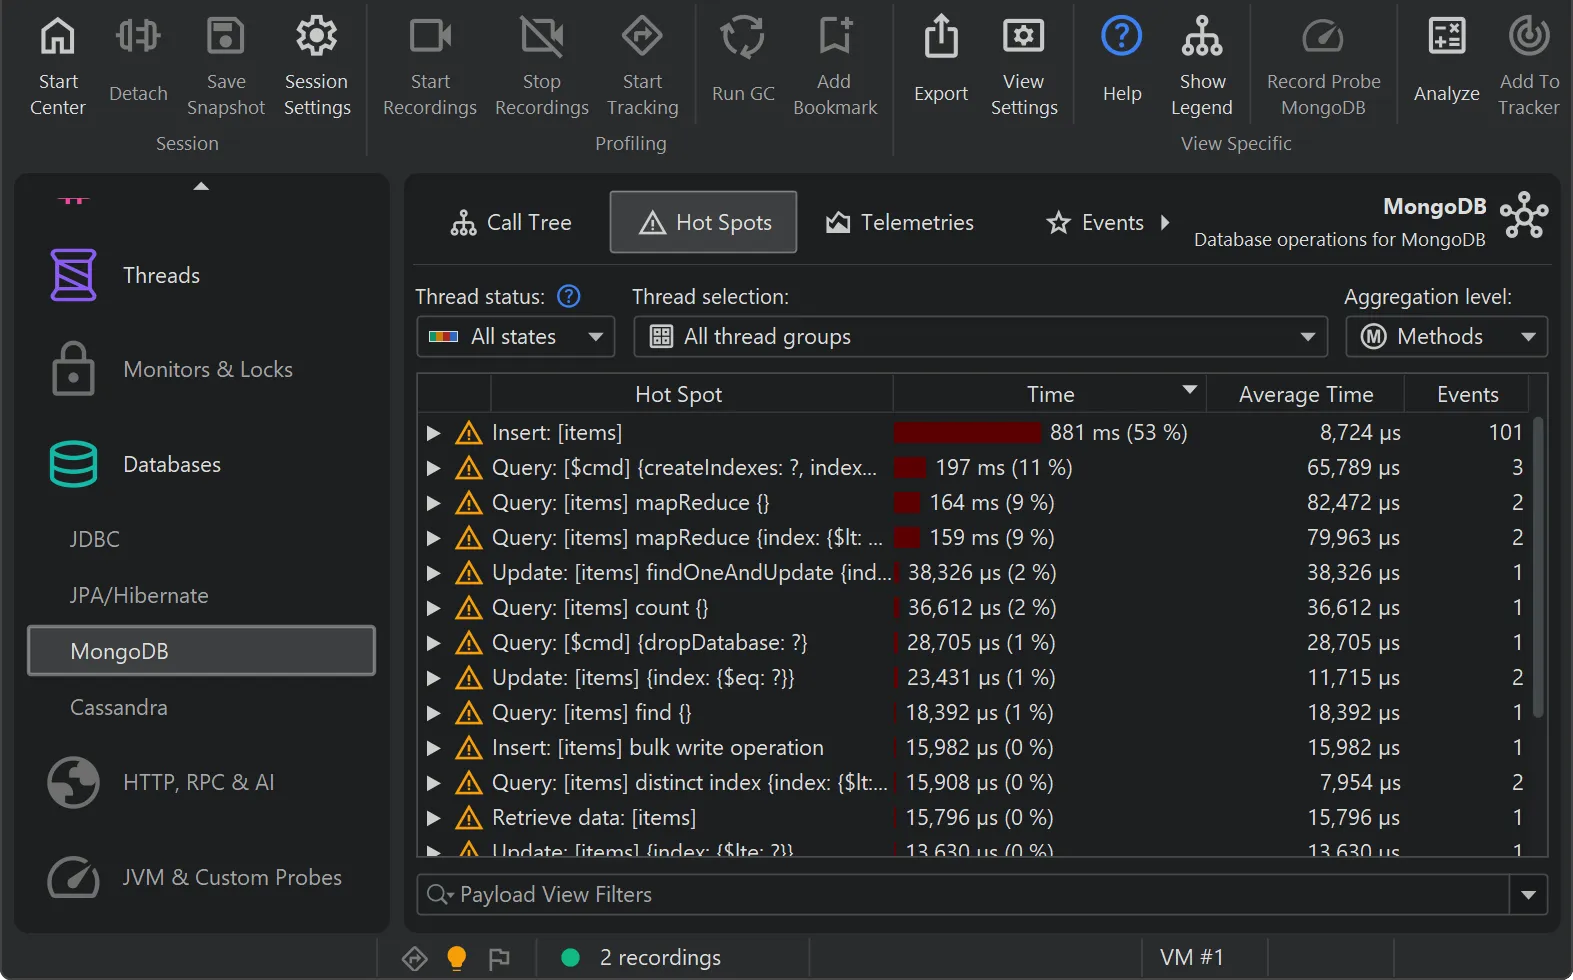
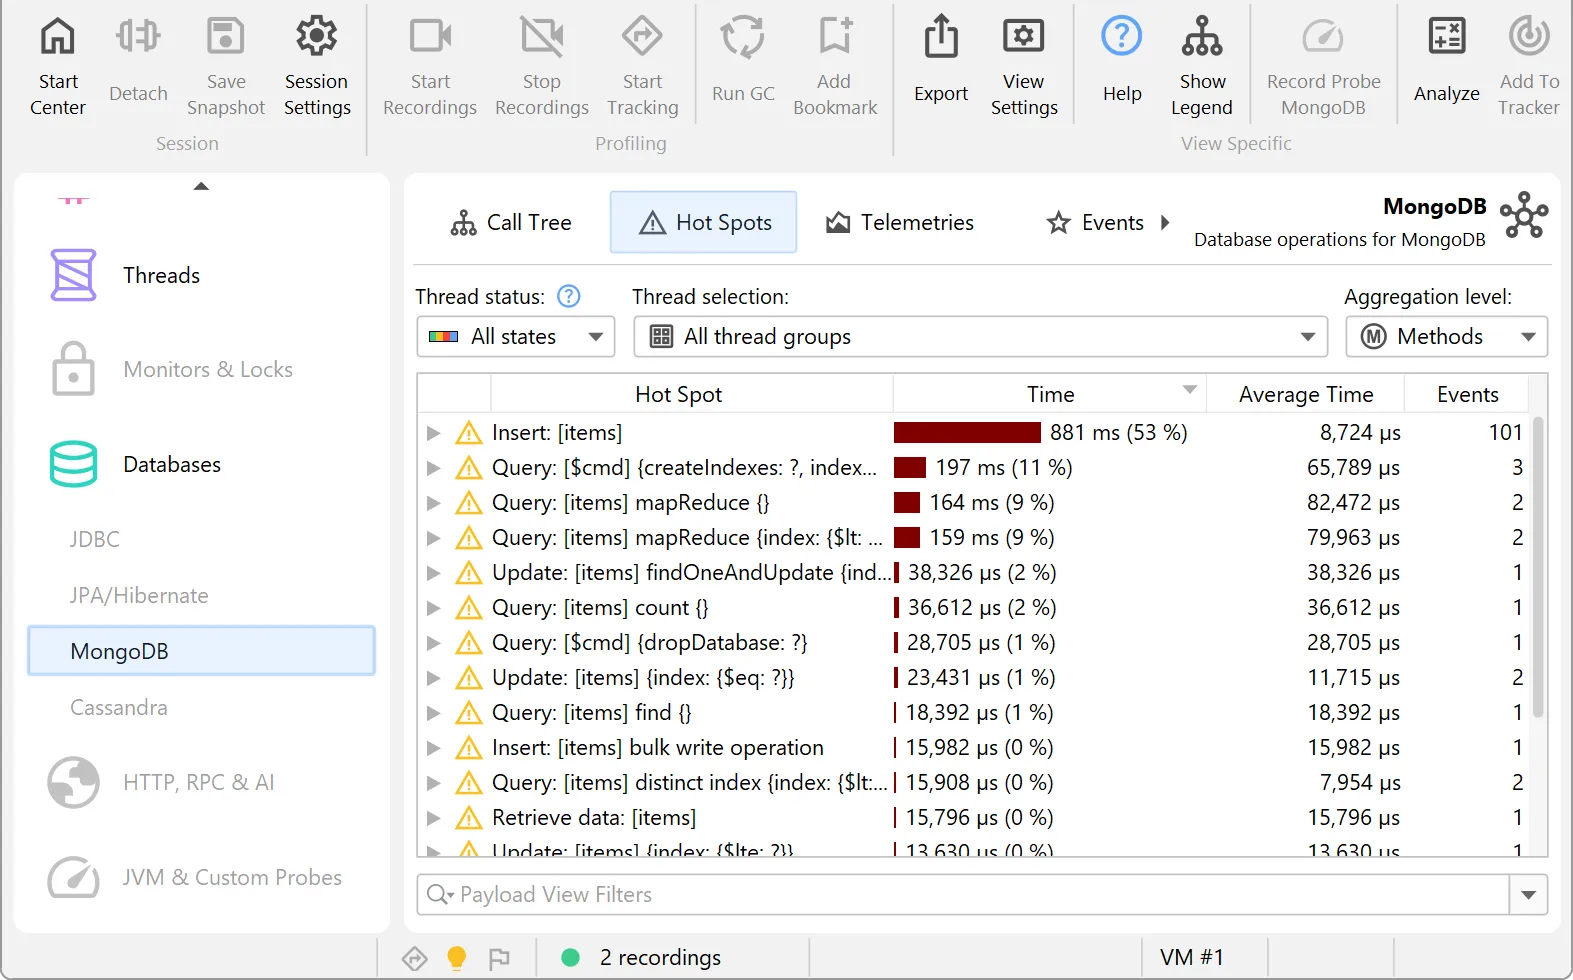
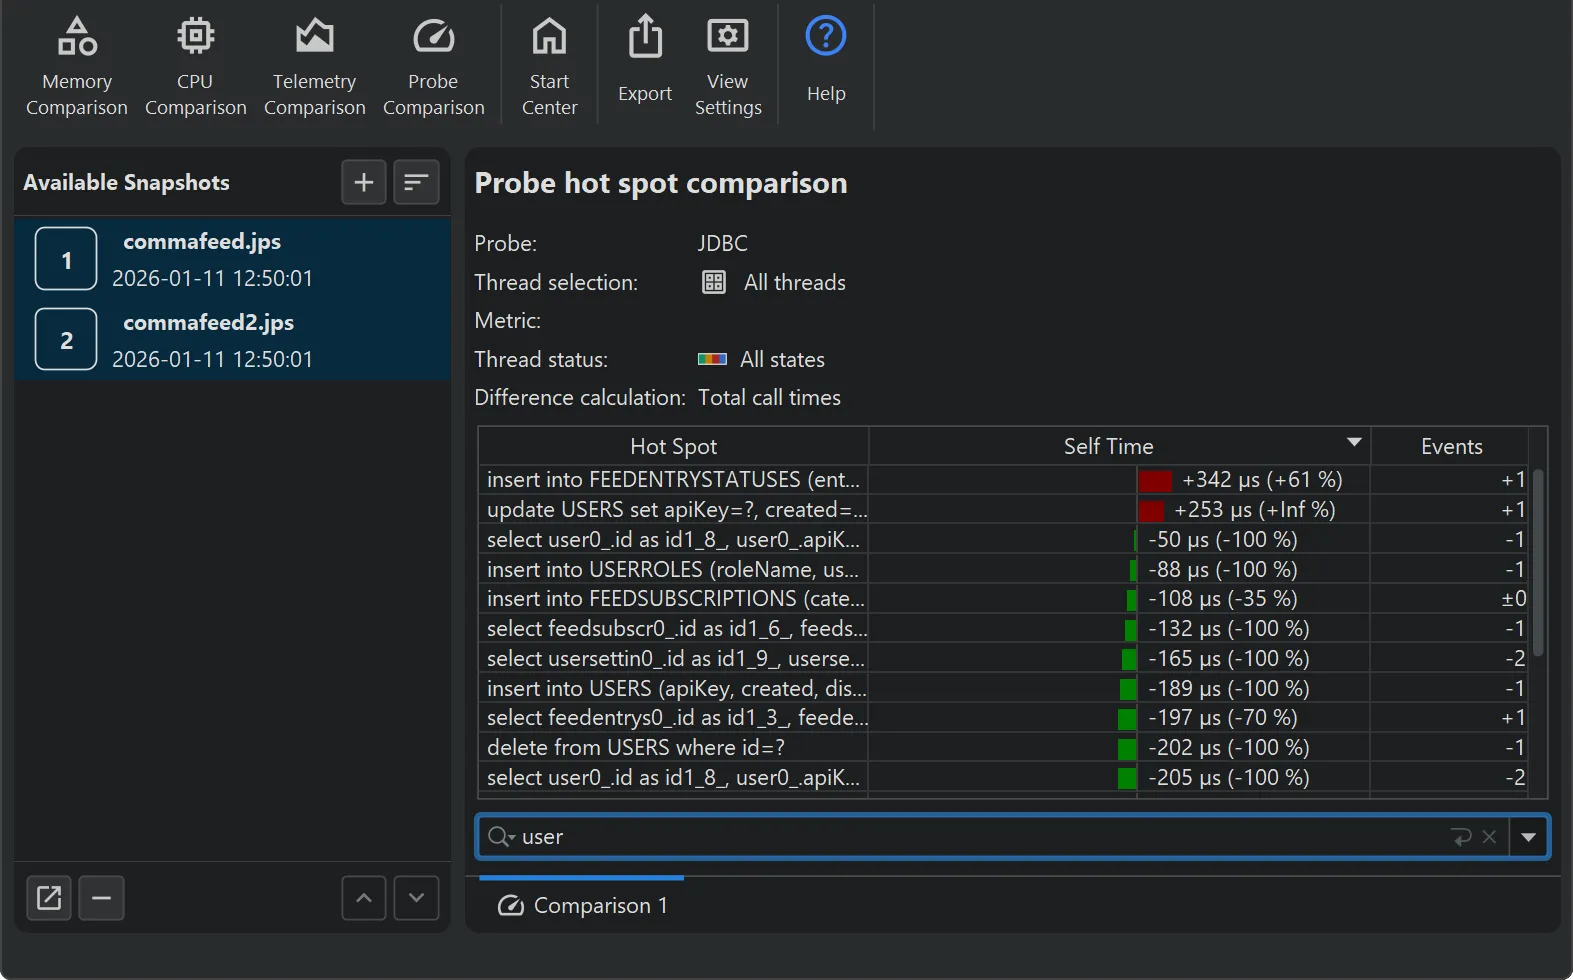
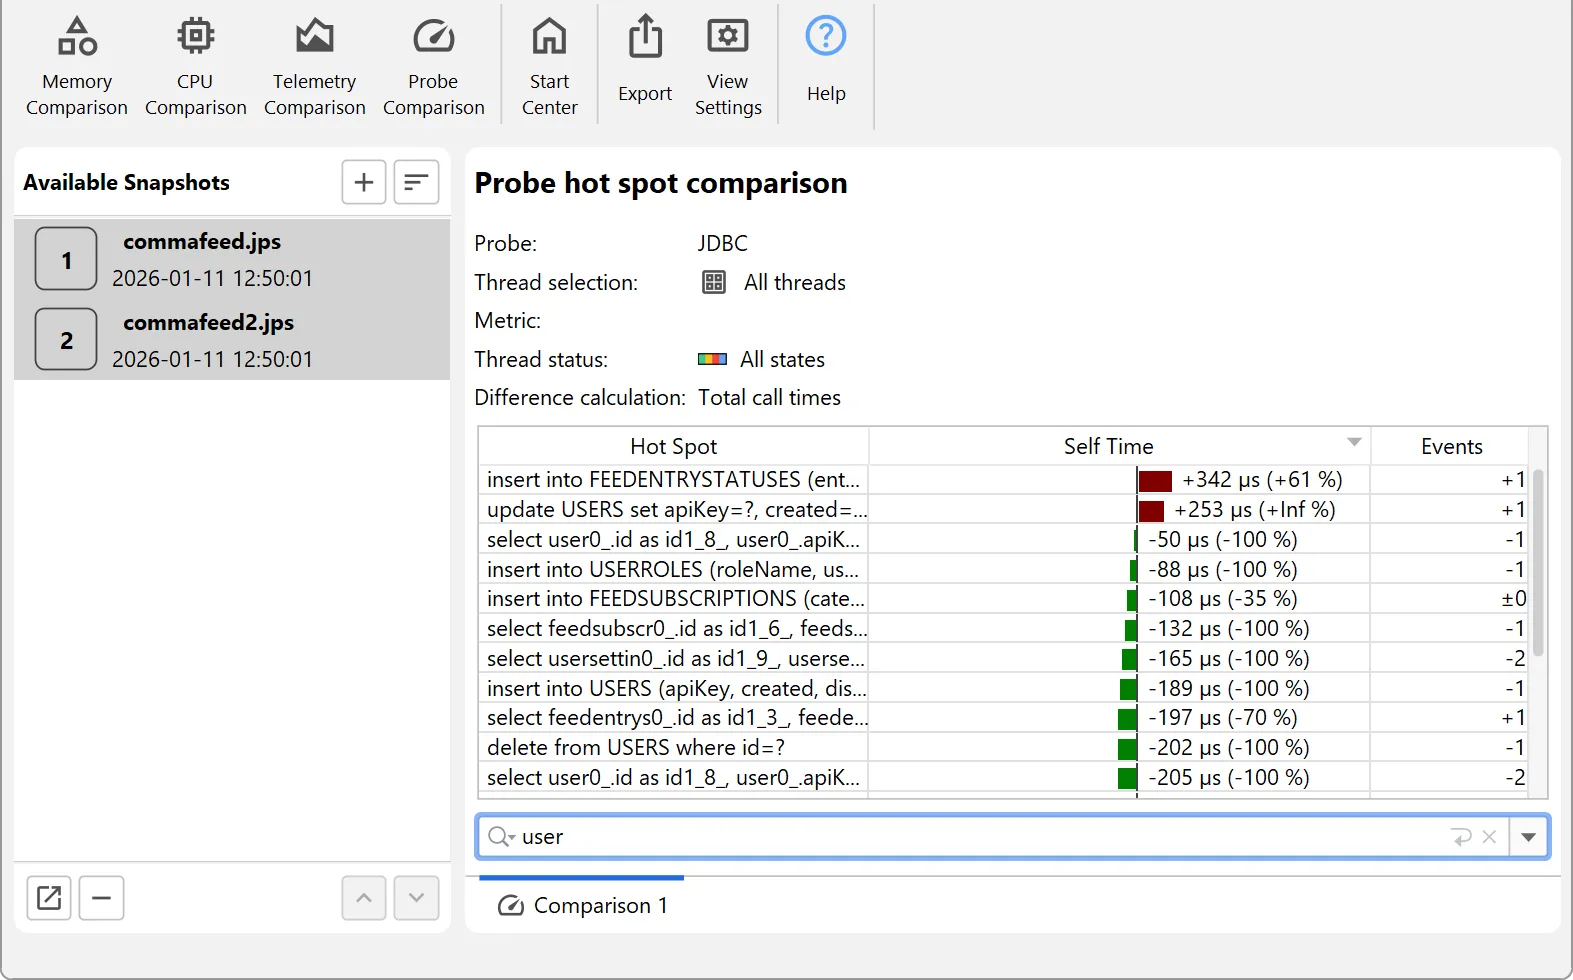
JDBCとJPAの深い洞察
データベース呼び出しはパフォーマンス問題の主な原因です。JProfilerを使用すれば、問題の発見と修正をかつてない速さで行えます。
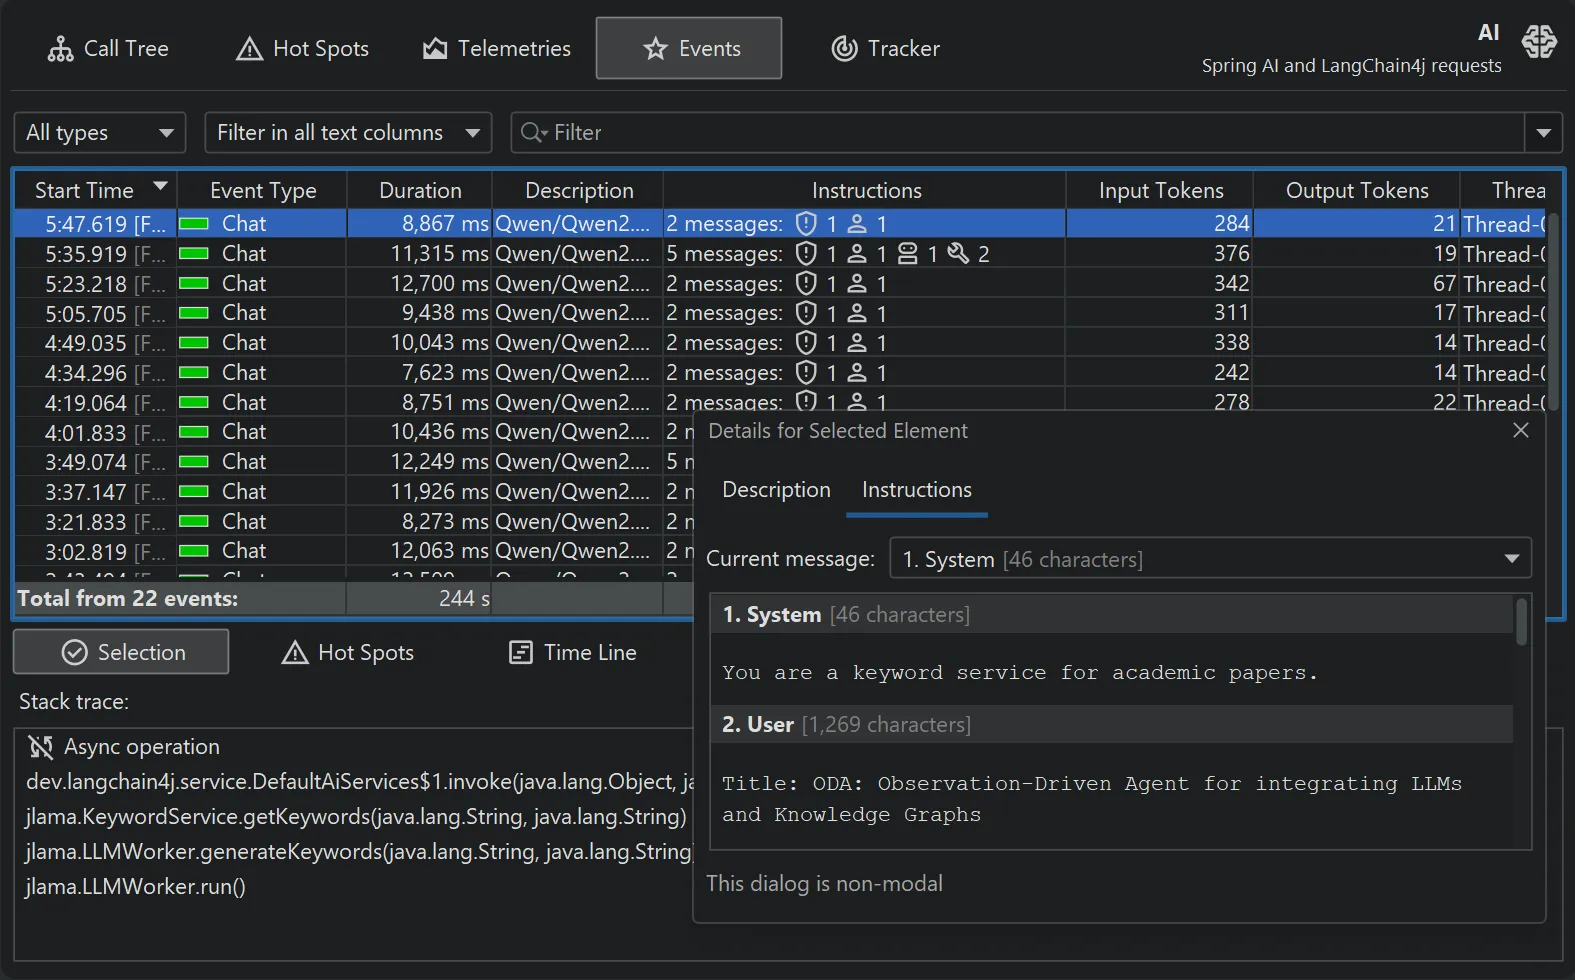
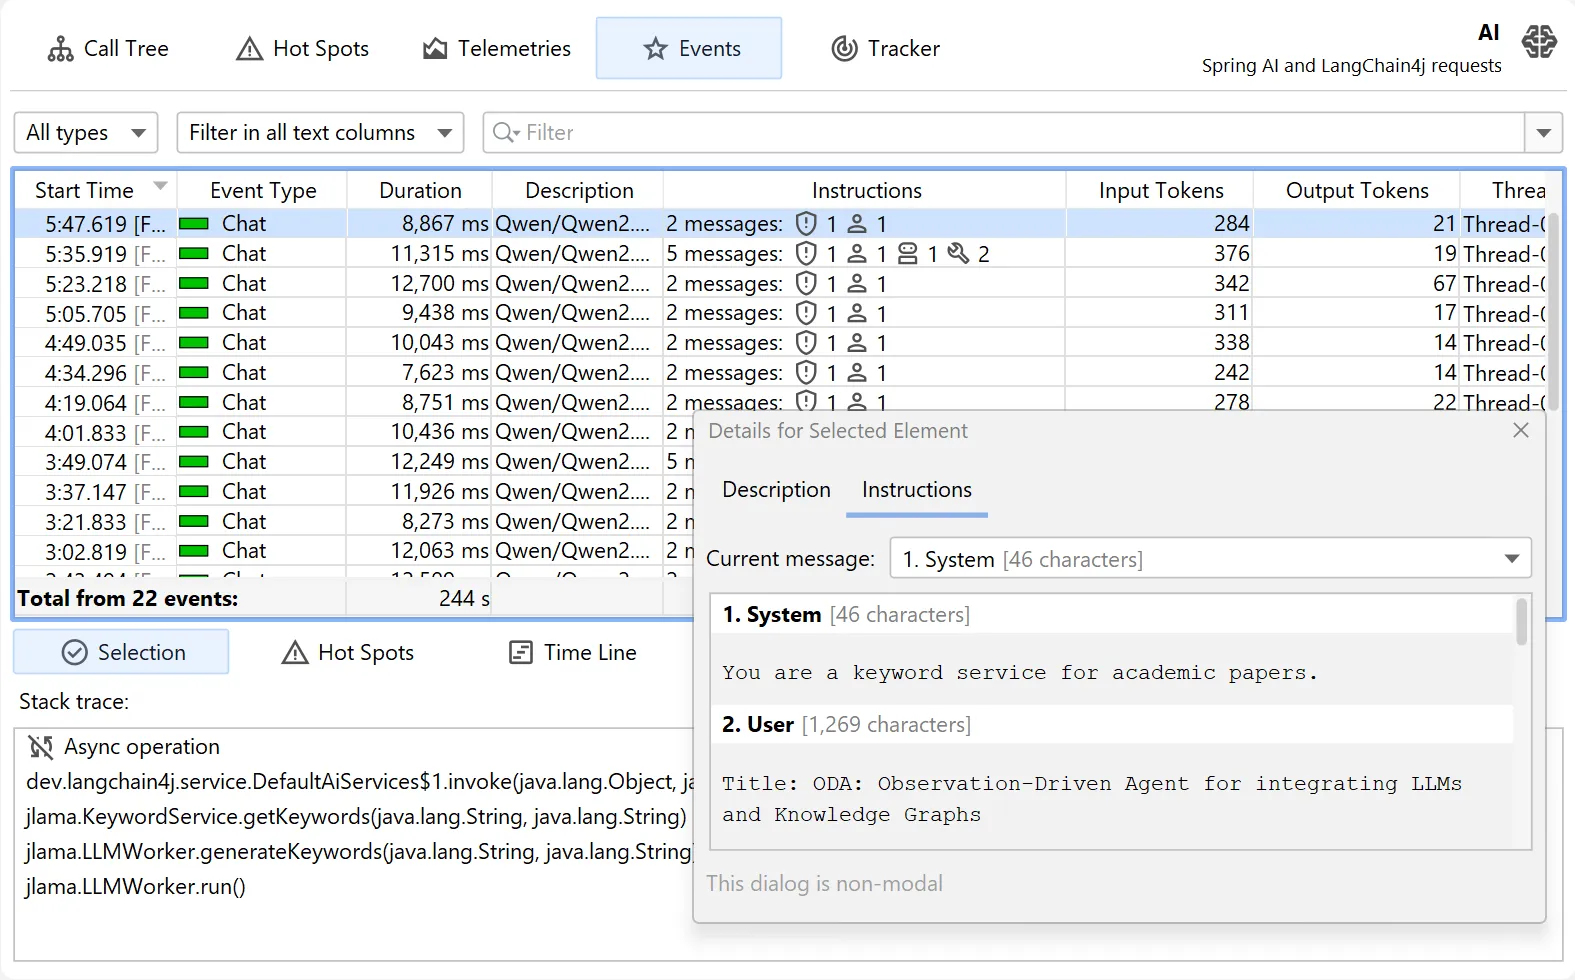
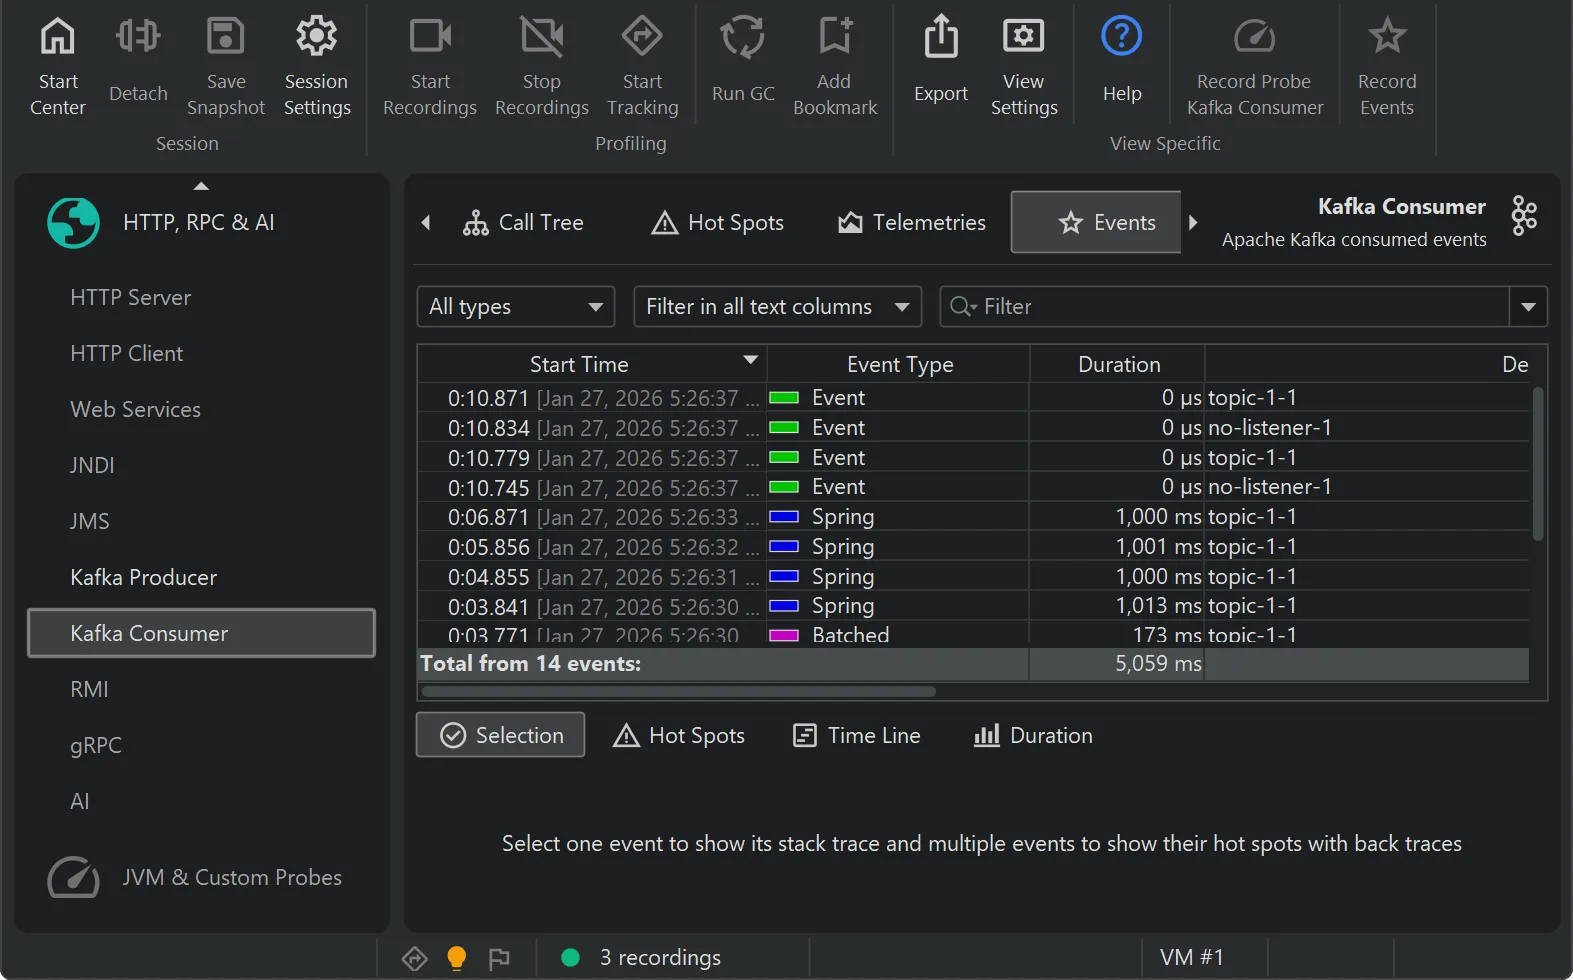
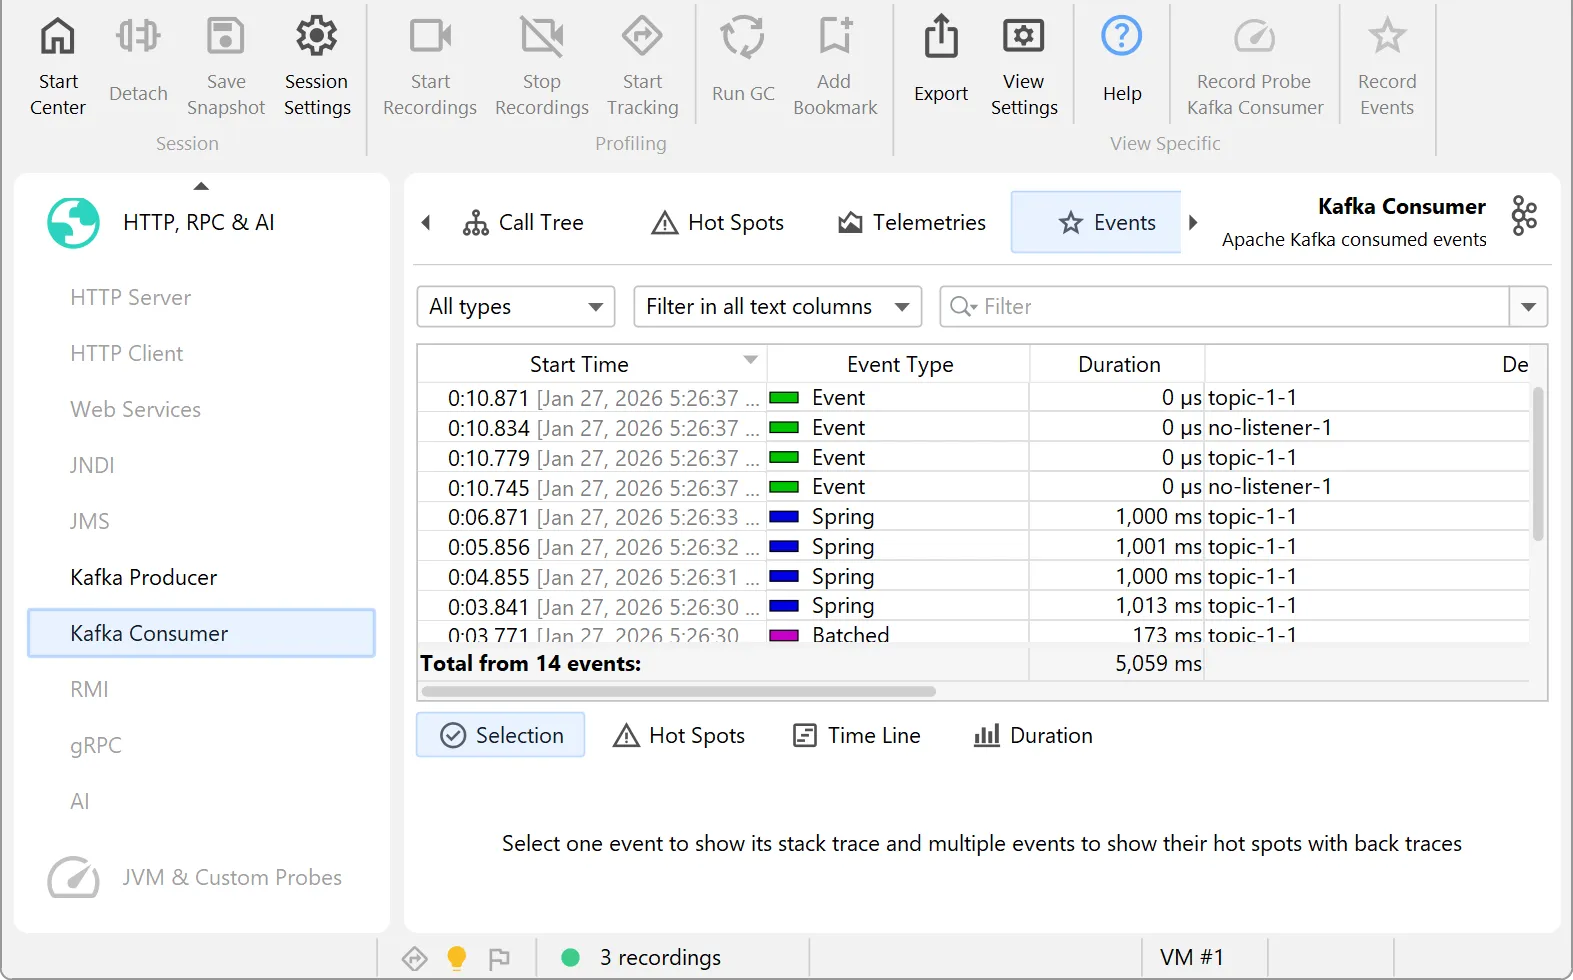
トップクラスのAIオブザーバビリティ
エージェント型アプリケーションのコンテキスト認識型メトリクスを分析します。JProfilerはコストの最小化とLLMパフォーマンスの最適化を支援します。
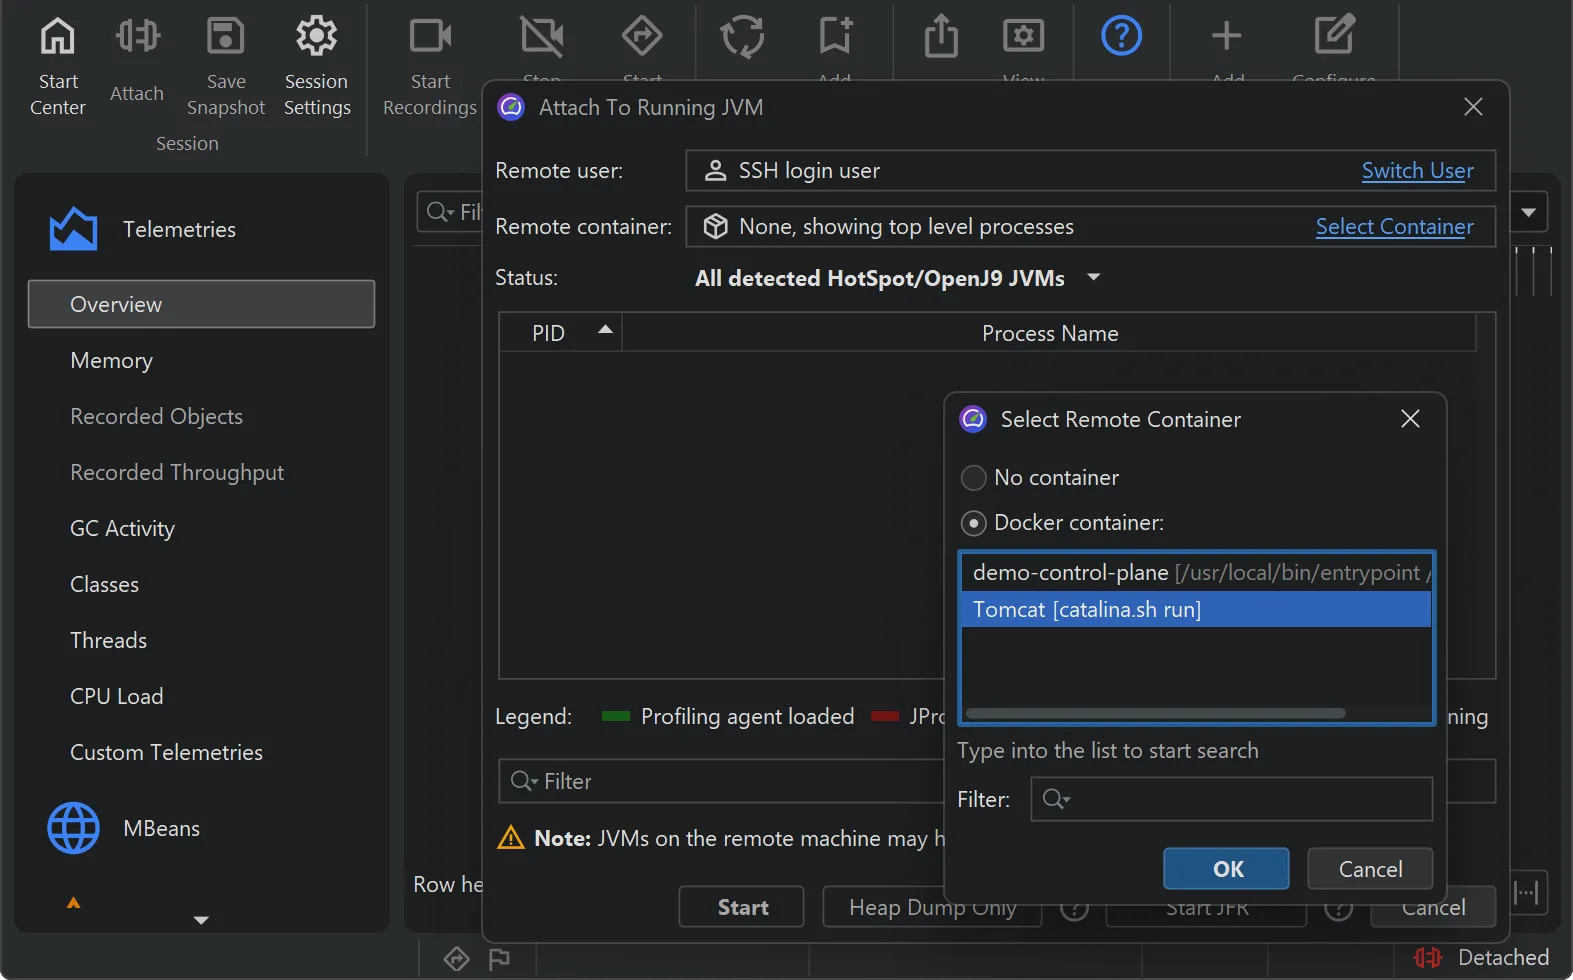
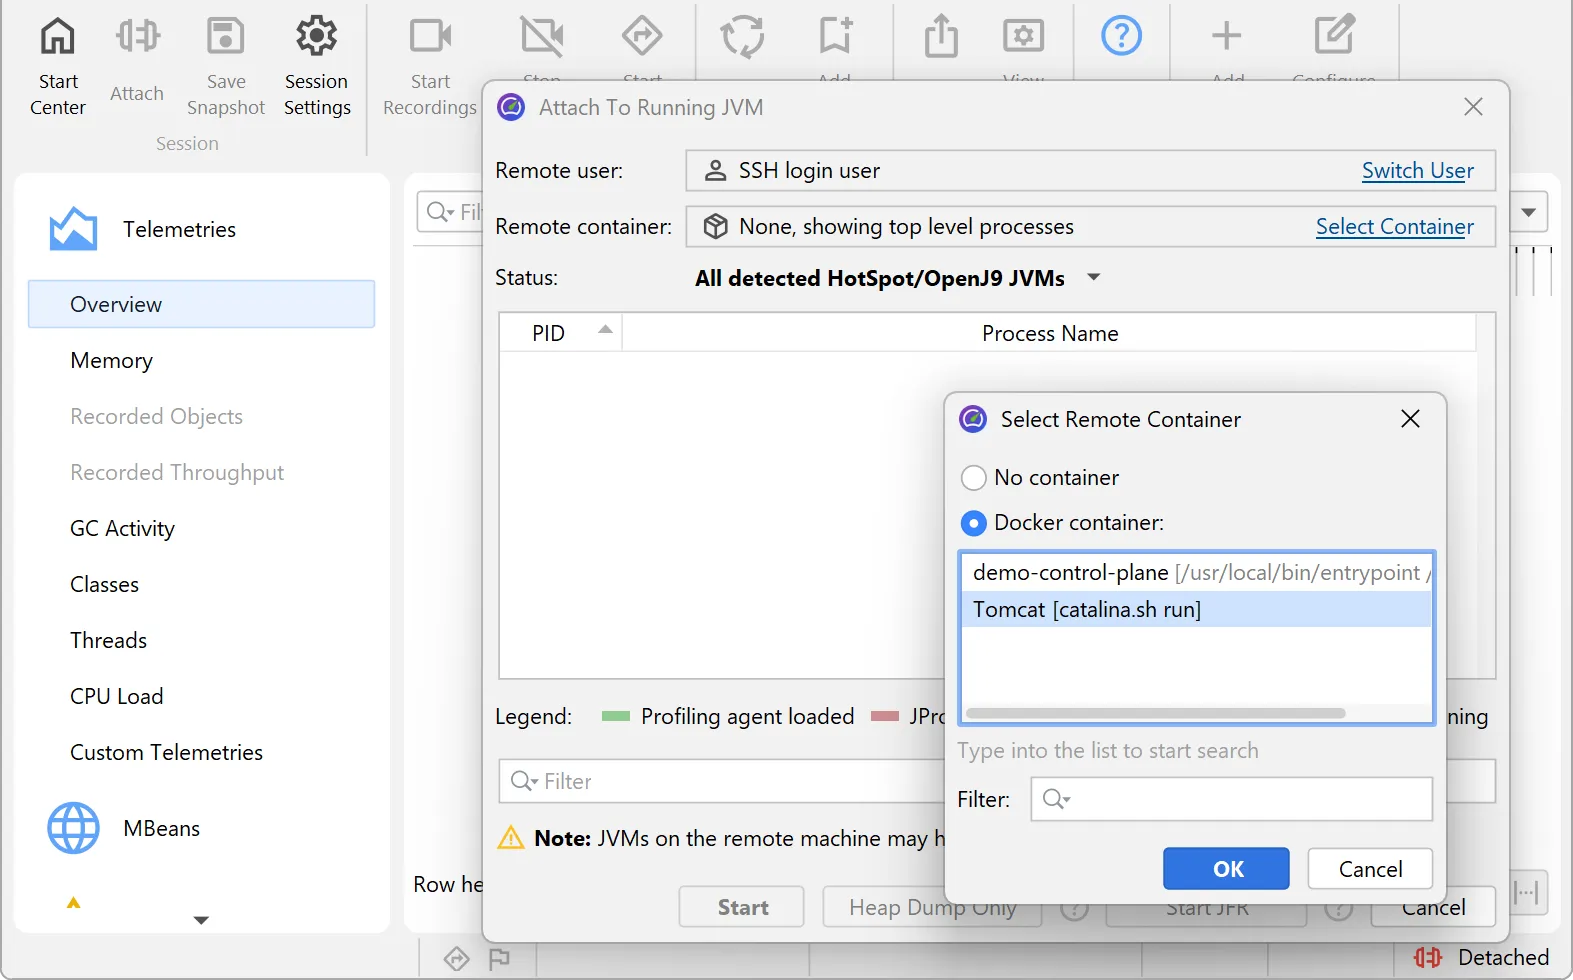
KubernetesとDockerの組み込みサポート
コンテナ内のJVMのプロファイリングは簡単に行えます。面倒なセットアップなしに、UI上で直接選択するだけです。
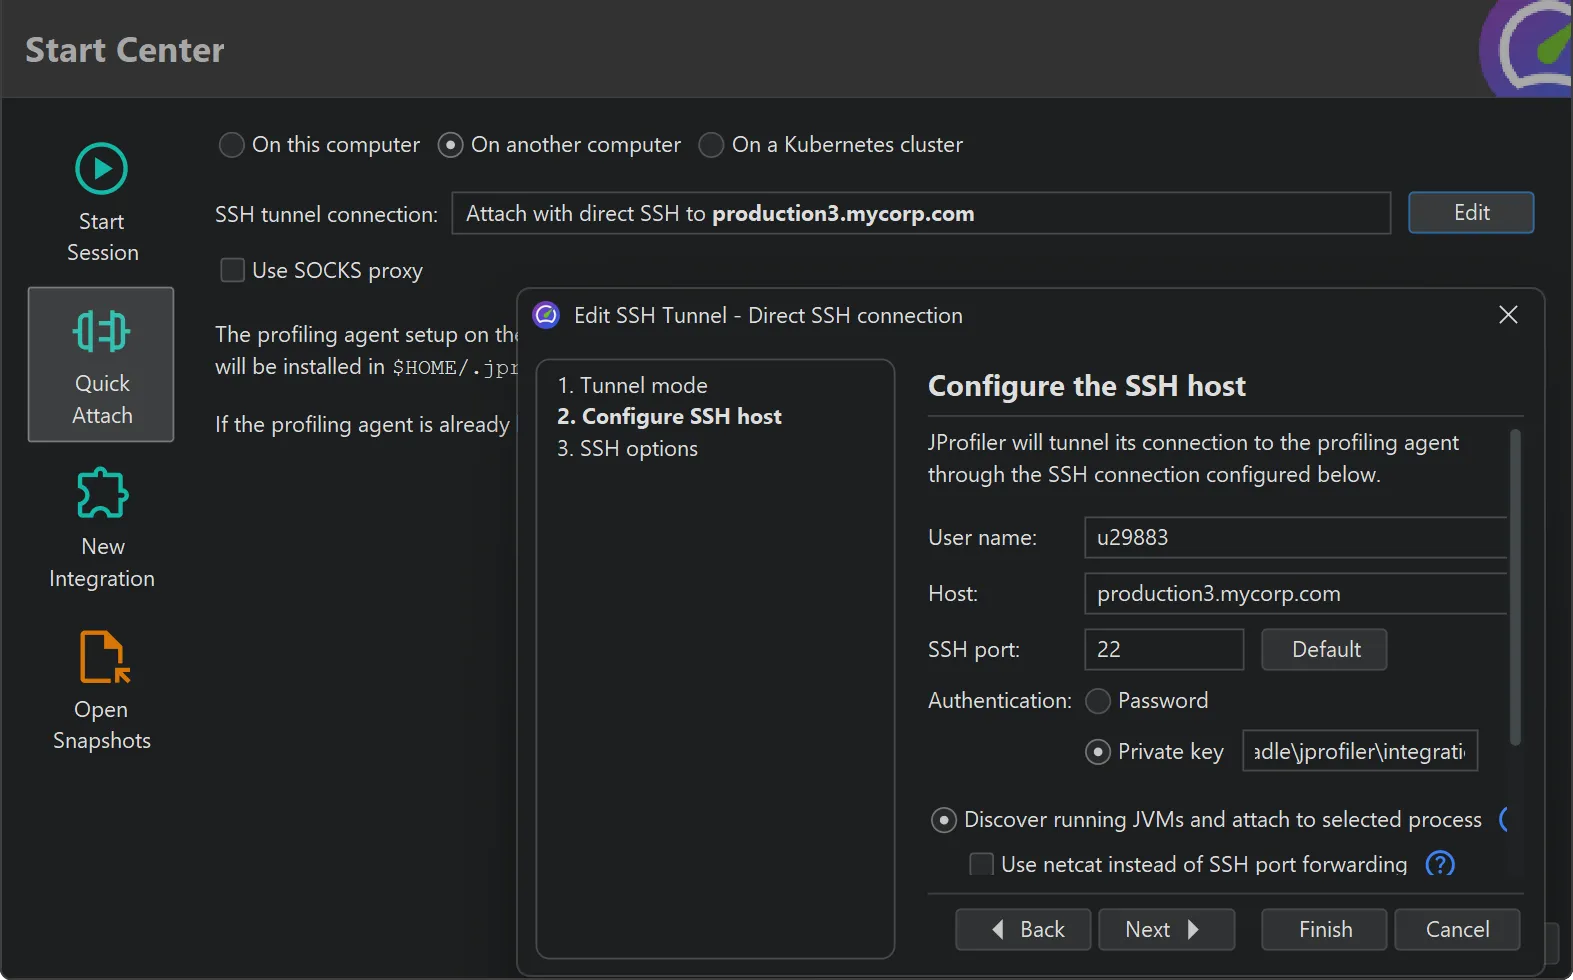
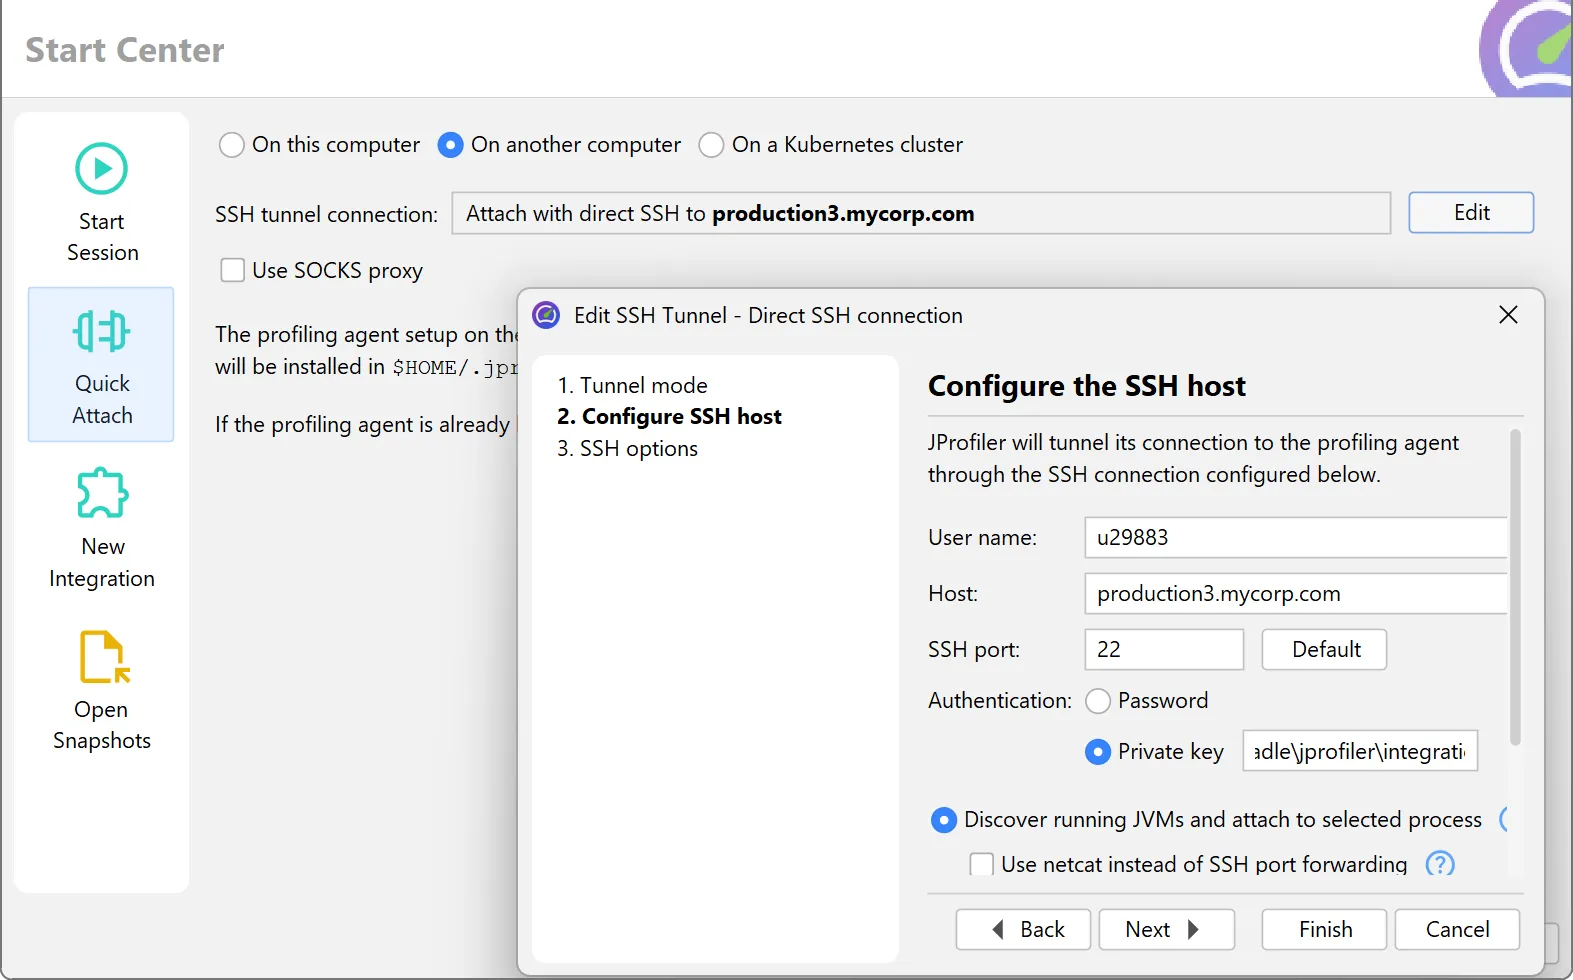
設定不要のリモートプロファイリング
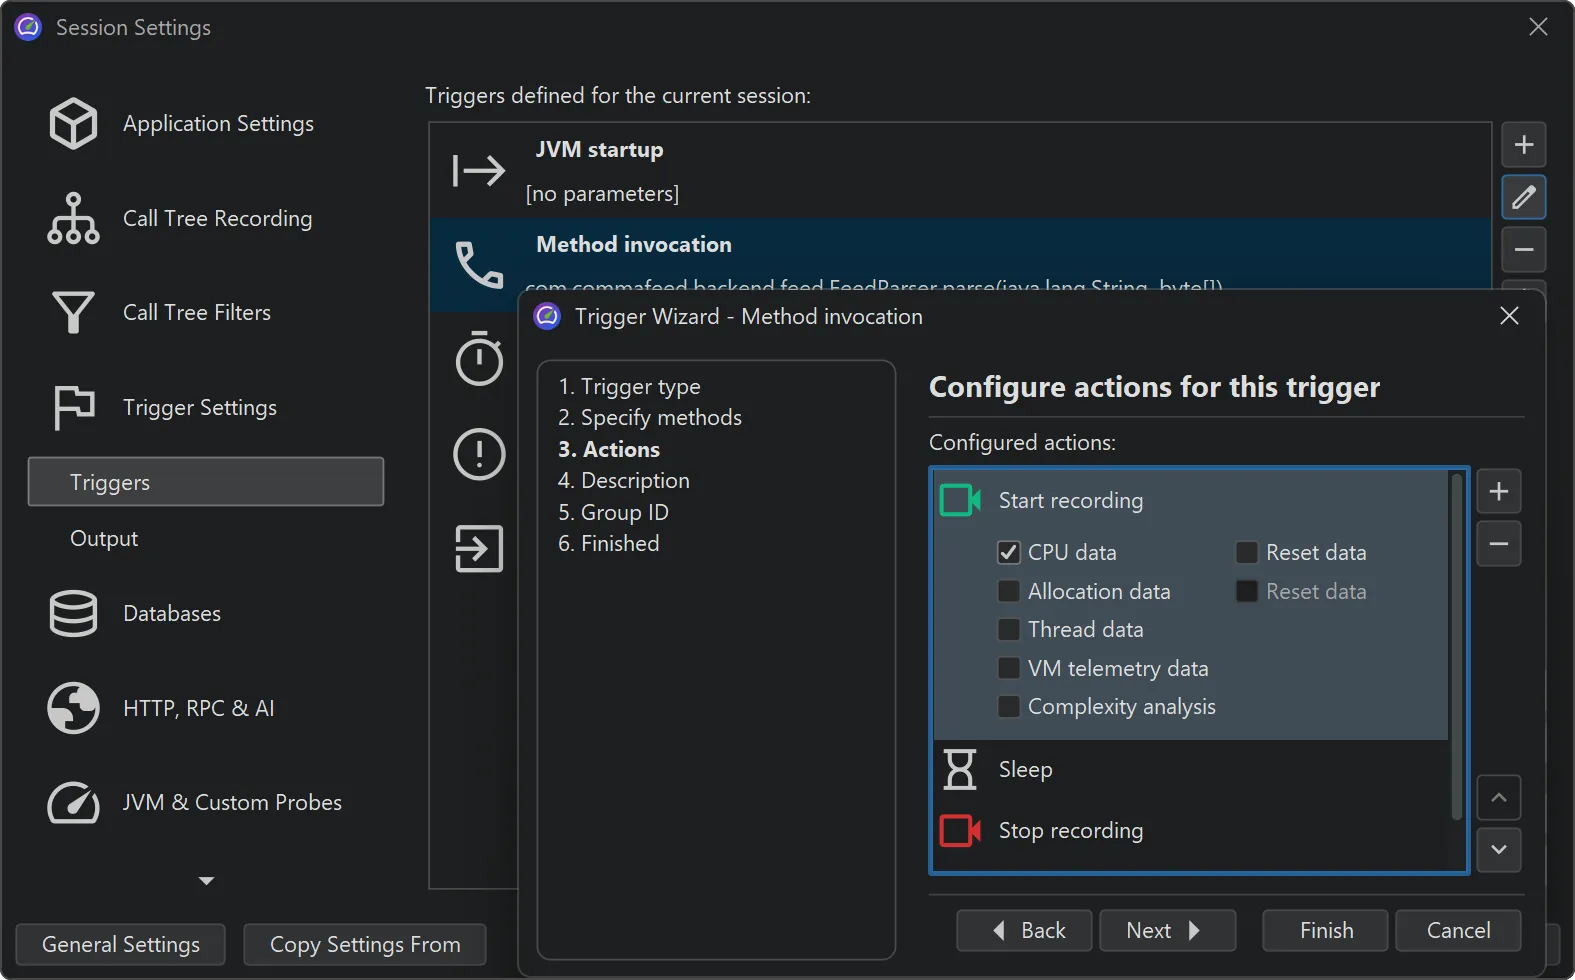
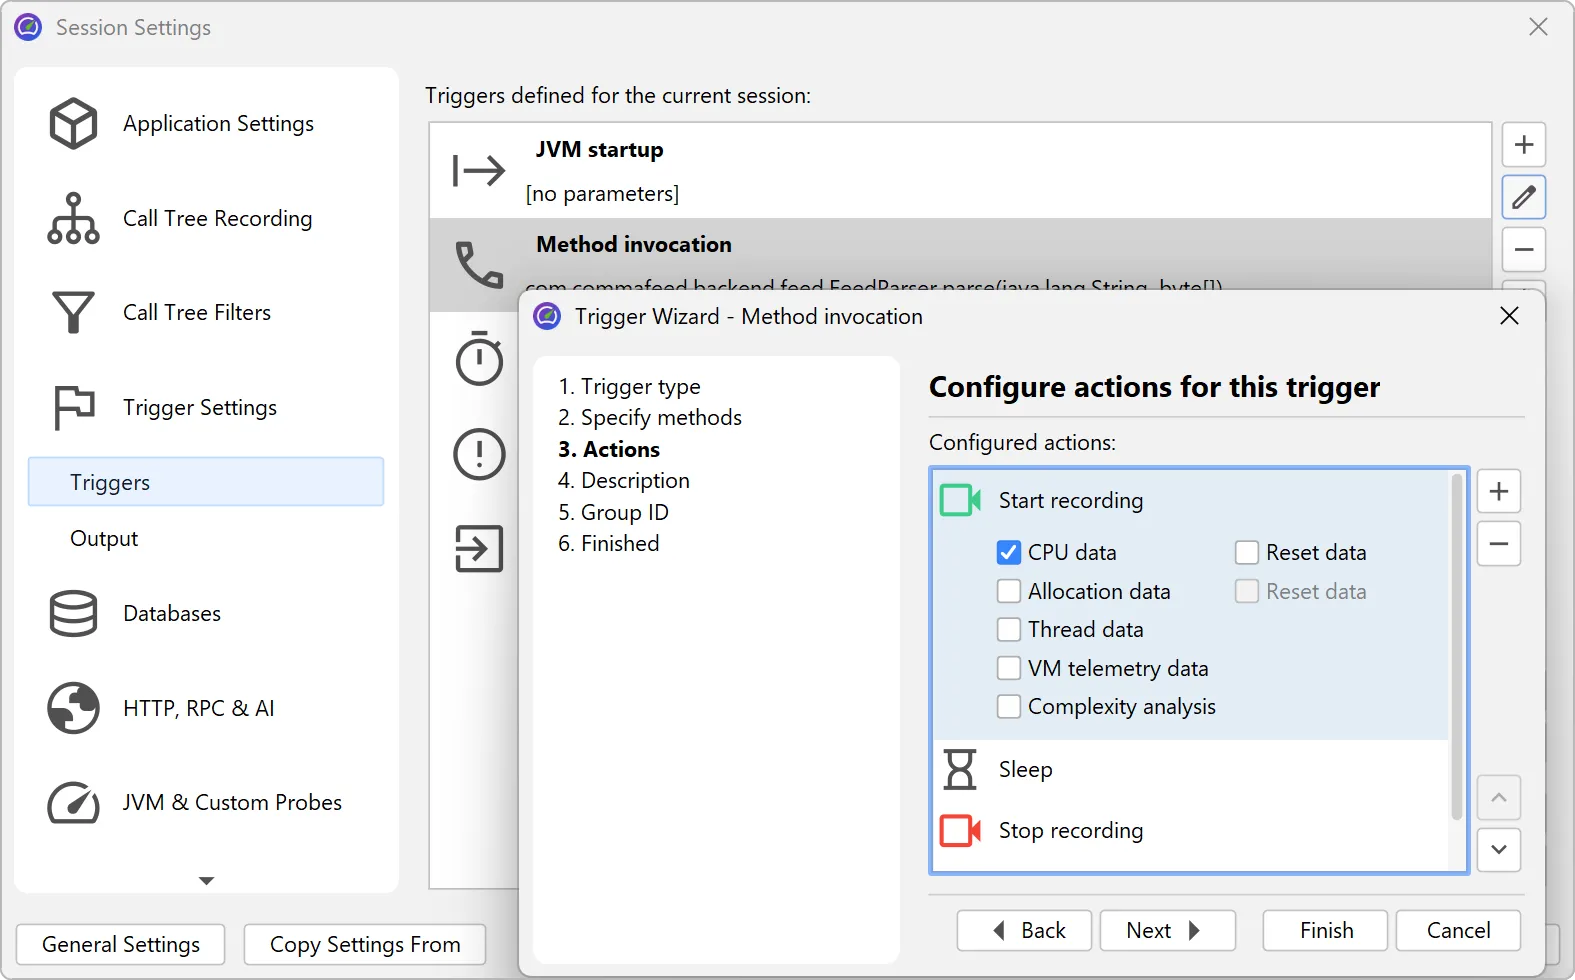
SSH認証情報を使用して、リモートJVMを即座にプロファイリングできます。リモート側へのインストールやエージェントの配置は不要です。
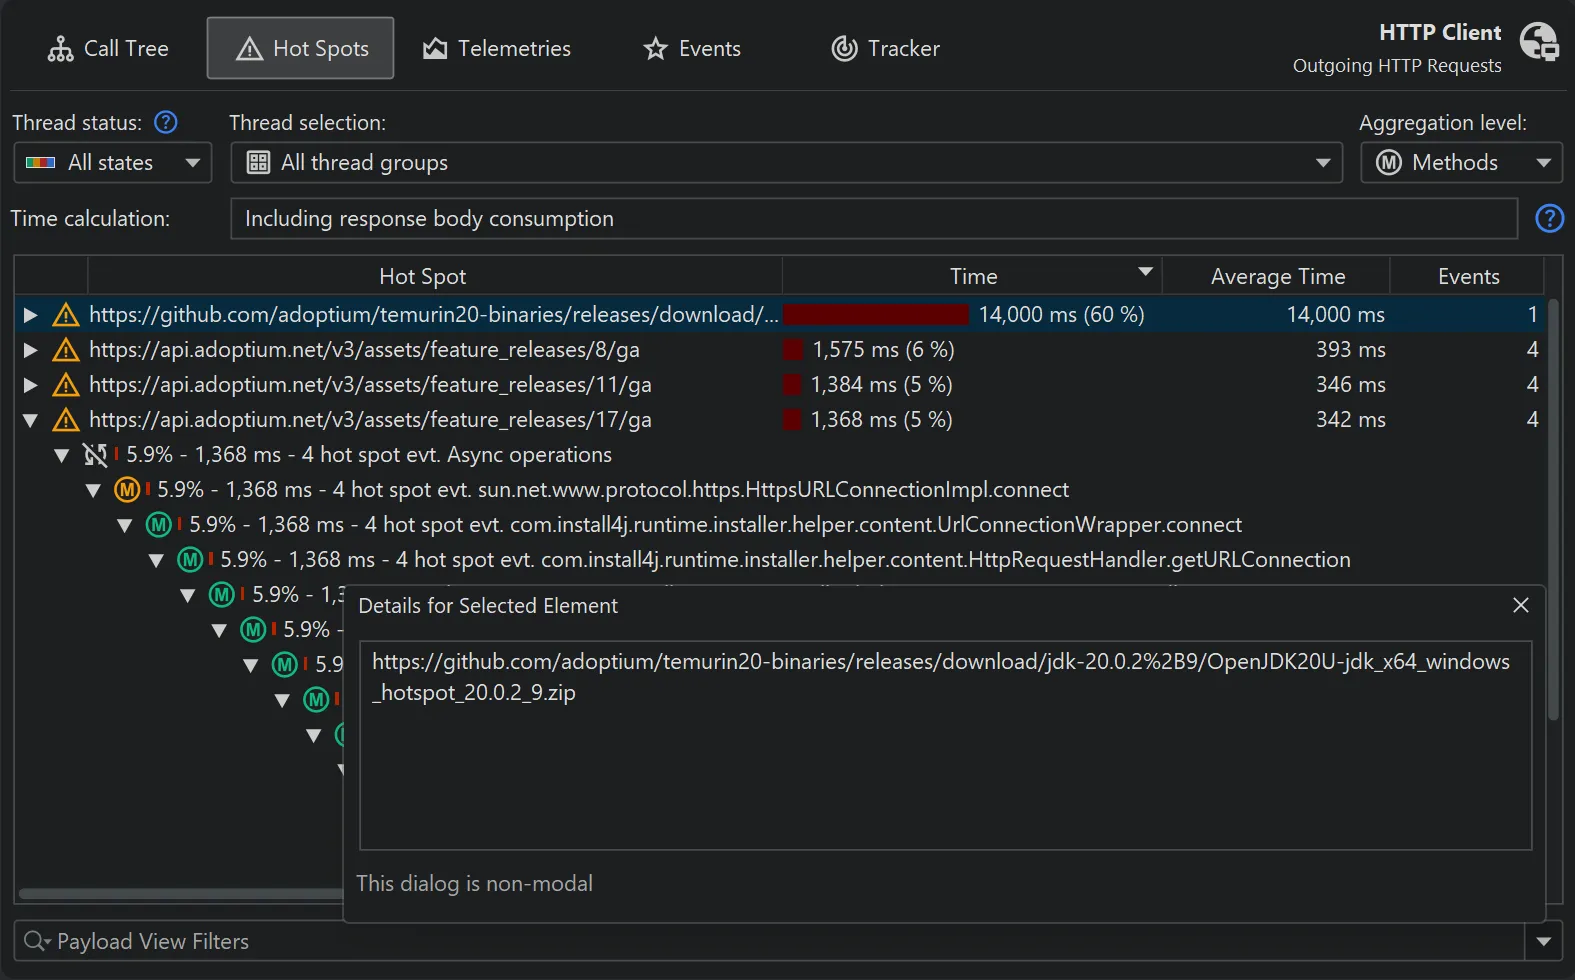
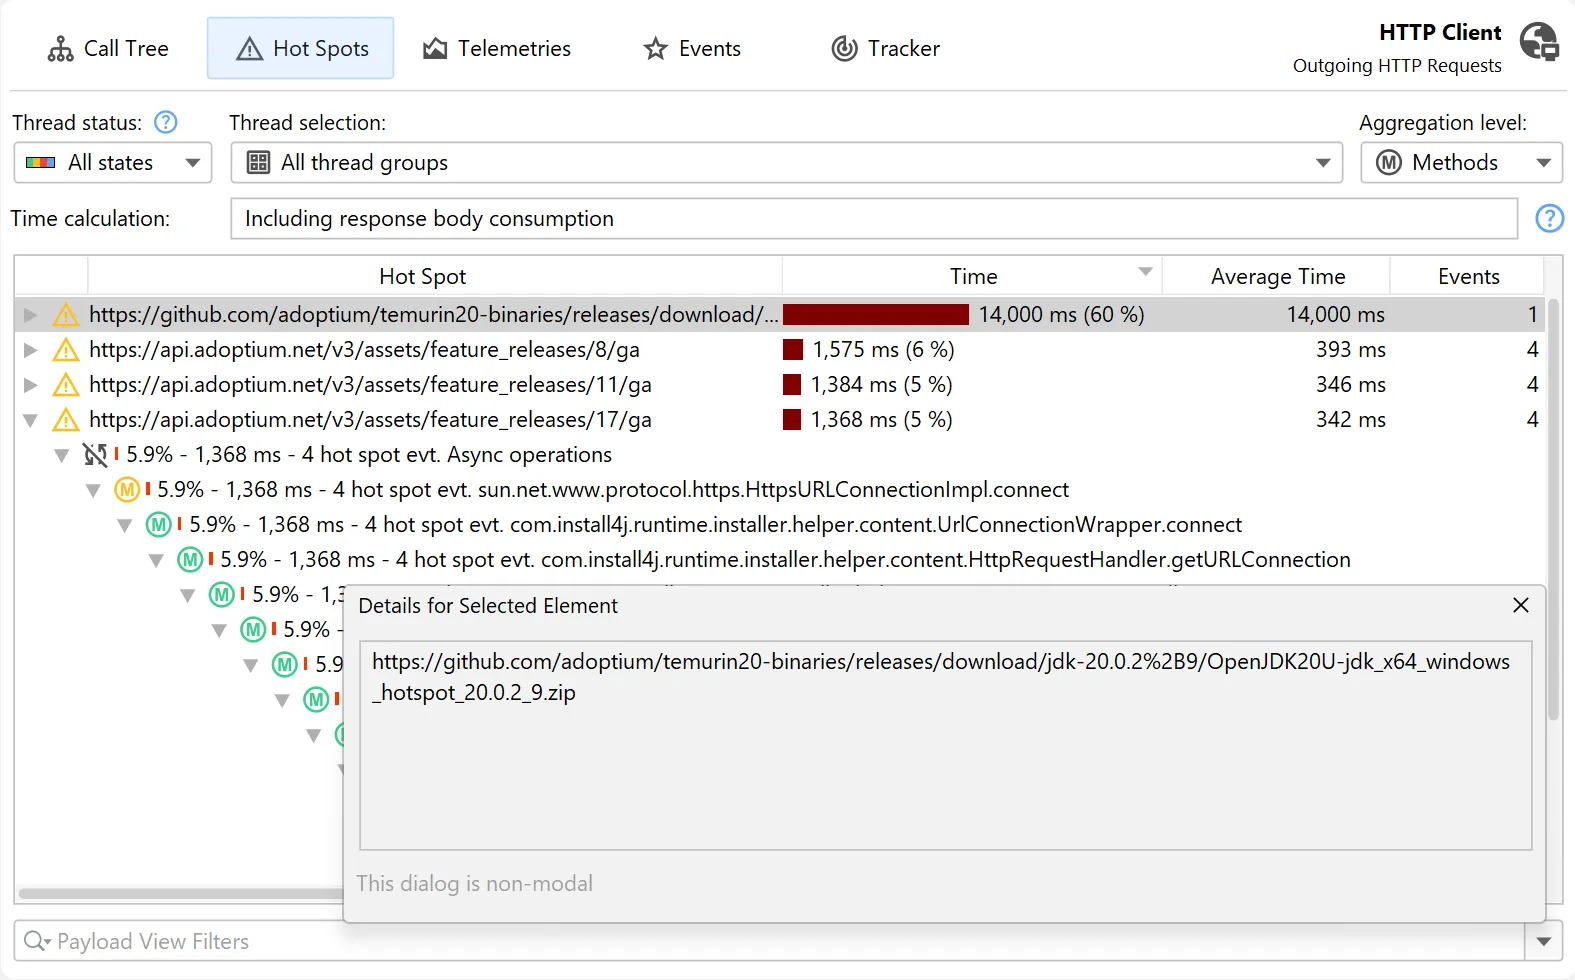
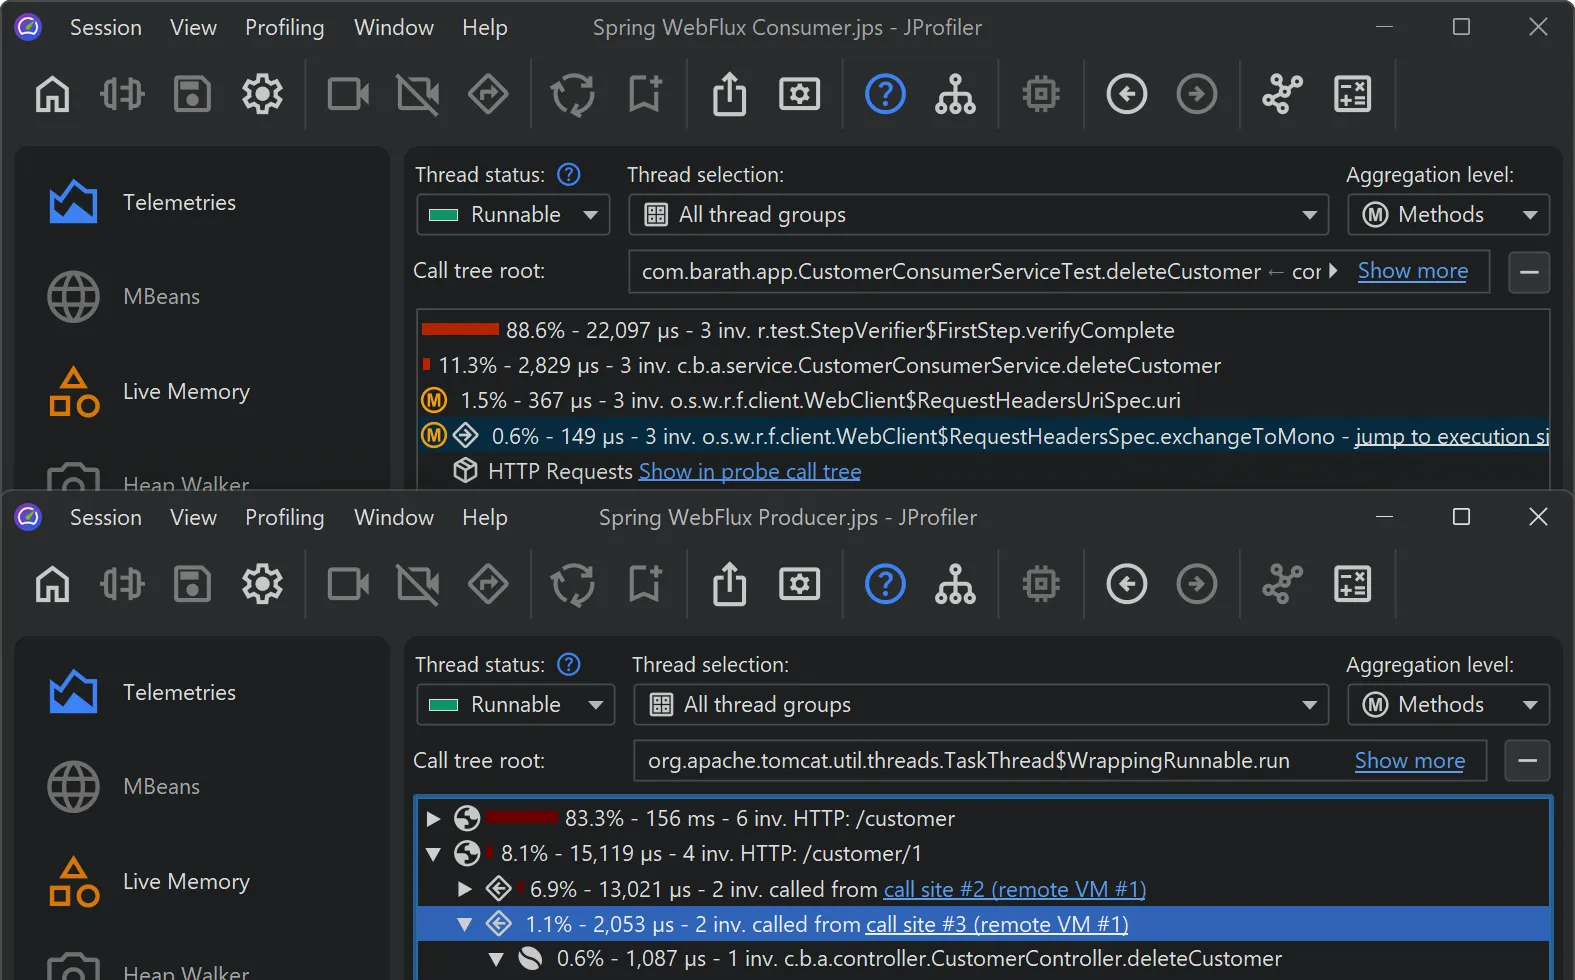
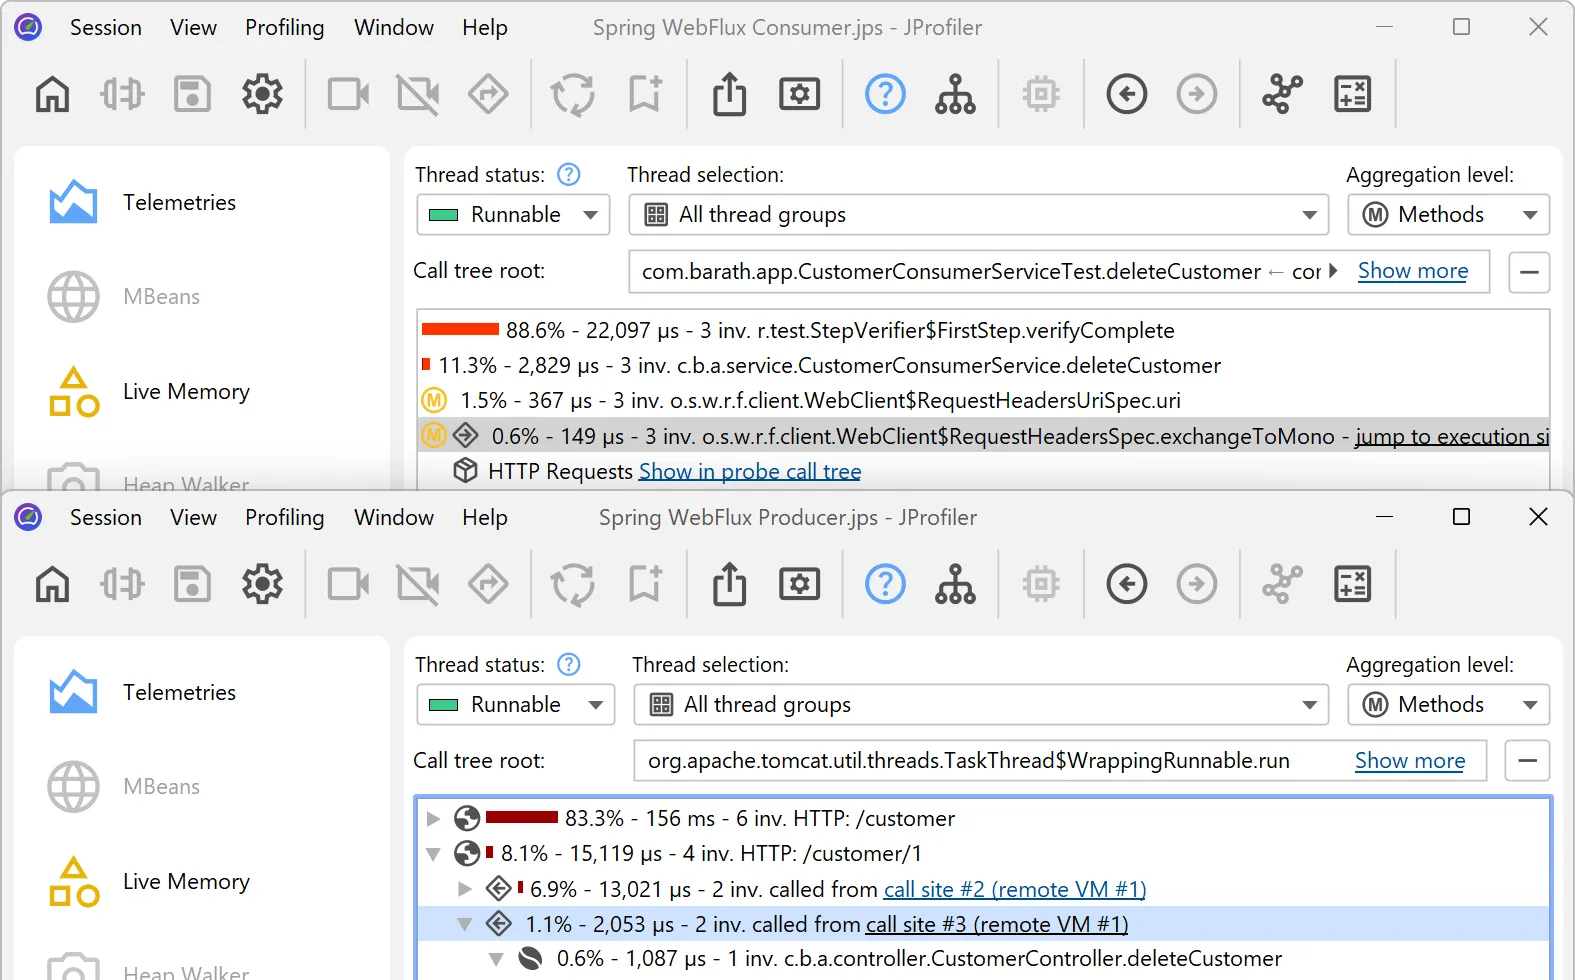
HTTP呼び出しの高度なプロファイリング
JProfilerは、JVM境界をまたぐ着信呼び出しと発信呼び出しの両方をカバーするHTTPパフォーマンス分析の最高のツールです。
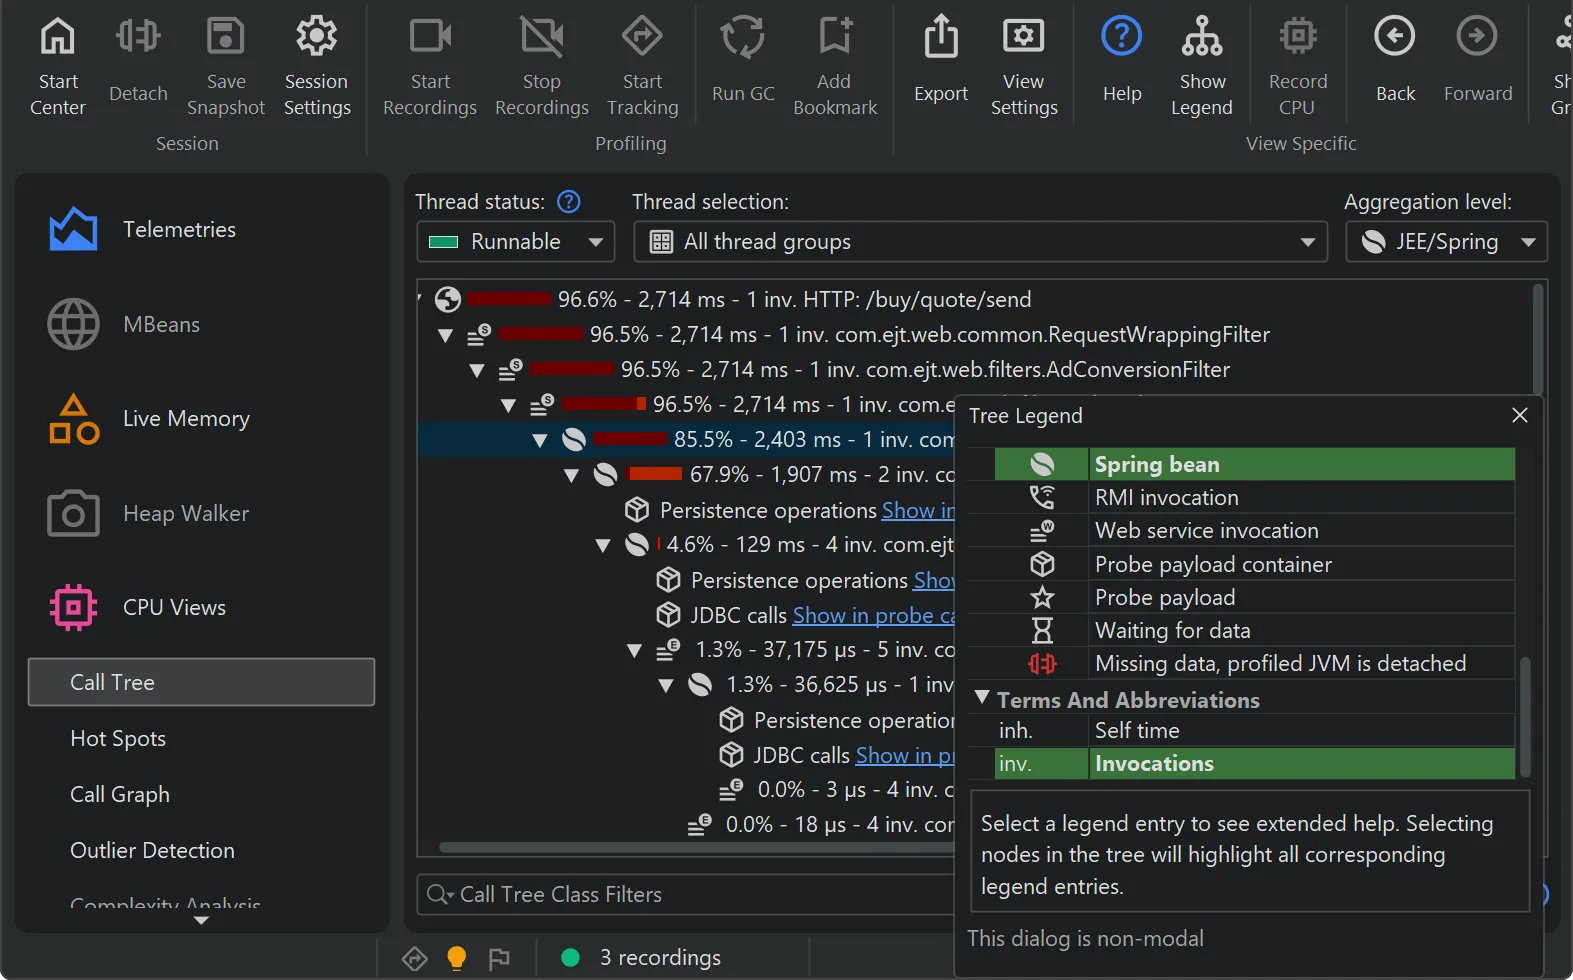
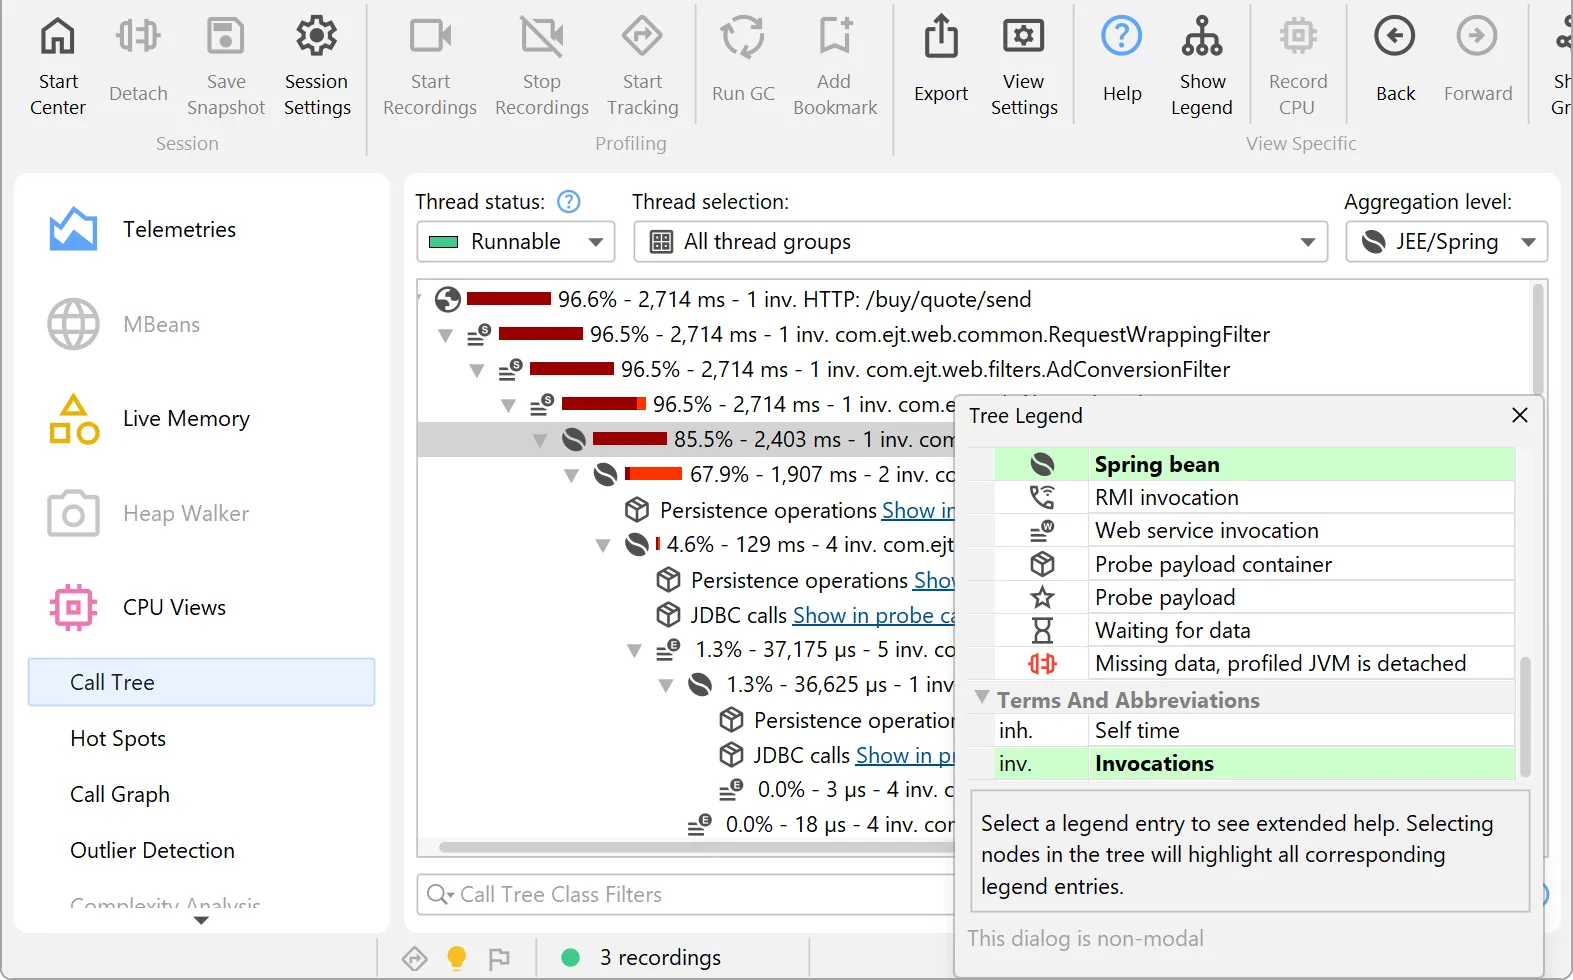
SpringとJEEの優れたサポート
JProfilerはSpringおよびJEEのコンポーネントを認識し、高水準のコンテキストと低水準のメソッド呼び出しデータを組み合わせます。
...その他にも多くの機能
JProfilerで時間とコストを節約
JProfilerのコストは驚くほど短期間で償却できます

市場最高のプロファイリングツールで生産性を向上させましょう。JProfilerを利用すれば、次のことが可能になります。
- ビジネスロジックに時間を集中
- 本当に重要な箇所のパフォーマンスとメモリの問題を修正
- 「まずはスケールしないことをやり、後から改善する」――ポール・グレアム

多くのお客様がクラウドコストを半減させています。JProfilerを利用すれば、次のことが可能になります。
- リソース使用量を最適化
- データ転送レートを削減
- CPUとメモリの要件を最小化

本番環境がダウンしたときは、1秒1秒が重要です。JProfilerを利用すれば、次のことが可能になります。
- 強力なリモートアタッチ機能でライブシステムをプロファイリング
- 高度なプローブで個別のケースをリアルタイムにデバッグ
- JFRやHPROFなどの事後分析スナップショットをJProfilerの全機能で分析
ユーザーの声
世界中の30,000以上のお客様と、Fortune 500企業の75%以上がJProfilerを使用しています。

“I recently evaluated JProfiler to identify some performance issues in an app I'm working on in my current consulting gig. I had been banging my head against the wall trying to get tools like VisualVM working against the IBM JVMs that the client uses and then I tried JProfiler. With the IDE plugin support it provides, it just worked and in the last day or so, I've been able to easily identify sources for all our major performance problems.”
“What started out as a search for a memory leak and a trial of JProfiler turned out to be the find of a year. Not only did we find our memory leak, we got started in only minutes of setup work, found slow background processes, reduced server costs and tuned our software to make it faster and more responsive. All this in just a week and a free trial. Given the results it seemed obvious we should add JProfiler to our tool chain!”
“I have evaluated lots of Java profilers. Yours is simply FAN-TA-STIC!. I love the 'live' views and auto-updated profiling information. JProfiler is also the only profiling tool to reliably report time spent in JNI calls, which is very valuable in our Java applications which are JNI intensive.”
スクリーンキャストを見る
重要なユースケースや新機能を取り上げたJProfilerのスクリーンキャストをブログで公開しています。