|
With JProfiler integrated into
JetBrain's IntelliJ IDEA,
JProfiler can be invoked from within the IDE without any further need for
session configuration.
Requirements: IDEA 15.x+ in legacy mode or 2016.3+ in fully featured mode For newly released versions of IntelliJ IDEA, download the JProfiler plugin from the IDEA plugin manager. |
|
The installation of the IntelliJ IDEA plugin is started by selecting "IntelliJ IDEA [your version]" on the
Reminder: Please close IntelliJ IDEA while performing the plugin installation. If you are performing the installation from JProfiler's setup wizard, please complete the entire setup first before starting IntelliJ IDEA. A file selector will then prompt you to locate the installation directory of IntelliJ IDEA.After acknowledging the completion message, you can start IntelliJ IDEA and check whether the installation was successful. You should now see a menu entry Run->Profile in IDEA's main menu. |
To profile your application from IntelliJ IDEA, choose one of the profiling commands in the
Run menu, the context menu in the editor, or click on the corresponding
toolbar button.
 Main toolbar with "Profile" button 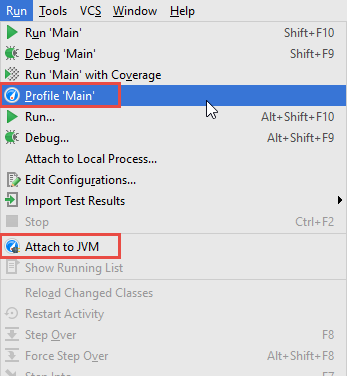 "Run" menu with "Profile" action 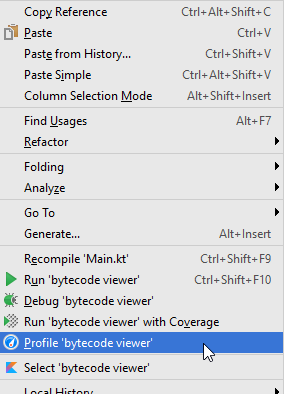 Editor context menu with "Profile" action JProfiler can profile most run configuration types from IDEA, also applications servers. To configure further settings, please edit the run configuration, choose the "Startup/Connection" tab, and select the "Profile" entry. The screen shot below shows the startup settings for a local server configuration. Depending on the run configuration type, you can adjust JVM options or retrieve profiling parameters for remote profiling. 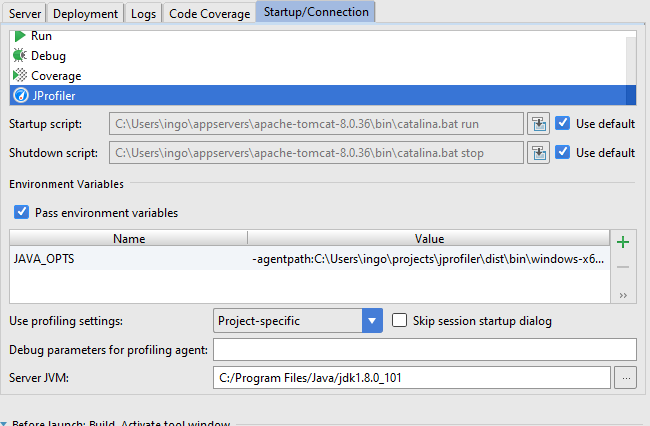 Startup settings for profiling of a local server configuration The profiled application is then started just as with the usual "Run" commands. If no instance of JProfiler is currently running, JProfiler is also started, otherwise the running instance of JProfiler will be used for presenting profiling data. When JProfiler is started from IntelliJ IDEA, the "Show source" action for a class or a method in one of JProfiler's view will show the source element in IDEA and not in JProfiler's integrated source code viewer. This works for Java as well as for Kotlin source code. You can also open JProfiler snapshots from IDEA, either from the project window or the open file dialog in order to get source code navigation into IDEA. With the Run->Attach JProfiler to JVM menu item, you can attach JProfiler to any locally running JVM or a JVM on a remote machine and get source code navigation in the IDE. Please see the help on attaching to JVMs for more information on attach mode. |
|
On the "JProfiler" tab of the IDE settings, you can adjust the used JProfiler executable and whether you always
want to open a new window in JProfiler for new profiling sessions.
On different platforms, the JProfiler executable is located in different directories:
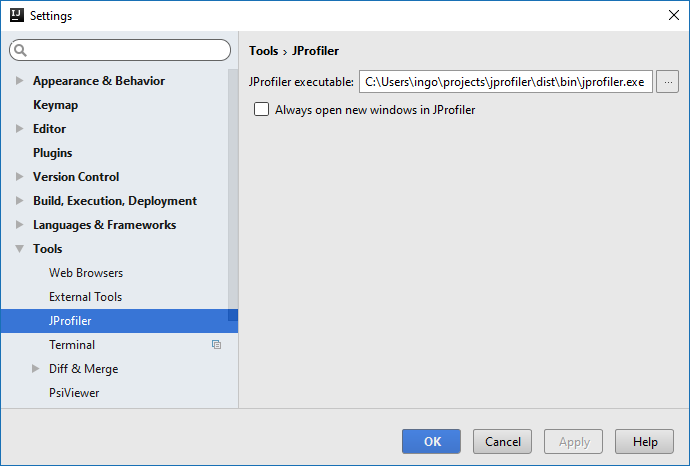 IDE settings for JProfiler |
The JProfiler tool window in IDEA is shown when you profile a run configuration from IDEA, when you open a
JProfiler snapshot or when you attach to a running JVM.
 JProfiler tool window
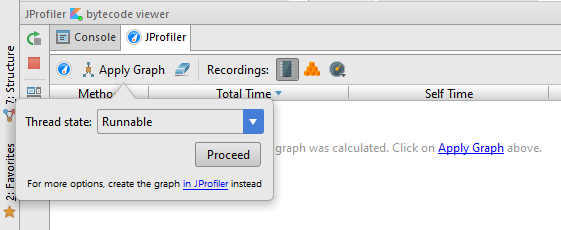
The On the right side of the tool bar, several toggle buttons give access to important recording actions in JProfiler. If a recording is active, the corresponding toggle button is selected. Of particular relevance is the "CPU recording" action, because CPU graph data can be shown directly in the IDE. The only parameter for graph calculation that is offered in the IDE is the thread status. To configure advanced parameters like thread selection or to use the call tree root, call tree removal and call tree view filter settings from the call tree view, you can generate the graph in the JProfiler window, it will then be shown in the IDE as well. When you calculate a graph, the list of hot spots will be populated and the source code will be annotated with gutter icons for incoming and outgoing calls. The popup on the gutter icons shows an inline graph, clicking on a method will navigate to it. The list of hot spots shows you interesting entry points for analyzing the graph, by double clicking on a table row, the source code is shown. 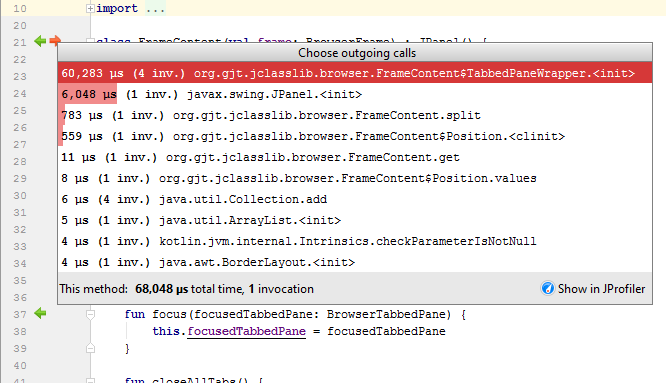 Popup for gutter icons The [Show in JProfiler] button contains actions that activate the JProfiler window, either the selected node in the method graph or the corresponding call tree analysis in the method graph. For outgoing calls, the "Cumulated outgoing calls" analysis is offered, for the incoming calls, the "Backtraces" analysis is shown. All these actions are also available in the context menu of the hot spot list or as keyboard actions. 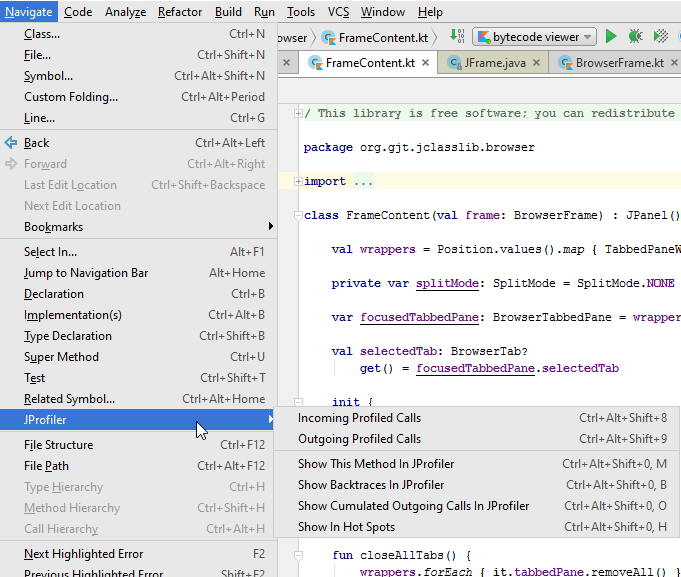 Keyboard actions |
 action in the tool bar activates the
JProfiler window. For profiling sessions that are opened by an IDE integration, the tool bar in the JProfile
window has an "Activate IDE" button that goes back to the IDE. In both cases, the actions are bound to the
action in the tool bar activates the
JProfiler window. For profiling sessions that are opened by an IDE integration, the tool bar in the JProfile
window has an "Activate IDE" button that goes back to the IDE. In both cases, the actions are bound to the