JProfiler
Best Java Profiling / Testing Tool
JProfiler's intuitive UI helps you resolve performance bottlenecks,
pin down memory leaks and understand threading issues.

Check out below what makes JProfiler the top choice for profiling your applications on the JVM:
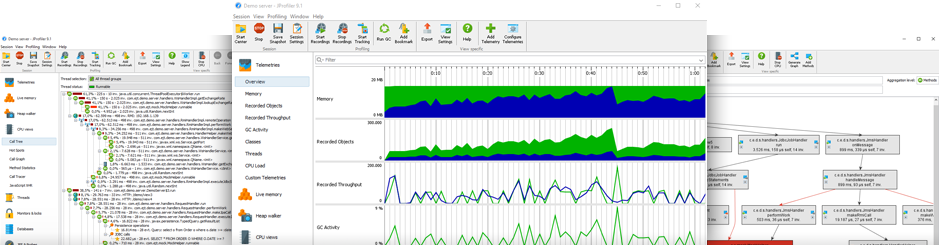
When you profile, you need the most powerful tool you can get. At the same time, you do not want to spend time learning how to use the tool. JProfiler is just that: simple and powerful at the same time. Configuring sessions is straight-forward, third party integrations make getting started a breeze and profiling data is presented in a natural way. On all levels, JProfiler has been carefully designed to help you get started with solving your problems.
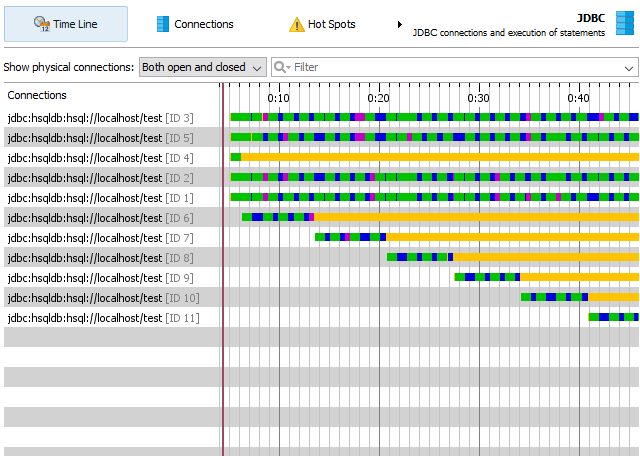
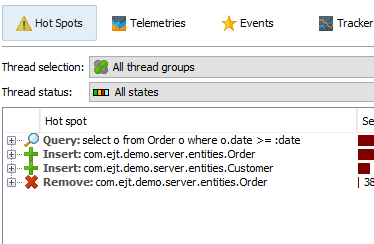
Database calls are the top reasons for performance problems in business applications. JProfiler's JDBC and JPA/Hibernate probes as well as the NoSQL probes for MongoDB, Cassandra and HBase show the reasons for slow database access and how slow statements are called by your code. From the JDBC timeline view that shows you all JDBC connections with their activities, through the hot spots view that shows you slow statements to various telemetry views and a list of single events, the database probes are an essential tool for getting insight into your database layer.
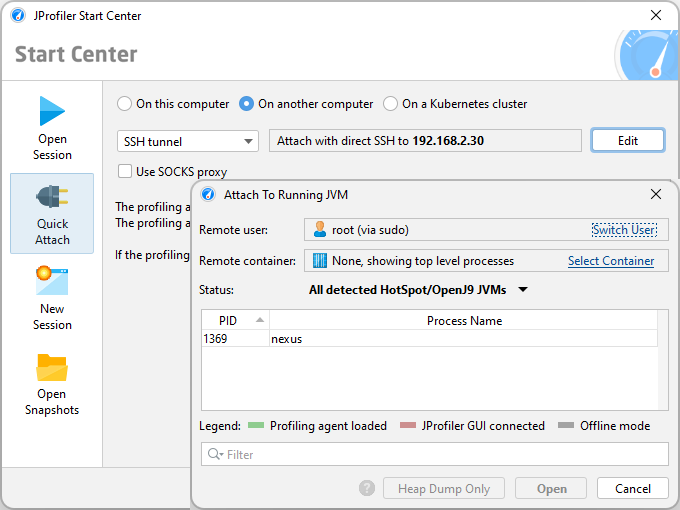
Profiling JVMs that run on remote machines doesn't get any easier than with JProfiler. The built-in SSH tunnel functionality connects you to the machine even through multiple hops and then JProfiler takes care of the rest: Procuring the appropriate agent libraries, uploading them to the remote machine and attaching to the profiled JVM. All you have to do is to select the JVM that you are interested in in the UI.
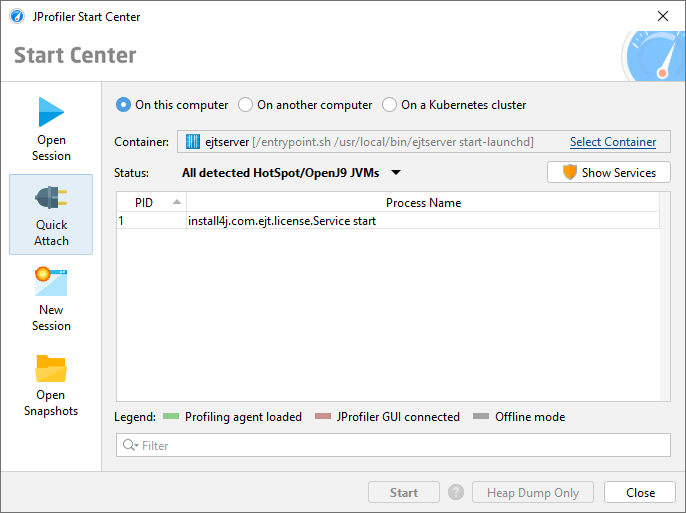
With JProfiler you can profile JVMs that are running in Docker or Kubernetes containers without any configuration in the container. You just select a local or remote container and JProfiler will list JVMs that are running in it.
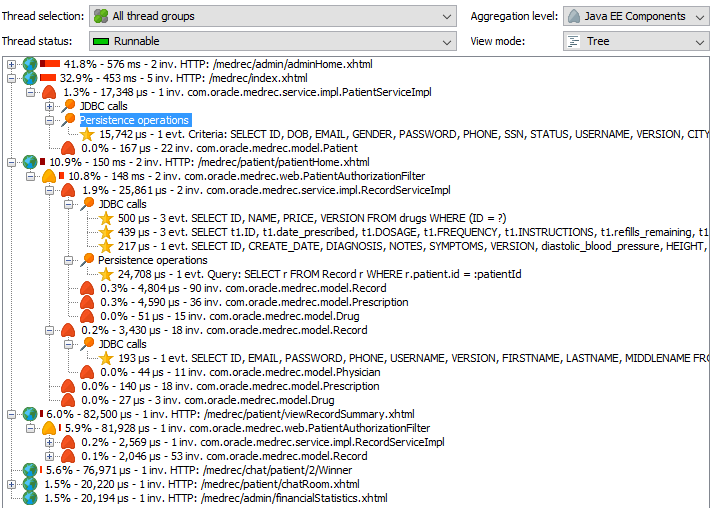
Dedicated support for JEE and Spring is present in most views in JProfiler. For example, in the JEE/Spring aggregation level you see the call tree in terms of the JEE or Spring components in your application. In addition, the call tree is split up for each request URI. Also, JProfiler adds a semantic layer on top of the low-level profiling data, like JDBC, JPA/Hibernate, JMS and JNDI calls that are presented in the CPU profiling views. With its JEE support, JProfiler bridges the gap between a code profiler and a high-level JEE monitoring tool.
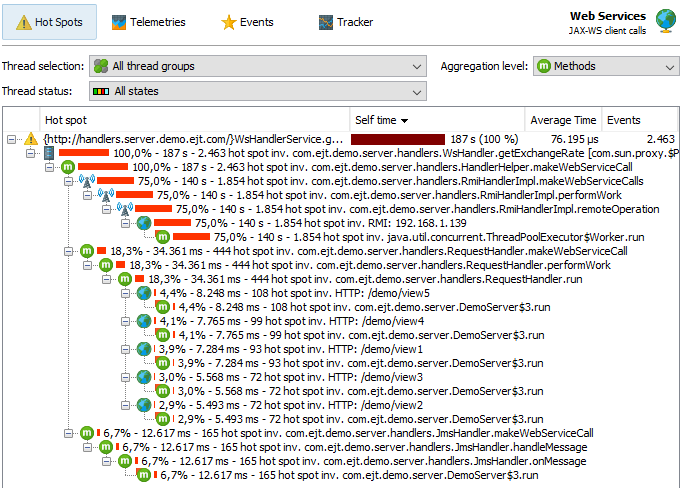
JProfiler has a number of probes that show you higher level data from interesting subsystems in the JRE. In addition to the JEE/Spring subsystems like JDBC, JPA/Hibernate, JSP/Servlets, JMS, web services and JNDI, JProfiler also presents high level information about RMI calls, files, sockets and processes. Each of these probes has its own set of useful views that gives you general insight, highlights performance problems and allows you to trace single events. And what's more, all these views are also available for your own custom probes that you can configure on the fly within JProfiler.
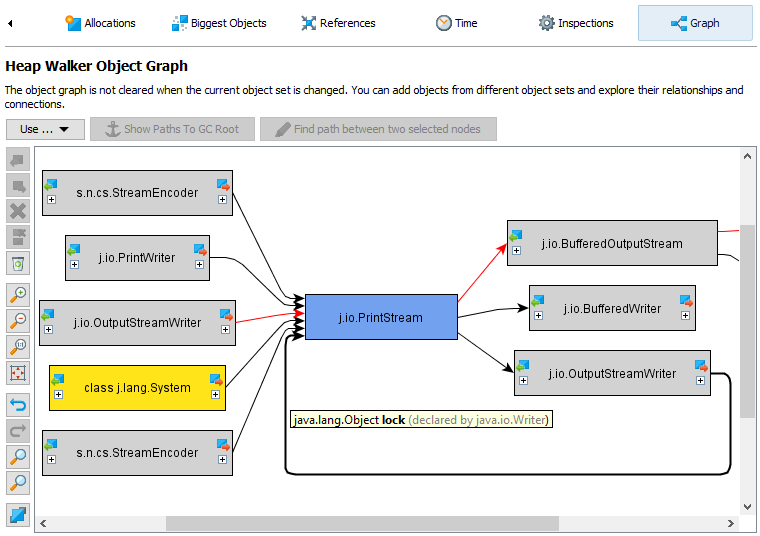
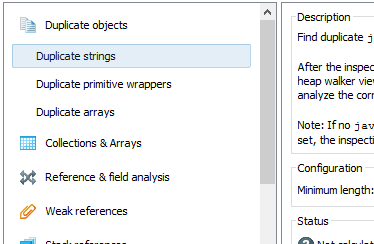
Finding a memory leak can be impossible without the right tool. JProfiler's heap walker offers you an intuitive interface to solve both simple and complex memory problems. 5 different views and lots of inspections show different aspects of the current set of objects. Each view provides you with essential insights on the selected objects and lets you switch to different objects sets. Questions like why objects are not garbage collected are answered with a single click of the mouse.
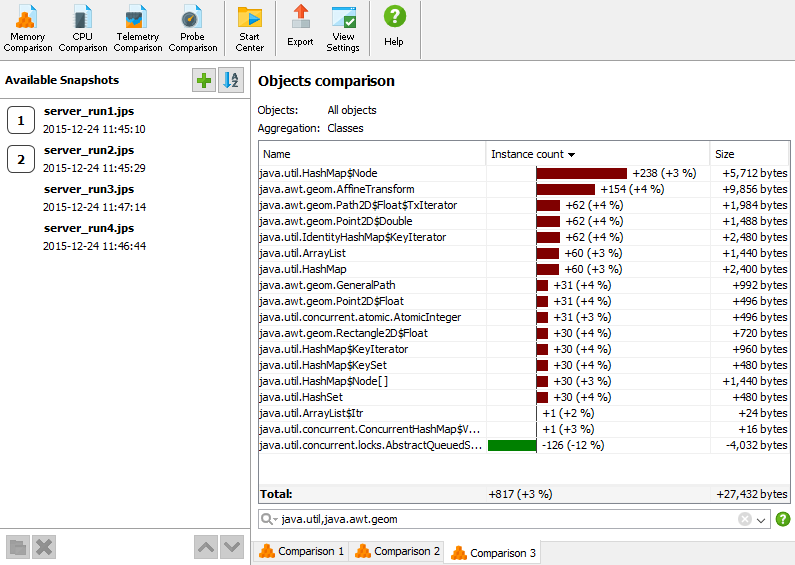
JProfiler is ideally suited as a QA tool, both during development as well as for dedicated QA teams. The rich functionality around snapshot comparisons makes it easy to track progress. JProfiler has strong support for command line operations. This includes the ability to profile, export snapshot data and create snapshots comparisons from the command line. The ant tasks bundled with JProfiler allow you to perform all command line operations from your build script.
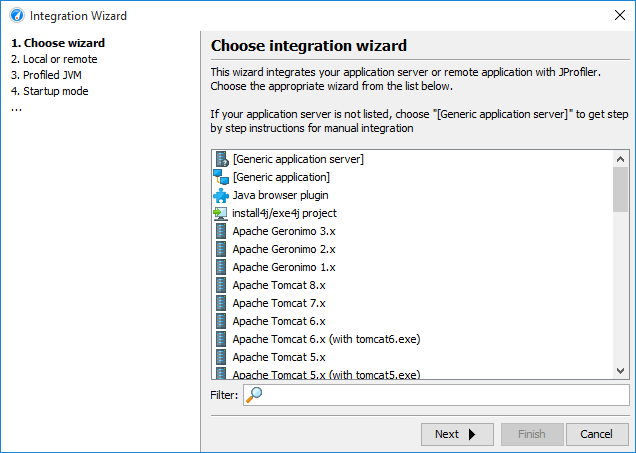
JProfiler integrates into your environment: We provide native agent libraries for a wide range of platforms, both for 32-bit and 64-bit JVMs. Integrations into all popular IDEs makes profiling during development as easy as running your application. And the large number of integrations wizards for nearly all application servers on the market ensures that you can get started with a few clicks and not with reading documentation.
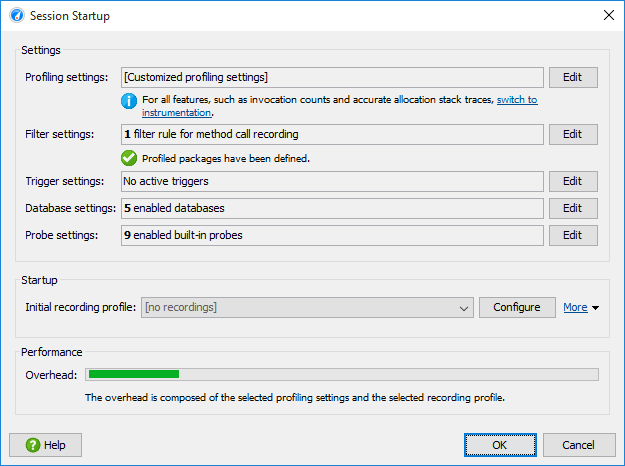
JProfiler records data only when you need it. In fact, you can start your application with the JProfiler agent and attach the JProfiler GUI at a later time. When you do not record any data, the overhead is extremely small. That's what we call on demand profiling. Invariably, there are a lot of things you can adjust in an advanced profiler. JProfiler shows you how your profiling settings will impact performance and offers you templates to quickly select profiling settings for common use cases.
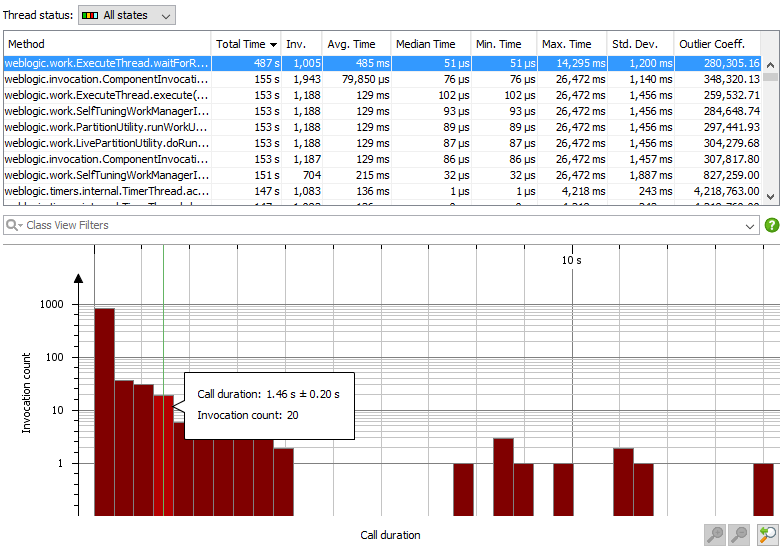
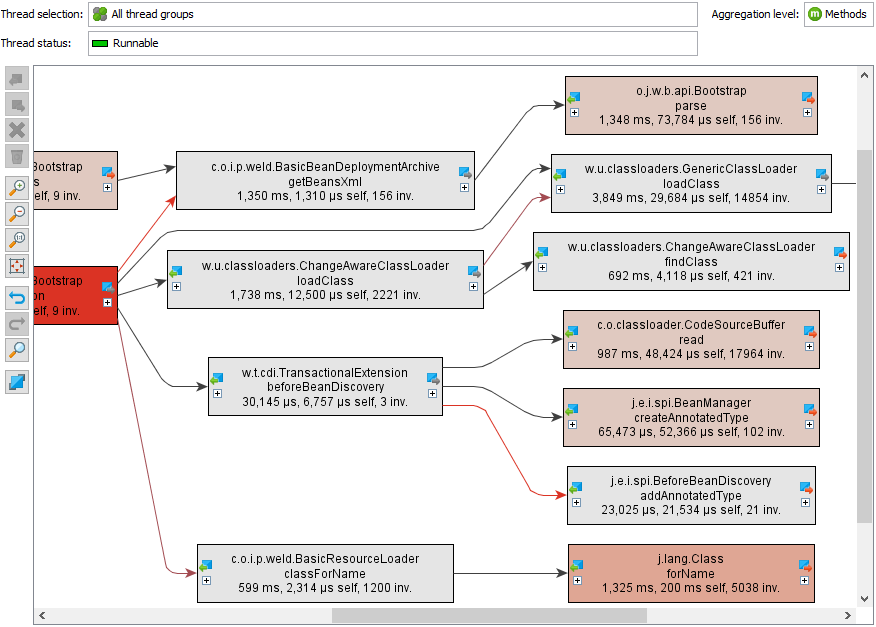
Fixing performance bottlenecks is the most frequent use case for a profiler. However, CPU data can be overwhelming in its level of detail and the way data is collected can make a huge difference in usability. With JProfiler, you have a decisive advantage when trying to find the reason for a problem. Call tree view filters, aggregation levels and thread status selectors are just some examples of JProfiler's versatility in this area.
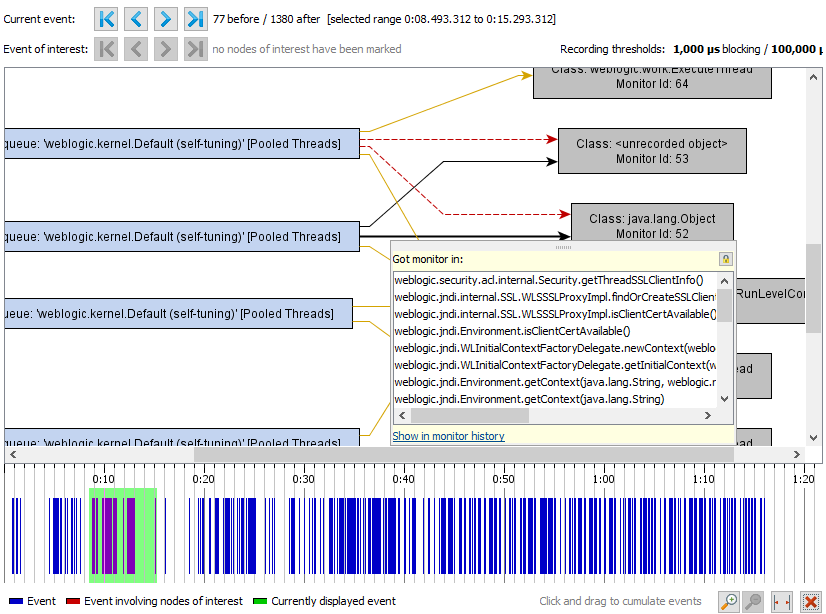
Problems related to threading are much more frequent than one might assume. Without a thread profiler, you only have a minimal chance to tackle such issues. A whole range of otherwise opaque problems can be solved when using JProfiler, such as increasing liveness in a multi-threaded application that uses too much locking. Thread profiling not only has a separate view section in JProfiler, it is also tightly integrated into the CPU profiling views.
JProfiler supports profiling on the following platforms:

Windows

macOS

Linux

FreeBSD

Solaris

AIX

HP-UX
We're regularly recording new screencasts for JProfiler in our blog. A filtered list of screencasts for all products can be viewed directly in the blog.

Best Java Profiling / Testing Tool