JProfiler's offline profiling capability allows you to run profiling sessions from
the command line without the need for starting JProfiler's GUI front end. Offline profiling
makes sense if you want to
-agentpath:[path to jprofilerti library]:
A summary of all library parameters is available in the remote session invocation table. If you profile on a machine where JProfiler is not installed, you will need to transfer the contents of the bin/{your platform} directory as well as the JAR file bin/agent.jar and the config file {User home directory}/.jprofiler10/config.xml. Example: A typical invocation for offline profiling will look like this: java "-agentpath:C:\Program Files\jprofiler10\bin\windows\jprofilerti.dll=offline,id=109,config=C:\Users\bob\.jprofiler10\config.xml"
-classpath myapp.jar com.mycorp.MyApp
Please study the remote session invocation table to generate the correct invocation for your JVM. Also, please don't forget that the platform-specific native library path has to be modified, just like for remote profiling. |
With the command line utility bin/jpenable, you can start offline profiling in any running JVM
with a version of 1.6 or higher. With command line arguments you can automate the process so that it requires no user input.
The supported arguments are:
  Usage: jpenable [options]

  jpenable starts the profiling agent in a selected local JVM, so you can connect
  to it from a different computer. If the JProfiler GUI is running locally, you
  can attach directly from the JProfiler GUI instead of running this executable.

  * if no argument is given, jpenable attempts to discover local JVMs that
    are not being profiled yet and asks for all required input on the command
    line.
  * with the following arguments you can partially or completely supply all
    user input on the command line:

    -d  --pid=PID      The PID of the JVM that should be profiled
    -n  --noinput      Do not ask for user input under any circumstances

    GUI mode: (default)
    -g  --gui          The JProfiler GUI will be used to attach to the JVM
    -p  --port=nnnnn   The port no which the profiling agent should listen for a
                       connection from the JProfiler GUI

    Offline mode:
    -o  --offline      The JVM will be profiled in offline mode
    -c  --config=PATH  Path to the config file that holds the profiling settings
    -i  --id=ID        ID of the session in the config file. Not required, if
                       the config file holds only a single session.

  Note that the JVM has to be running as the same user as jpenable, otherwise
  JProfiler cannot connect to it.
  An exception are Windows services running under the local system account if you
  list them interactively with jpenable.
If you just need a heap snapshot, consider using the jpdump
command line tool that saves an HPROF dump without loading the profiling agent into the VM.
|
If the generated snapshots have heap dumps in them, you can use the jpanalyze
executable to prepare the heap dump analysis in advance.
Opening the snapshot in the JProfiler GUI will then be very fast.
The executable is named jpanalyze.exe on Windows and jpanalyze
on Unix-based operating systems and is located in the bin directory of
a JProfiler installation. If you execute it with the -help option, you will
get help on its usage:
  Usage: jpanalyze [options] "snapshot file" ["snapshot file" ...]

  where "snapshot file" is a snapshot file with one of the extensions:
             .jps, .hprof, .hpz, .phd
        [options] is a list of options in the format -option=value

  Options:
      -obfuscator=none|proguard|yguard
          Deobfuscate for the selected obfuscator. Defaults to "none", for other
          values the mappingFile option has to be specified.
      -mappingfile=[file]
          The mapping file for the selected obfuscator.
      -removeunreferenced=true|false
          If unreferenced or weakly referenced objects should be removed.
      -retained=true|false
          Calculate retained sizes (biggest objects). removeunreferenced will be
          set to true.
      -retainsoft=true|false
          If unreferenced objects are removed, specifies if soft references
          should be retained.
      -retainweak=true|false
          If unreferenced objects are removed, specifies if weak references
          should be retained.
      -retainphantom=true|false
          If unreferenced objects are removed, specifies if phantom references
          should be retained.
      -retainfinalizer=true|false
          If unreferenced objects are removed, specifies if finalizer references
          should be retained.
The removeUnreferenced, the retained and all the retain*
command line options correspond to the options in the
heap walker options dialog.
|
| If you start your application from an ant build file, you can use the ant task to easily profile your application in offline mode. |
| If you already have a launched "Application" session defined, you can generate a start script for offline profiling with the local to offline conversion wizard on the "Convert" tab of the start center or by selecting Session->Conversion Wizards->Convert Application Session To Offline from the main menu. |
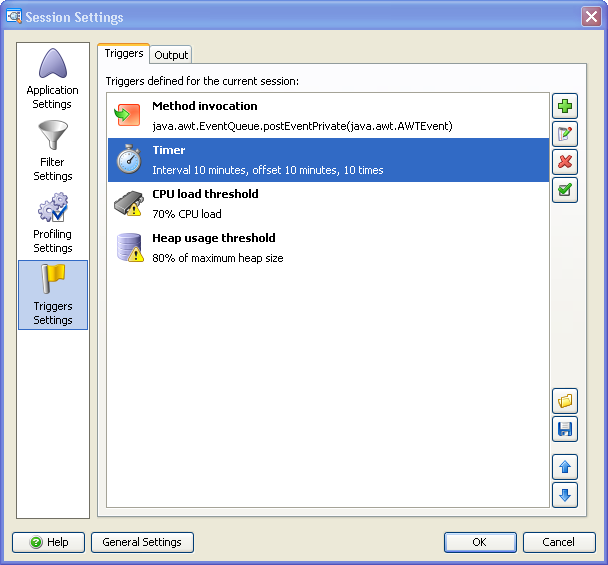
To control CPU profiling, triggering of heap dumps and saving of snapshots during
an offline profiling session, you can use the
|
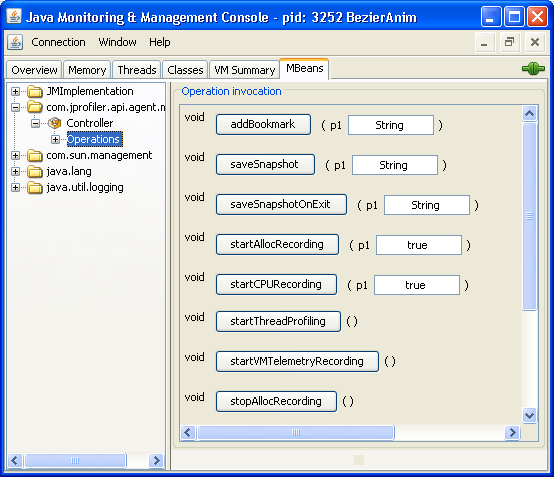
| If wish to analyze profiling information at run-time, you can use the profiling platform that is part of JProfiler. Please see the javadoc in $JPROFILER_HOME/api/javadoc and the sample in $JPROFILER_HOME/api/samples/platform for more information. |