|
With JProfiler integrated into Oracle's
NetBeans(TM),
JProfiler can be invoked from within the IDE without any further need for
session configuration.
Requirements: NetBeans 6.x, 7.x or 8.x. |
|
The installation of the NetBeans plugin is started by selecting "NetBeans IDE [your version]" on the
Reminder: Please close NetBeans while performing the plugin installation. If you are performing the installation from JProfiler's setup wizard, please complete the entire setup first before starting NetBeans. A file selection box will then prompt you to locate the installation directory of NetBeans. In the next step, you are asked whether the installation should be performed globally, or for a single user only. A single user installation is mostly of interest in network installations where the user cannot write to the NetBeans installation directory. If you decide for a single user installation, another file selection box will then prompt you to locate your NetBeans user directory. This is a version-specific directory under .netbeans in your user home directory.The NetBeans updater is then invoked and the plugin is installed. After acknowledging the completion message, you can start NetBeans and check whether the installation was successful. You should now see a menu entry Profile->Profile Main Project With JProfiler in NetBeans' main menu. |
| You can profile standard and free form projects in NetBeans. For free form projects, you have to debug your application once before trying to profile it, since the required file nbproject/ide-targets.xml is set up by the debug action. JProfiler will add a target named "profile-jprofiler" to it with the same contents as the debug target and will try to modify the VM parameters as needed. If you have problems profiling a free form project, please check the implementation of this target. |
| You can profile web applications with the integrated Tomcat or with any other Tomcat server configured in NetBeans. When your main project is a web project, selecting "Profile main project with JProfiler" (see below) starts the Tomcat server with profiling enabled. Please make sure to stop the Tomcat server before trying to profile it. |
| If you use NetBeans with the bundled GlassFish Server, you can transparently profile Java EE applications with it. When your main project is set up to use GlassFish Server, selecting "Profile main project with JProfiler" (see below) starts the application server with profiling enabled. Please make sure to stop the application server before trying to profile it. |
To profile your application from NetBeans, choose one of the profiling commands in the
Run menu or click on the corresponding toolbar button.
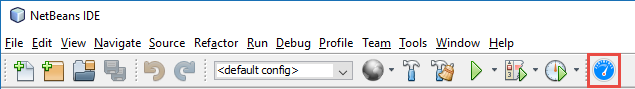 Main toolbar with "JProfiler" button 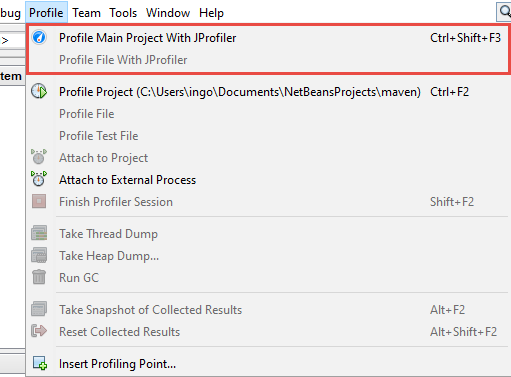 "JProfiler" menu 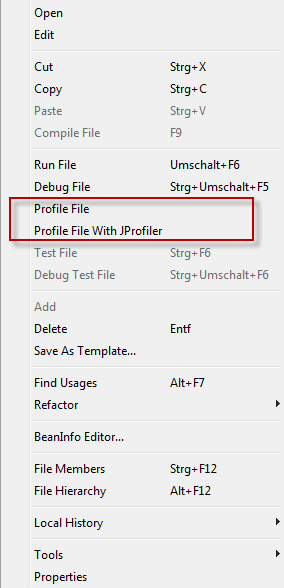 Explorer context menu with "JProfiler" action The profiled application is then started just as with the usual "Run" commands. If no instance of JProfiler is currently running, JProfiler is also started, otherwise the running instance of JProfiler will be used for presenting profiling data. When JProfiler is used with the NetBeans integration, the "Show source" action for a class or a method in one of JProfiler's view will show the source element in NetBeans and not in JProfiler's integrated source code viewer. You can also open JProfiler snapshots from NetBeans, either from the project window or the open file dialog in order to get source code navigation into NetBeans. |