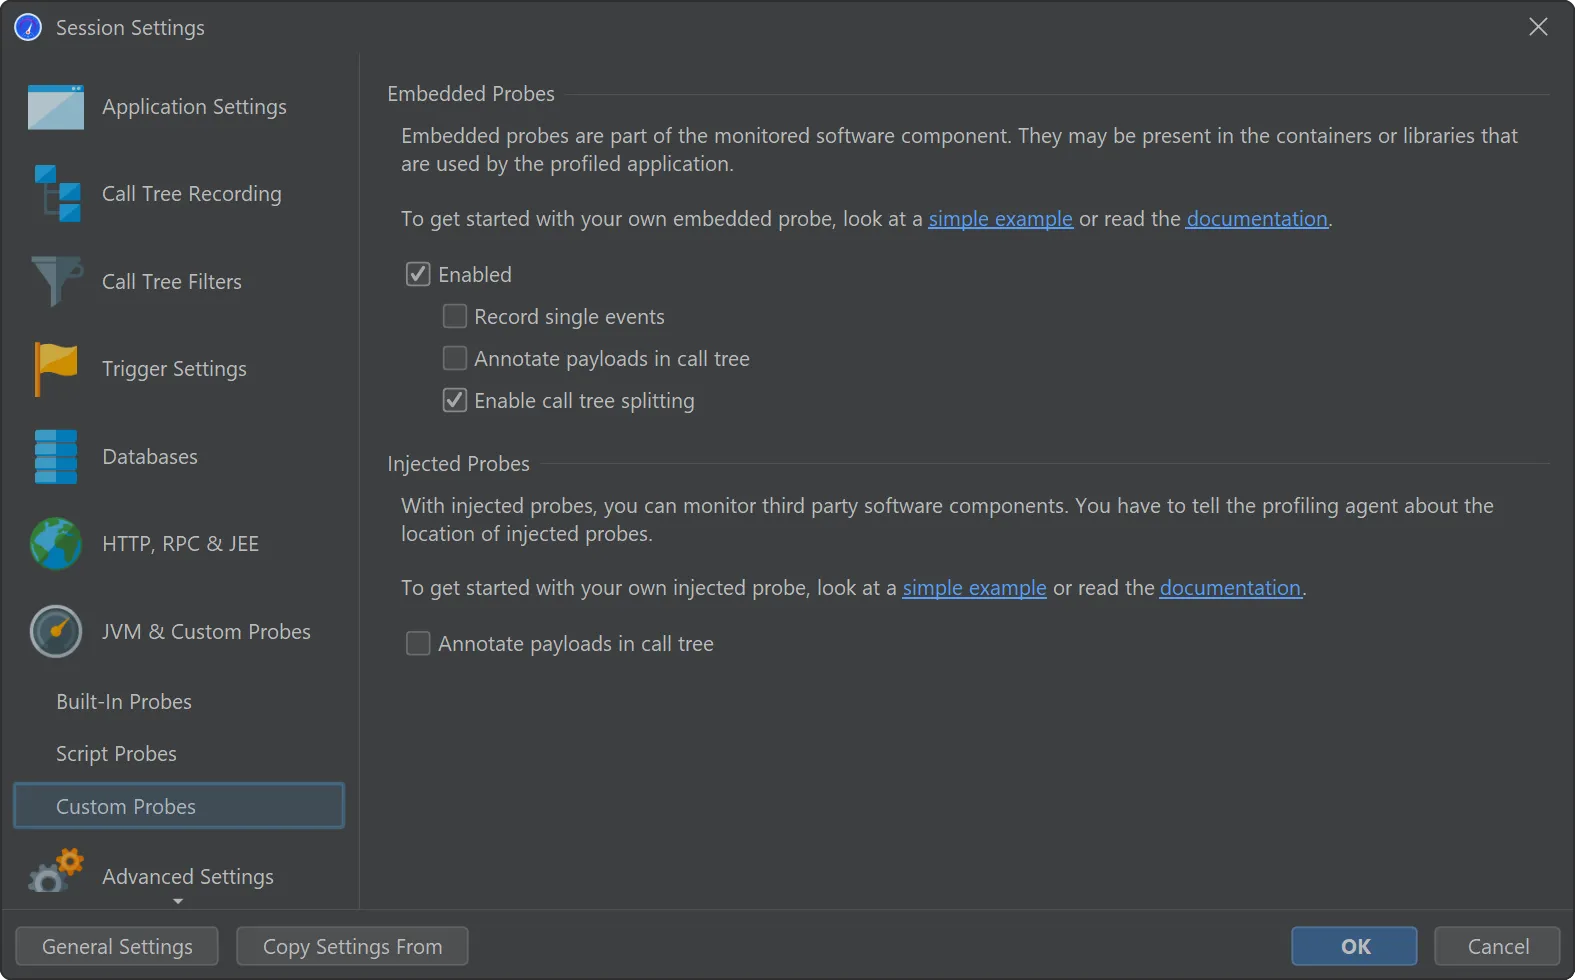
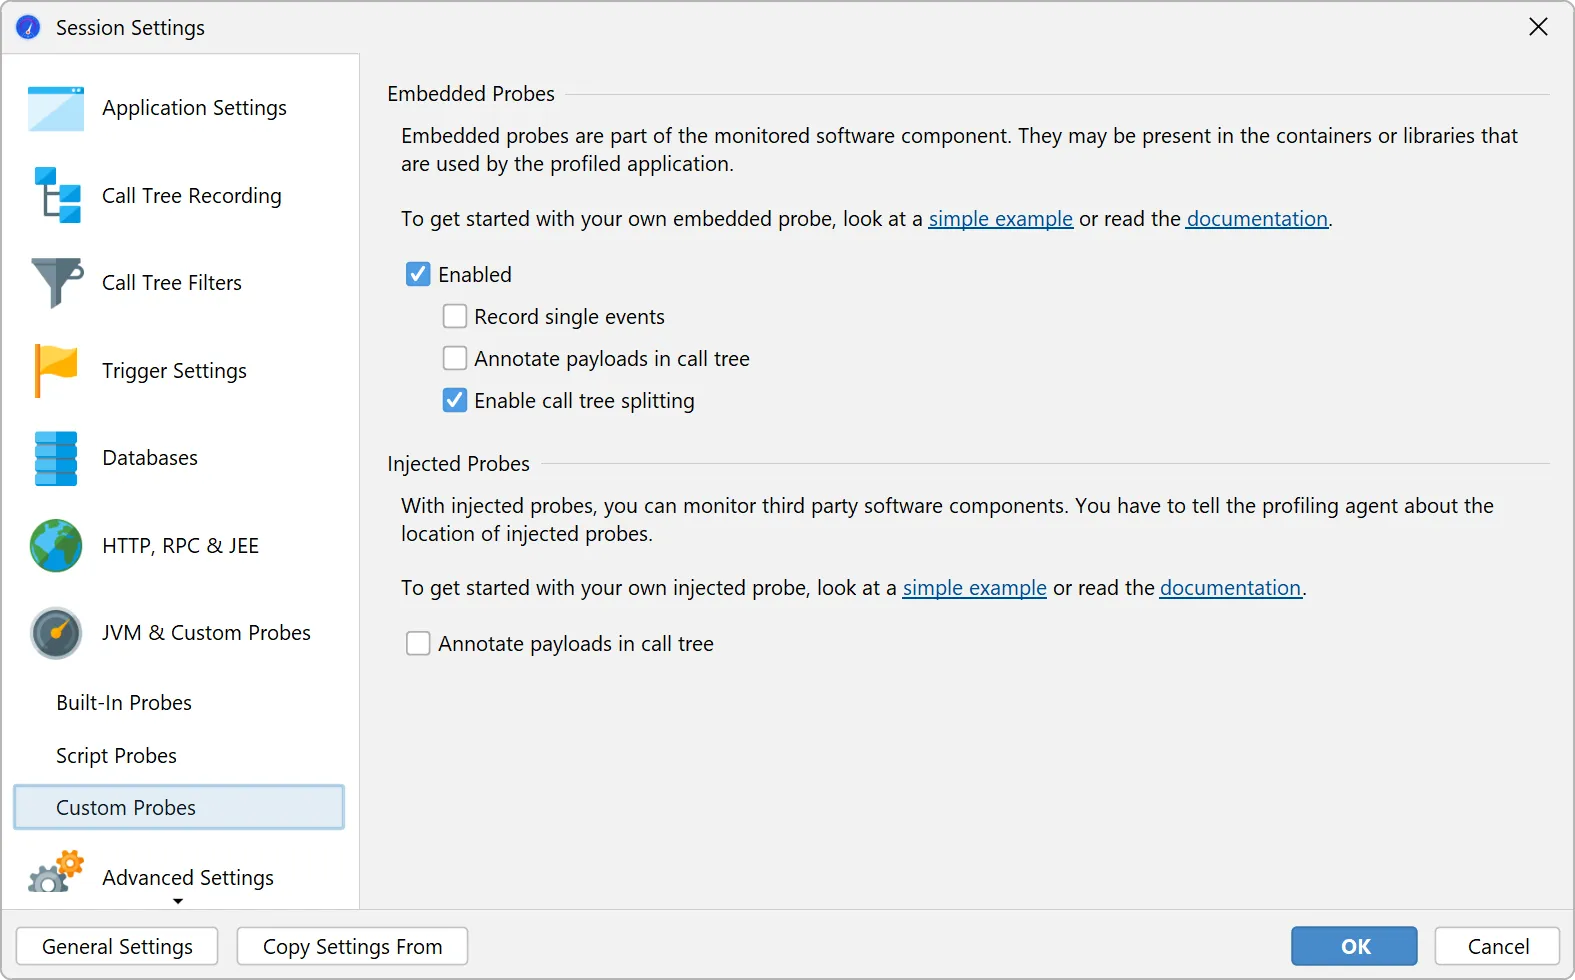
JProfiler supports the following modes of operation:
  • Live profiling of a local session
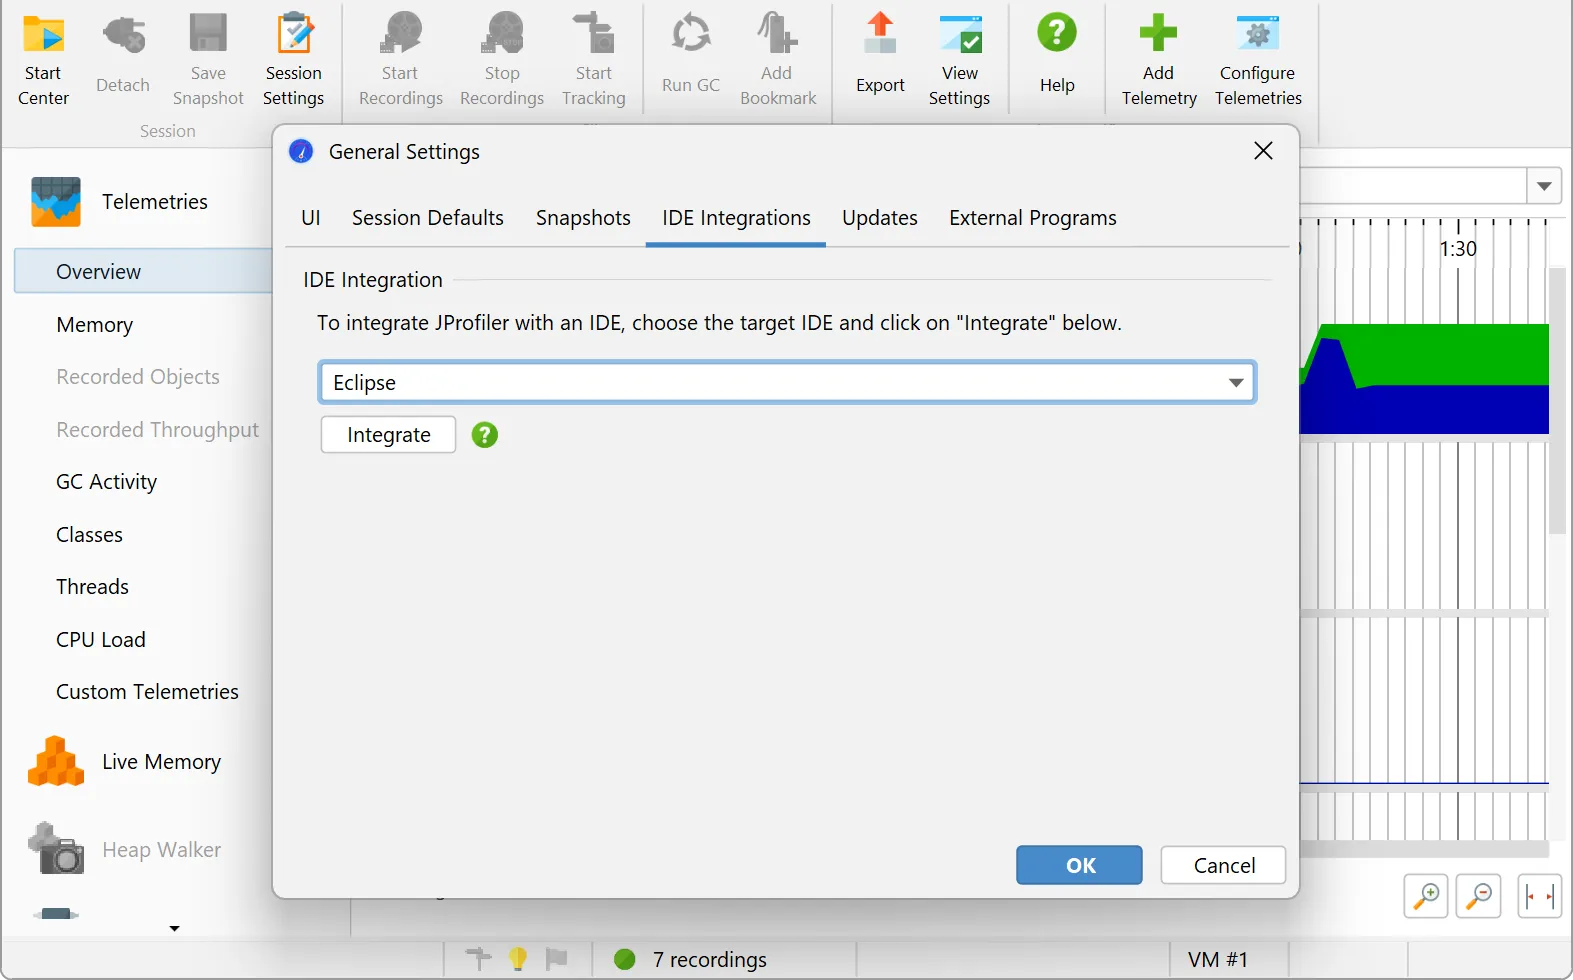
    Once you define how your application is started, JProfiler can profile it and you immediately see live data from the profiled JVM. To eliminate the need for session configuration, you can use one of the many IDE plugins to profile the application from within your favorite IDE.
  • Live profiling of a remote session
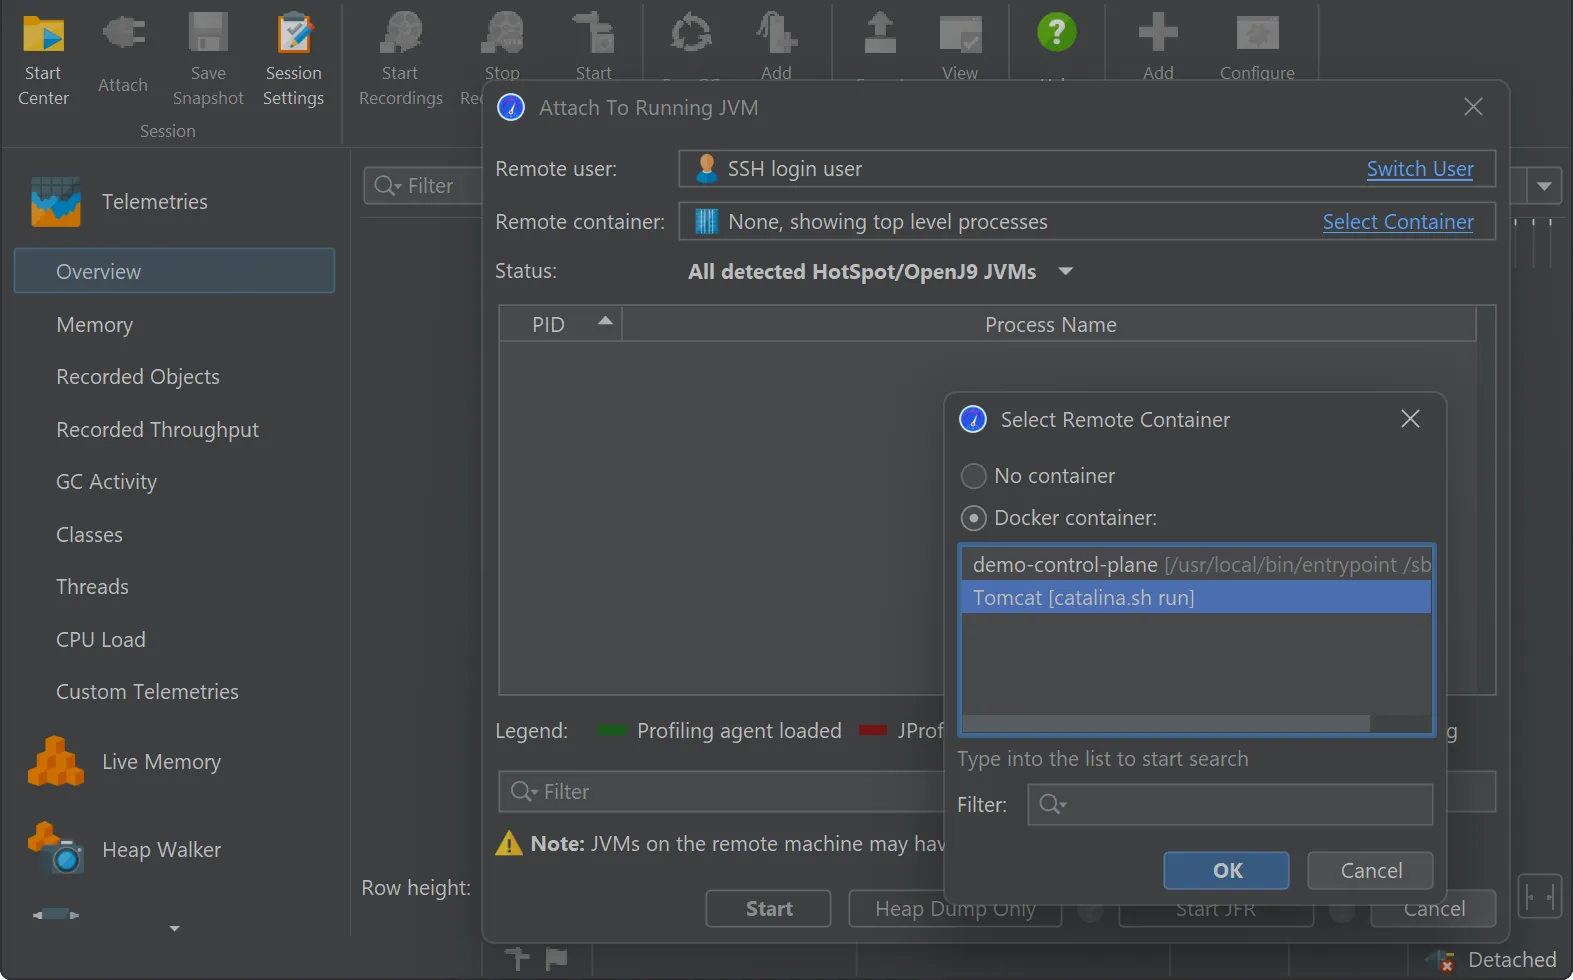
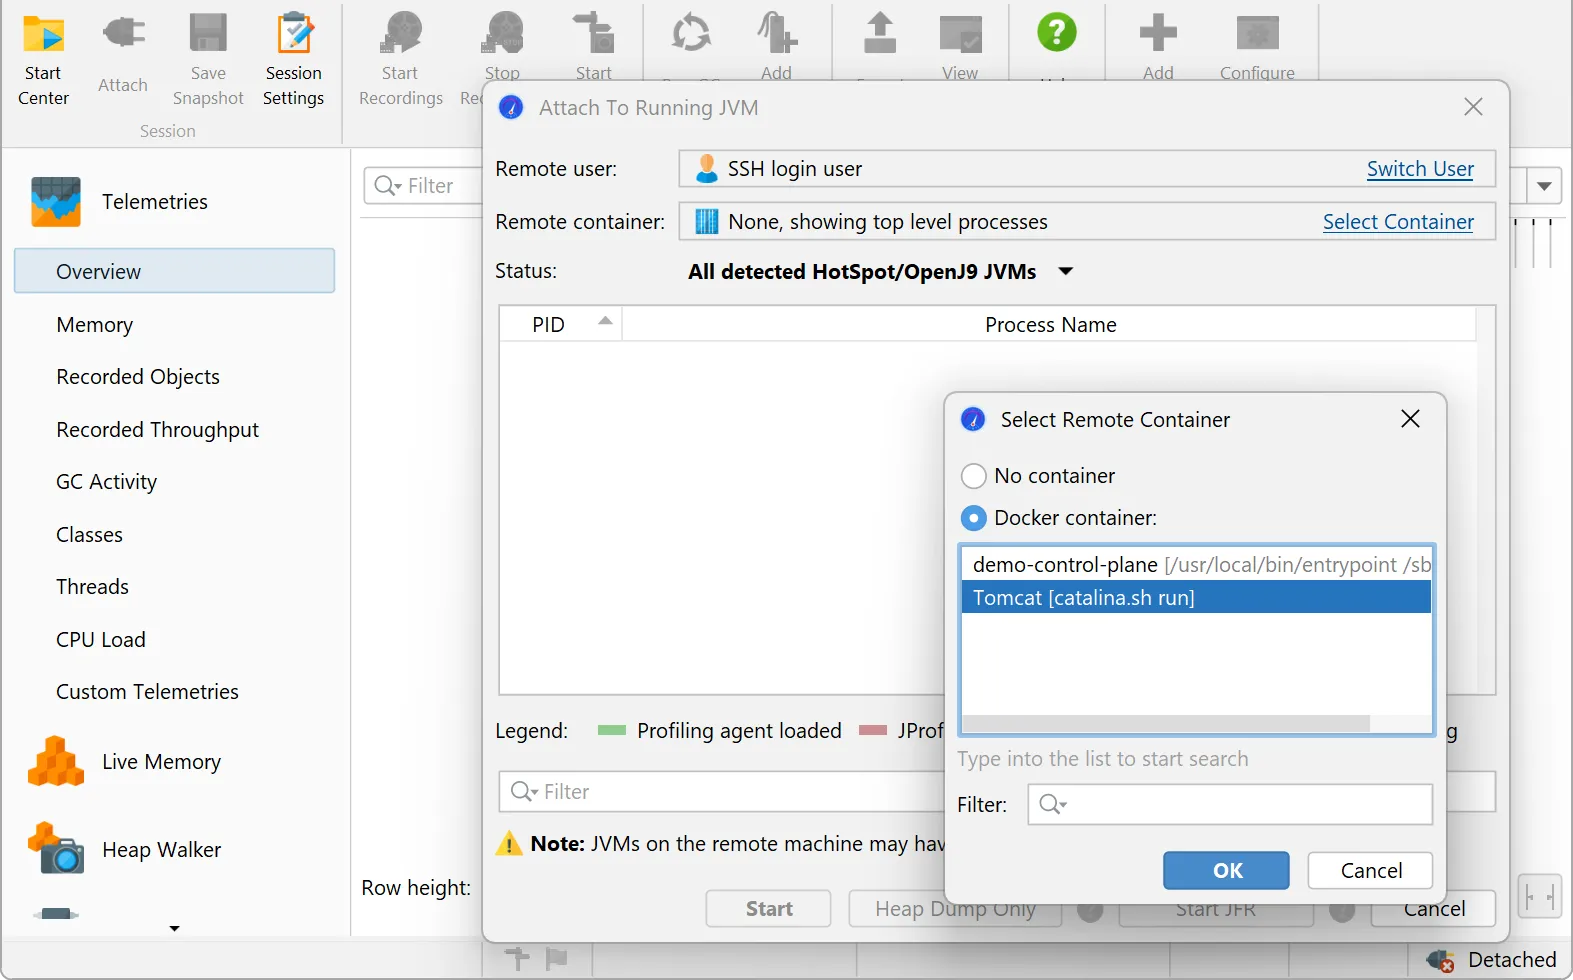
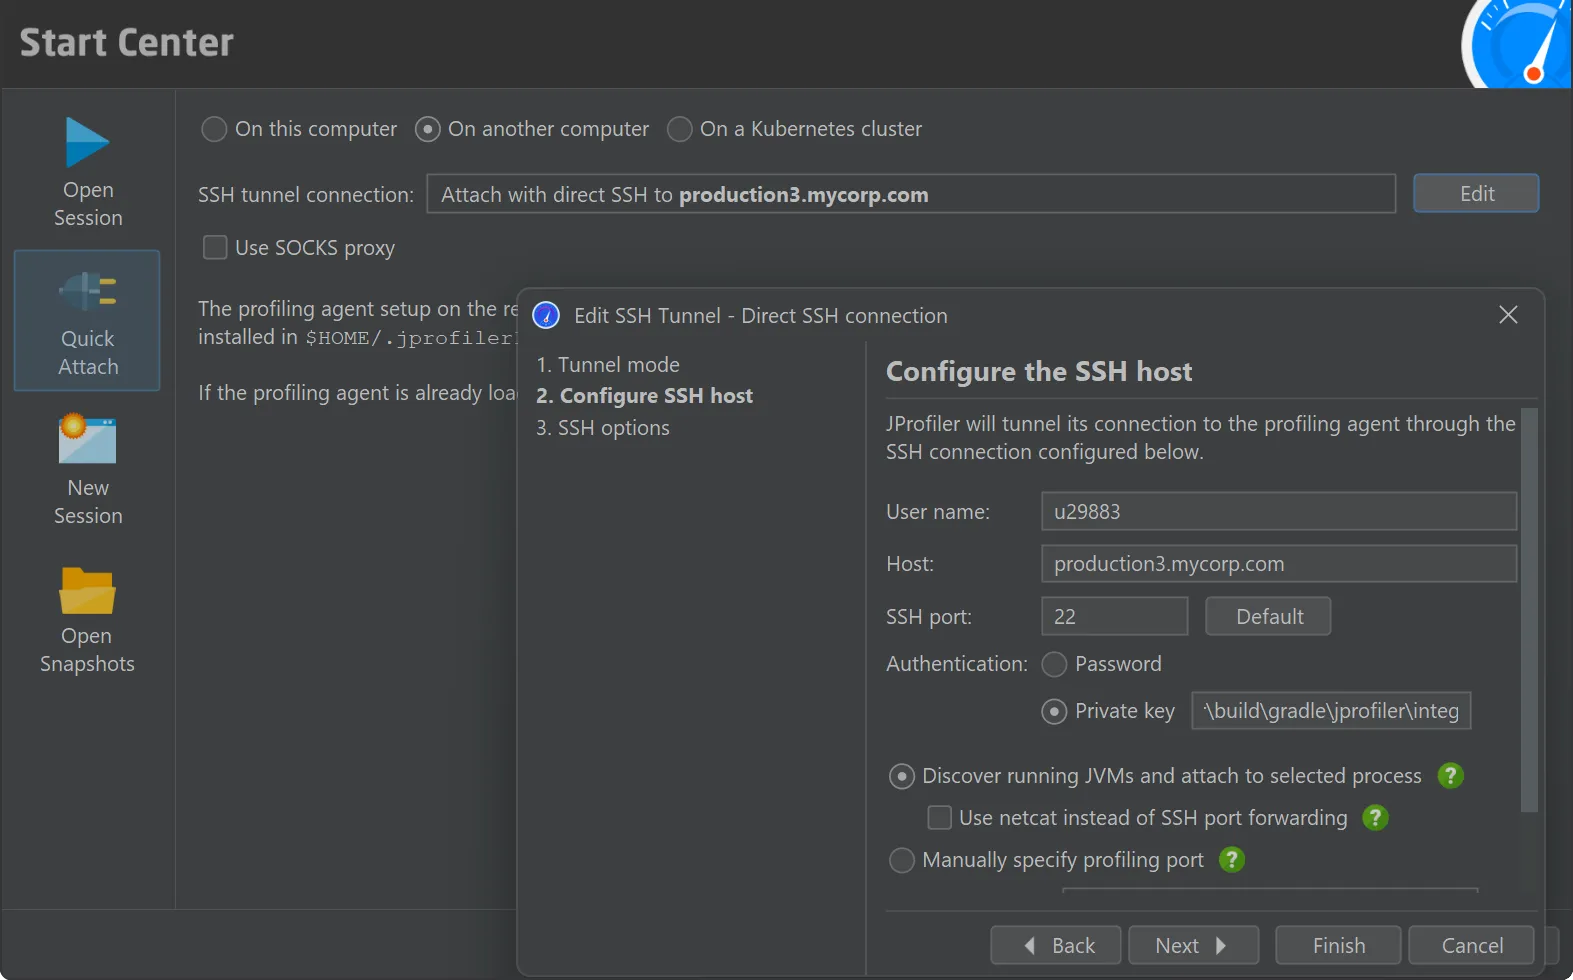
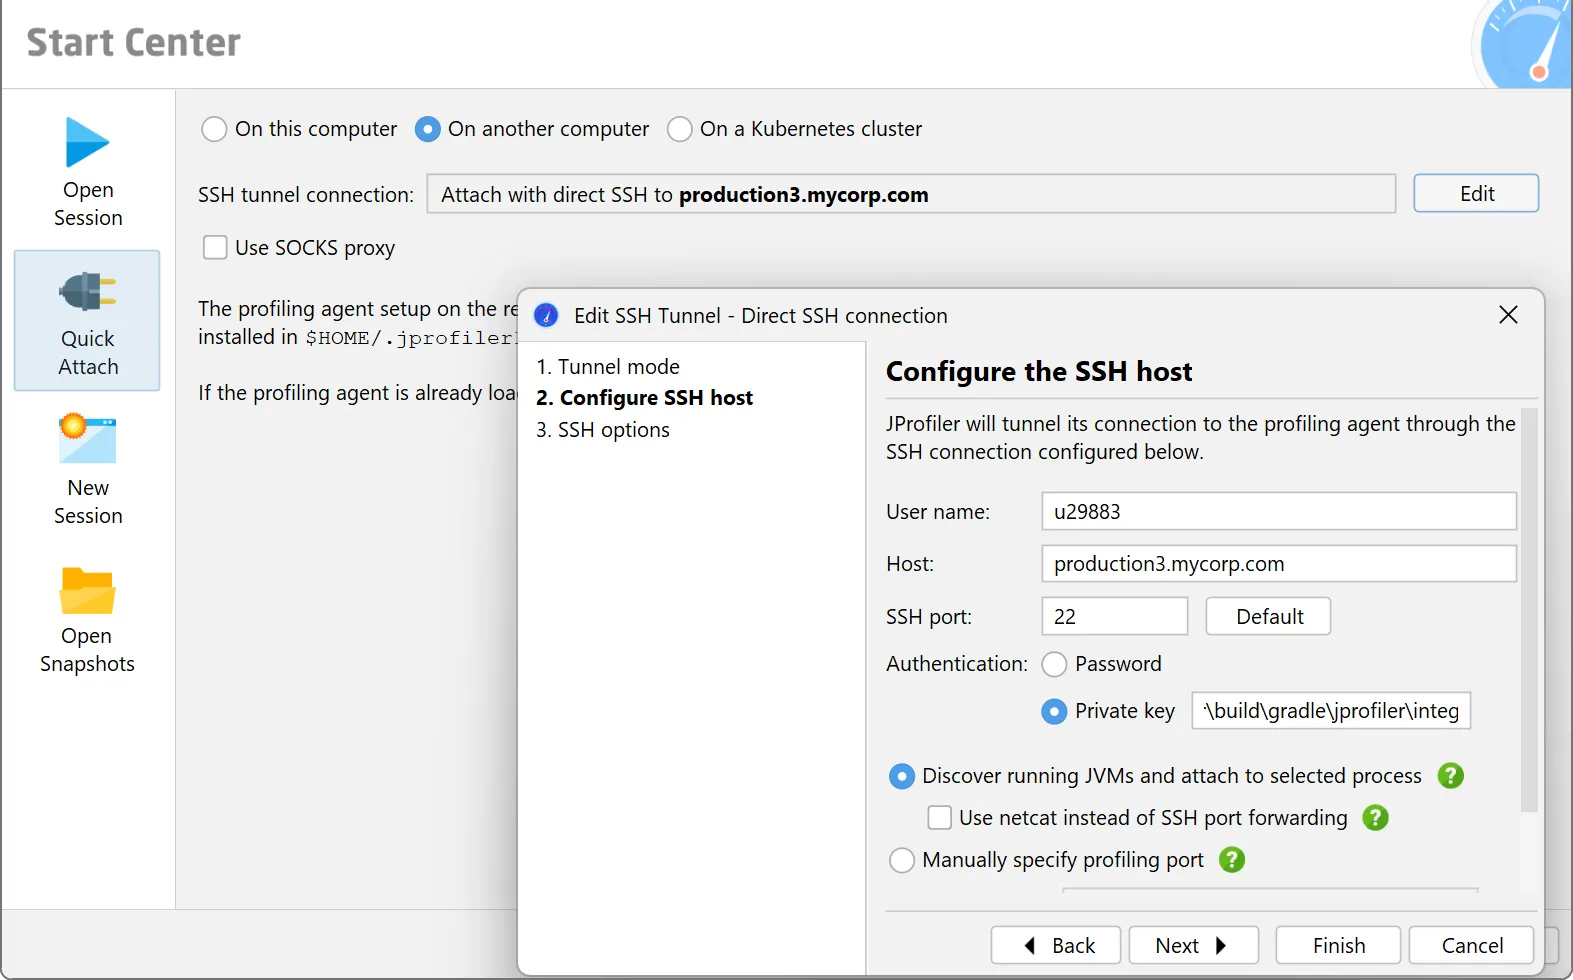
    By modifying the VM parameters of the java start command you can get any Java application to listen for a connection from the JProfiler GUI. The profiled application can not only run on your local computer, JProfiler can attach to a profiled application over the network. In addition, JProfiler provides numerous integration wizards for all popular application servers that help you in setting up your application for profiling.
  • Offline profiling and triggers
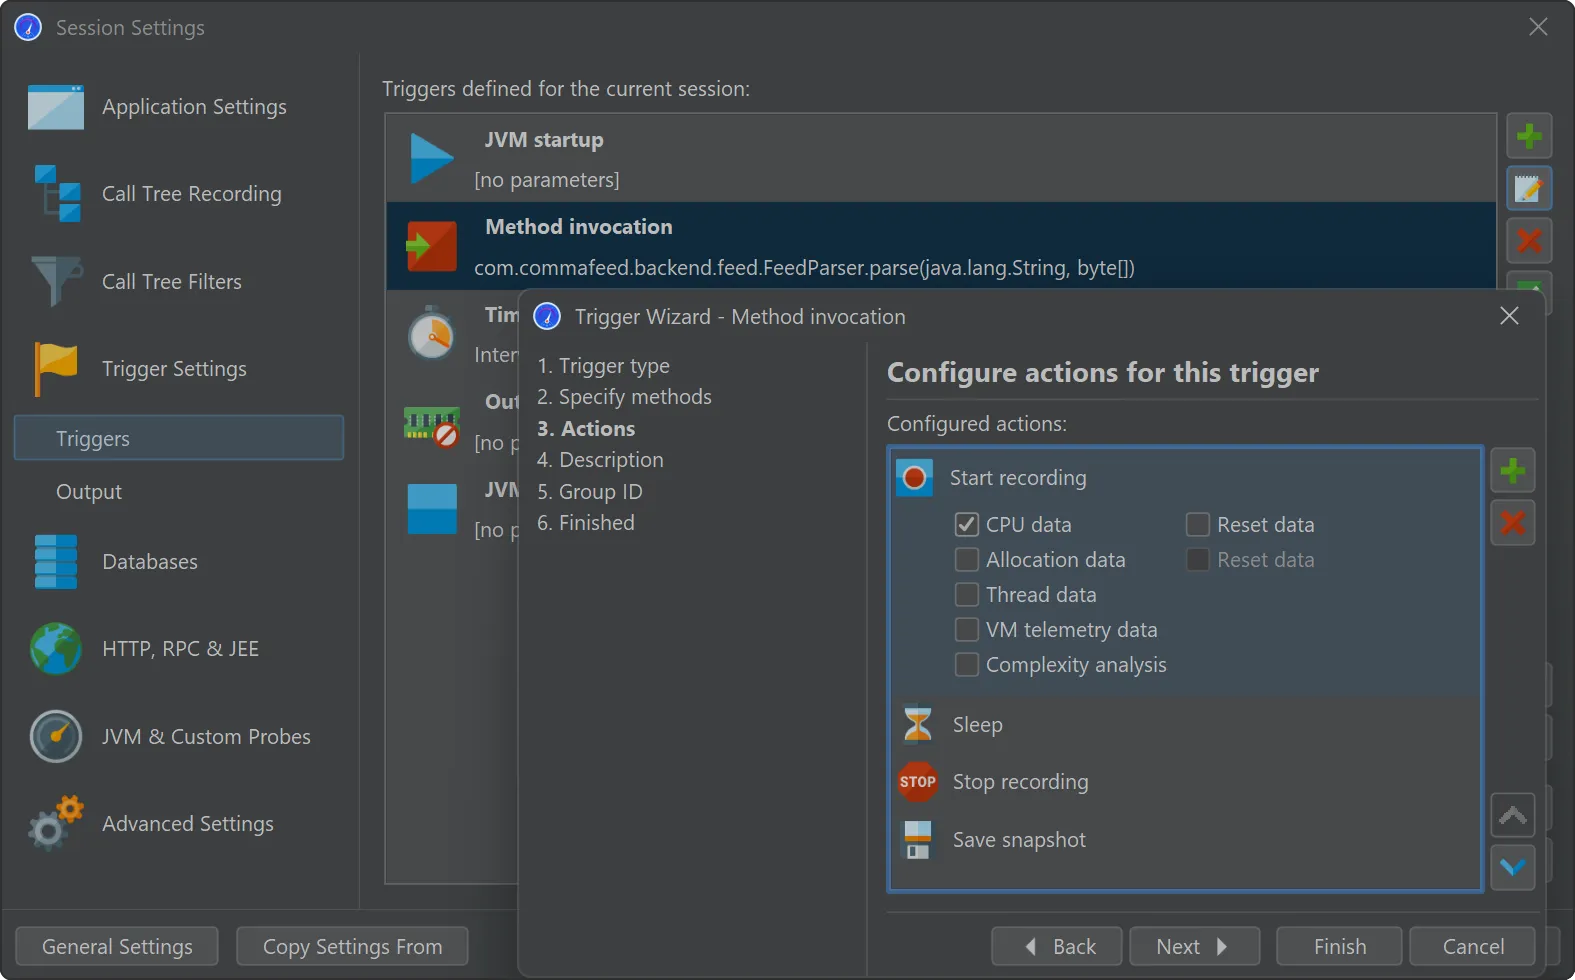
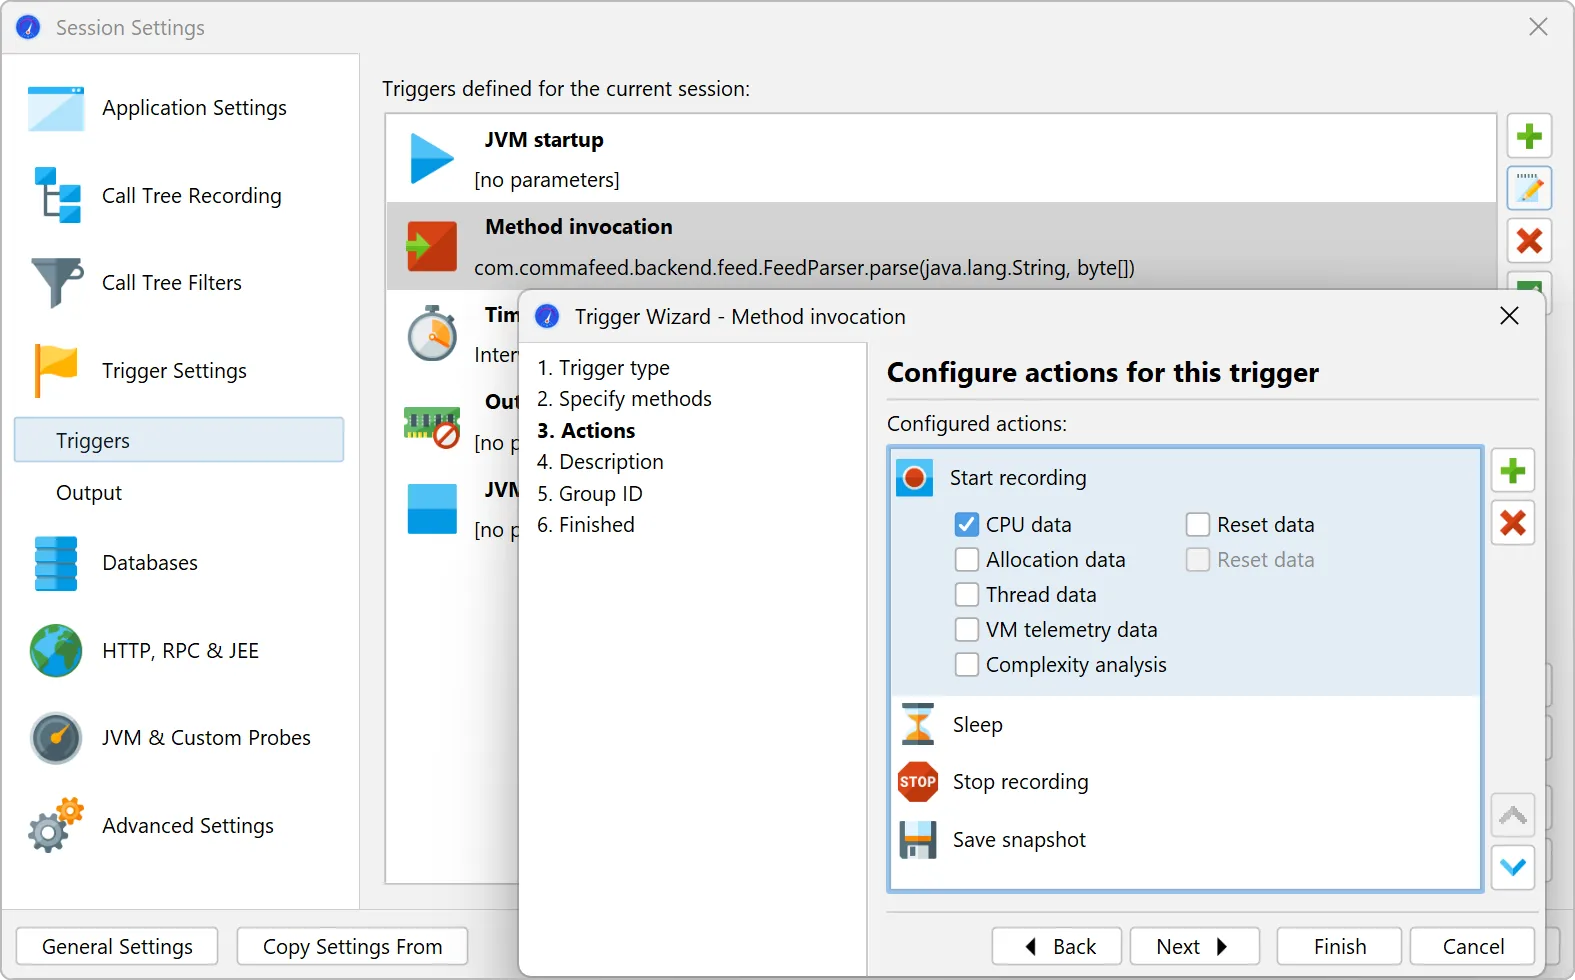
    You do not have to connect with the JProfiler GUI to the profiled application in order to profile it: With offline profiling you can use JProfiler's powerful trigger system or the JProfiler API to control the profiling agent and save snapshots to disk. At a later time you can open these snapshots in the JProfiler GUI or programmatically export profiling views with the command line export tool or the export ant task.
  • Snapshot comparisons
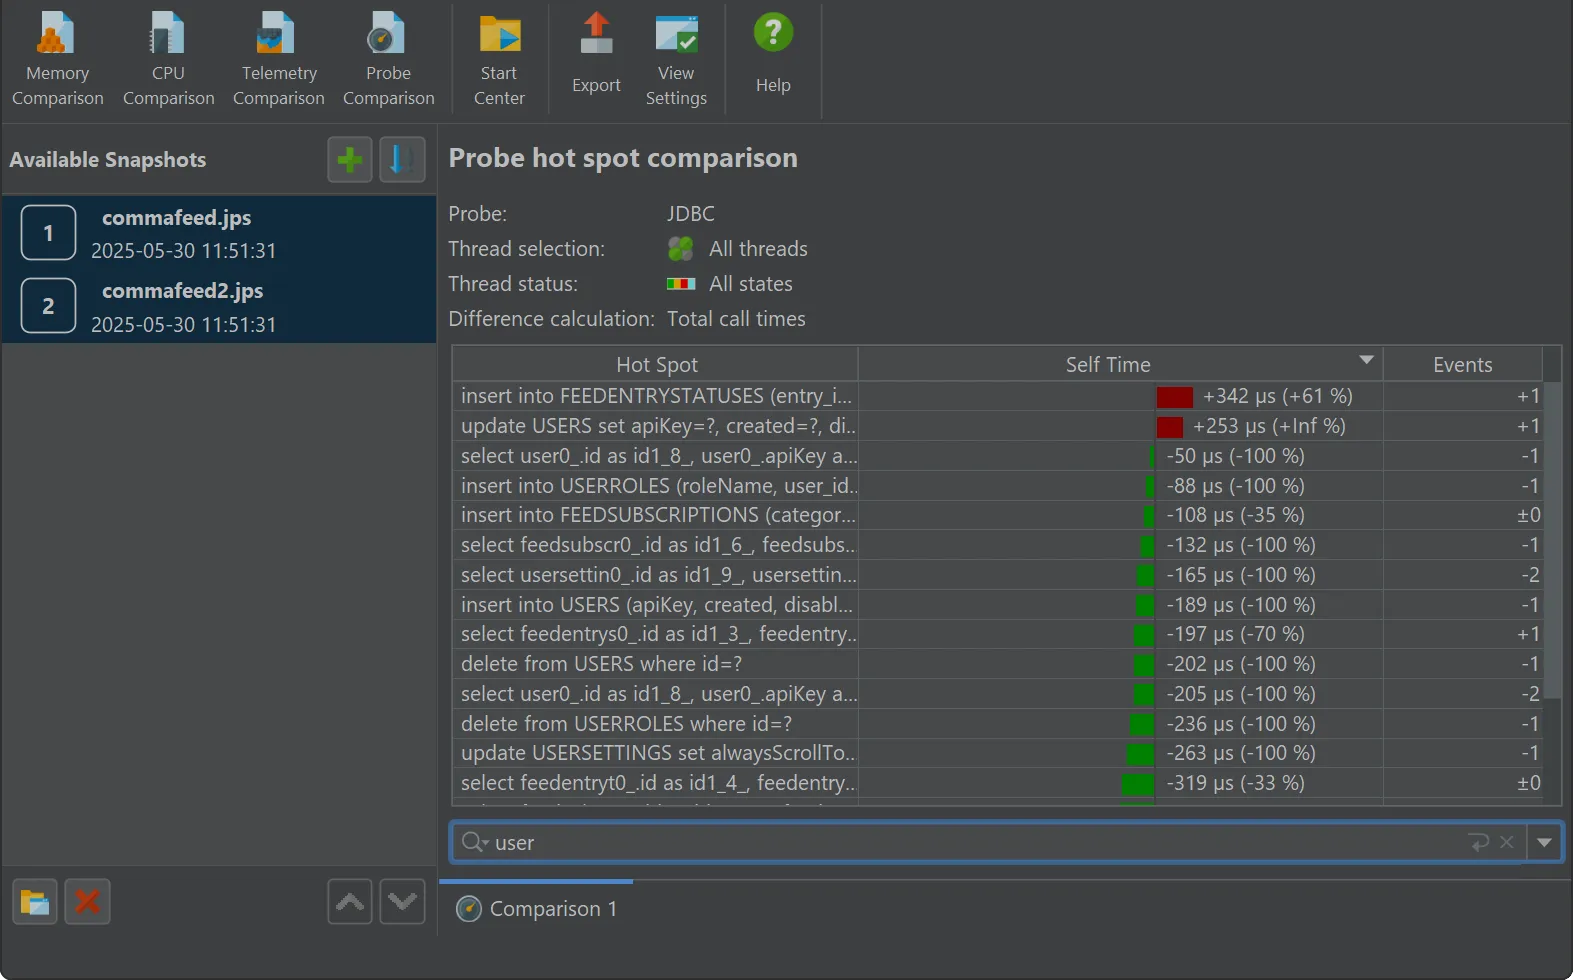
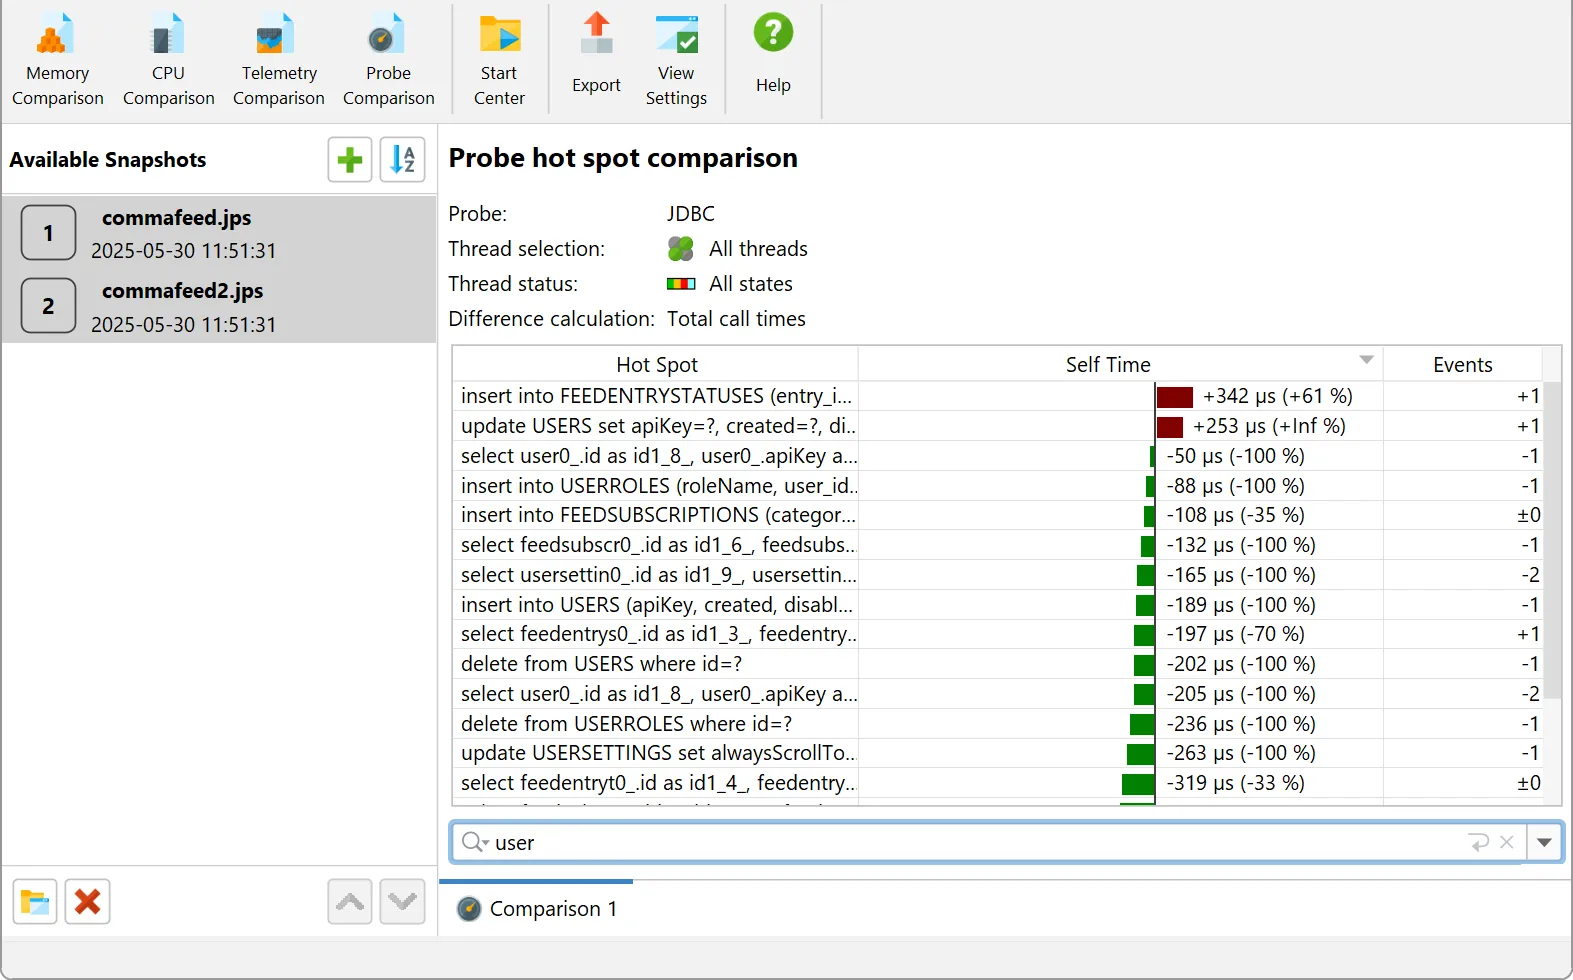
    In JProfiler, you can save a snapshot of all current profiling data to disk. JProfiler offers a rich comparison facility to see what has changed between two or more snapshots. Alternatively you can create comparison reports programmatically with the command line comparison tool or the comparison ant task.
  • Viewing an HPROF snapshot
    JProfiler can open HPROF snapshots that have been taken with JVM tools such as jconsole or jmap or that have been triggered by the -XX:+HeapDumpOnOutOfMemoryError JVM parameter.
  • Request tracking

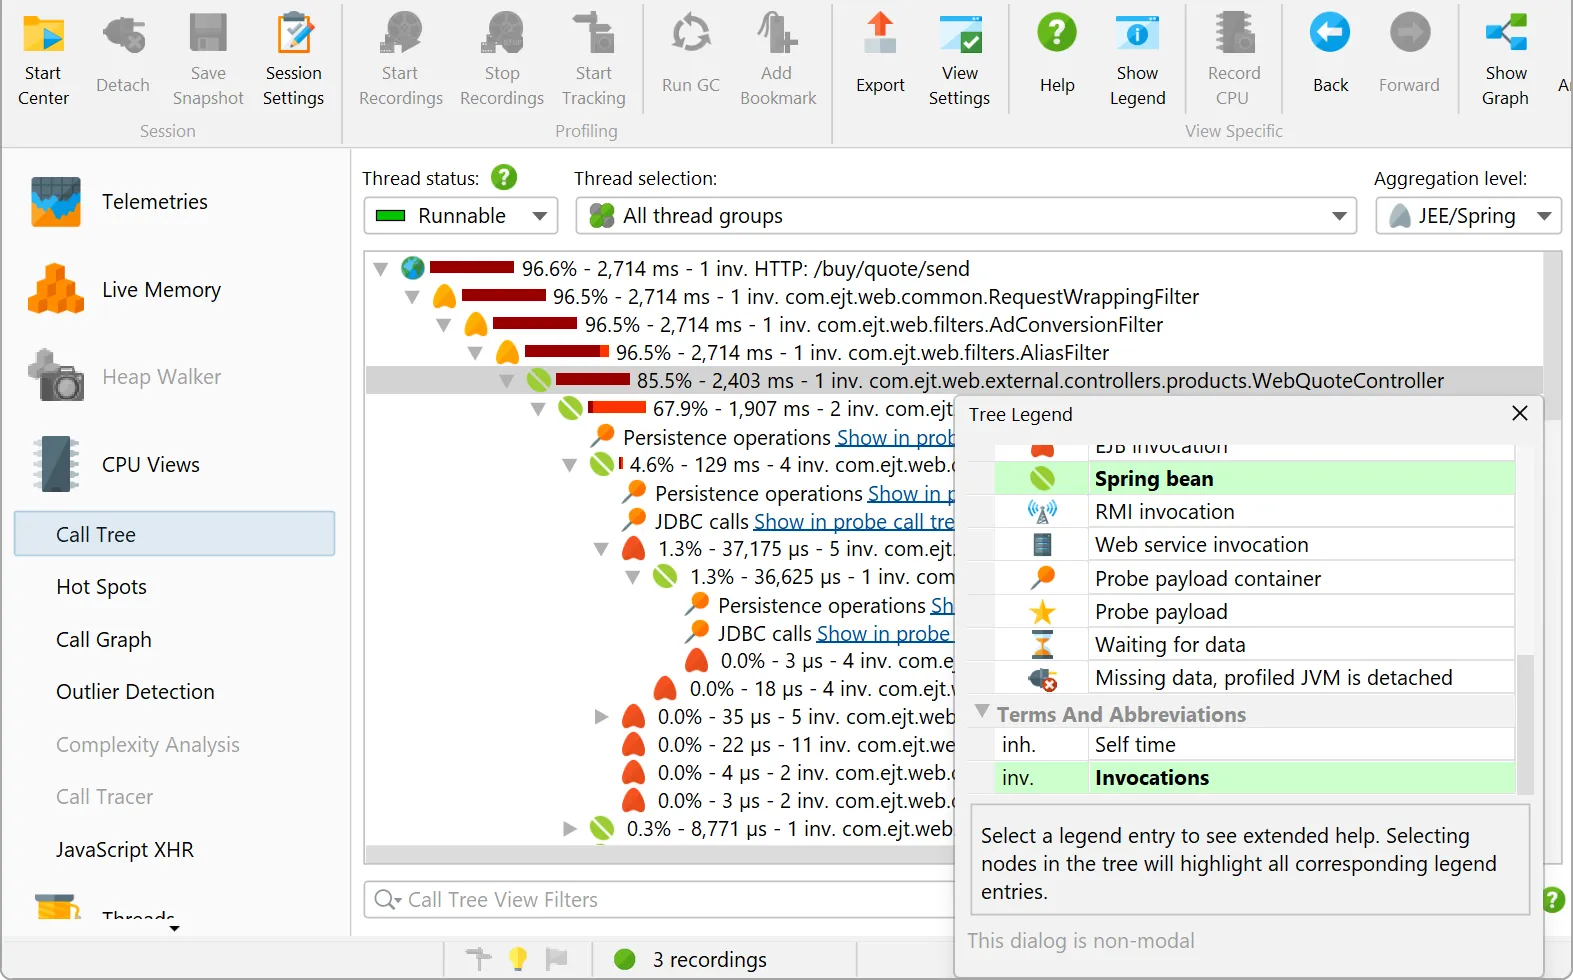
    With the innovative concept of request tracking, JProfiler makes profiling of parallel and multi-threaded programming much easier. Request tracking connects call sites with execution sites between different threads with hyperlinks in the call tree view. The following multi-threaded systems can be tracked:

    • Executors from the java.util.concurrent package
    • Kotlin coroutines
    • AWT events
    • SWT events
    • Thread starts

    In addition, JProfiler can track calls across JVM boundaries if both JVMs are profiled and open in JProfiler. The following remote calls can be tracked.

    • HTTP requests
    • RMI calls
    • Web service calls
    • Remote EJB calls
    • gRPC calls
  • Easy creation of custom probes
    JProfiler offers a custom probe wizard that allows you to define your custom probes directly in the JProfiler GUI. Your custom probes are deployed to the profiled application by JProfiler and you do not even have to restart the profiled application when changing or adding custom probes.
The following gives a high level overview of the profiling views in JProfiler:
Memory profiling

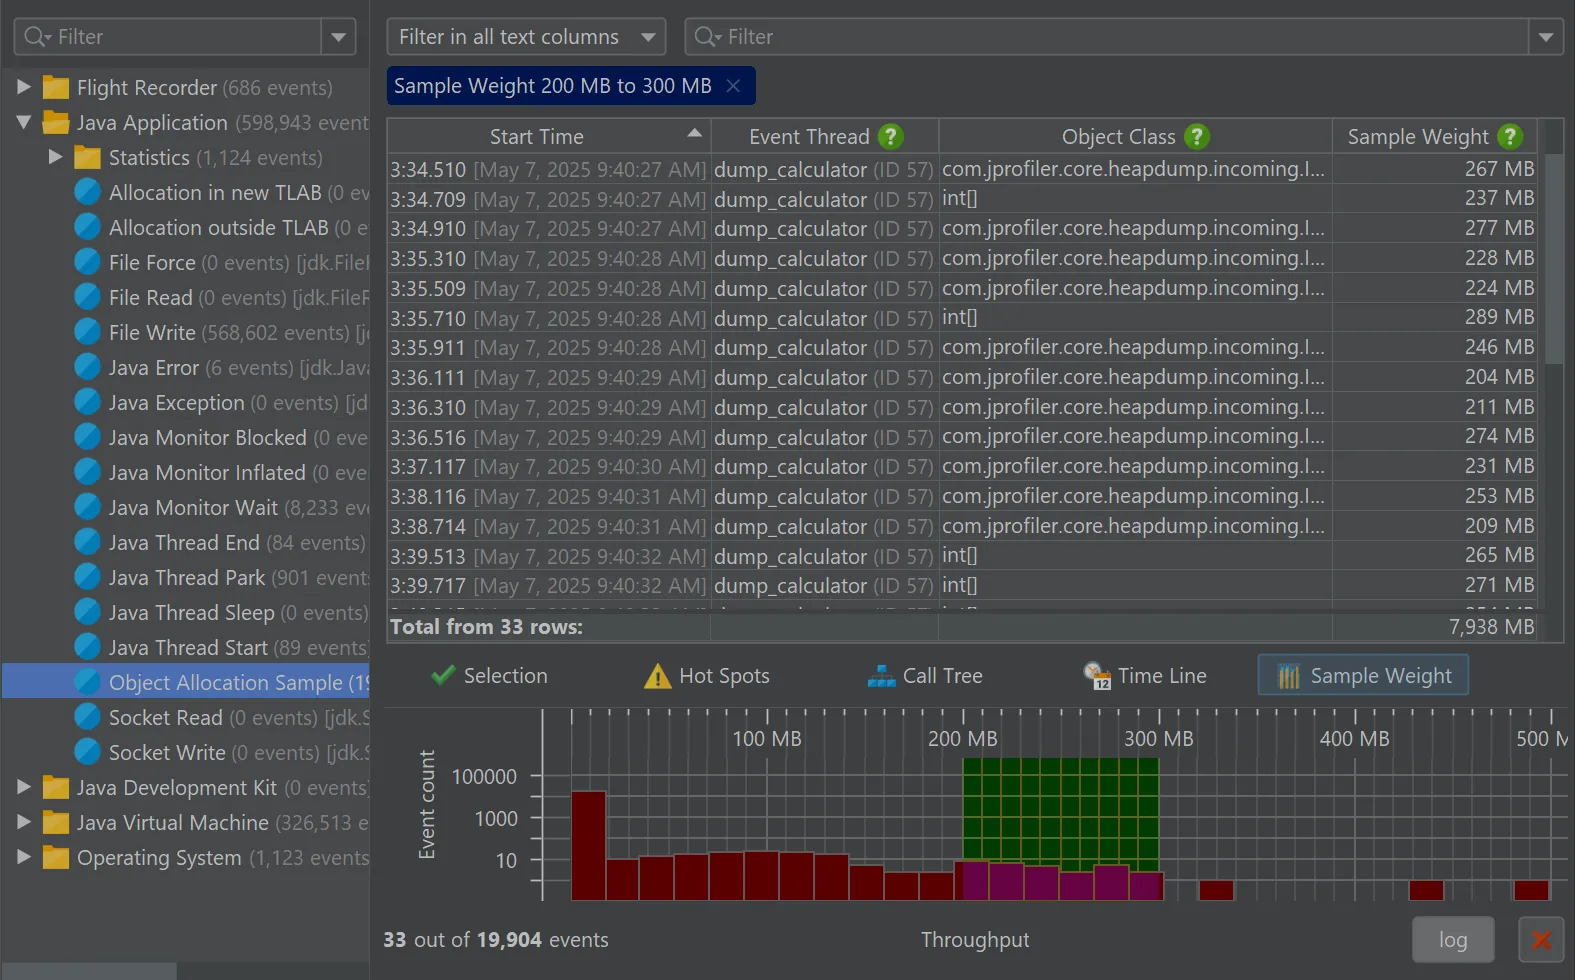
JProfiler's memory view section offers dynamically updated views on memory usage and views that show information about allocations spots. All views have several aggregation levels and can show live and garbage collected objects
  • All objects
    Shows classes or packages of all objects on the heap with instance counts and size information. You can mark current values and show differences.
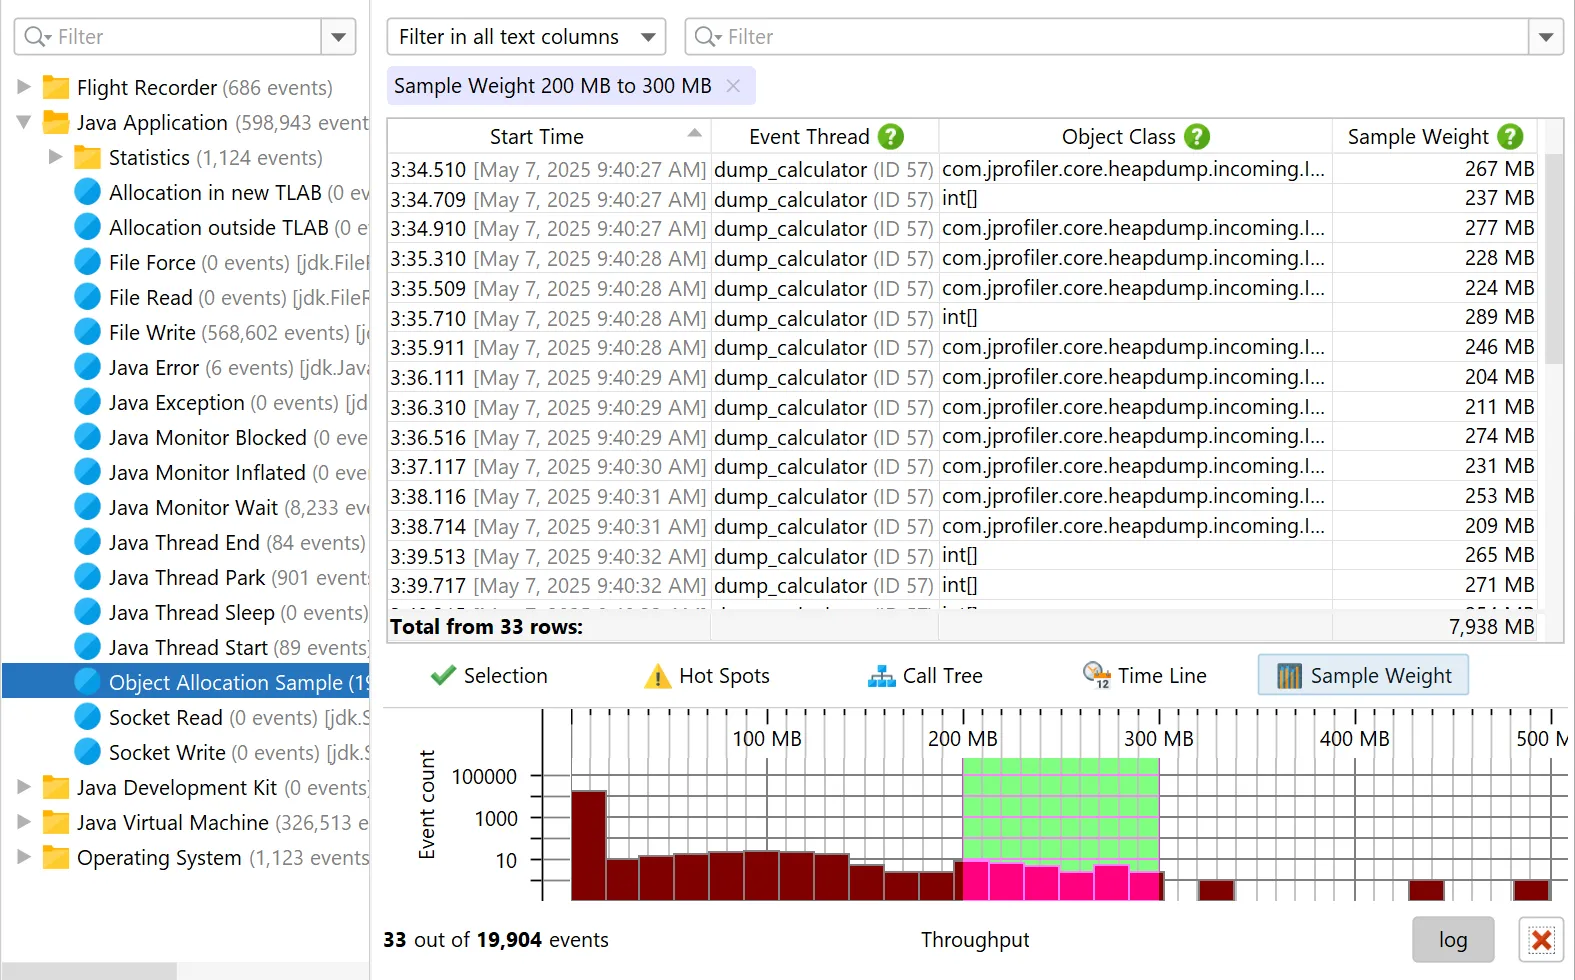
  • Recorded objects
    Shows classes or packages of all recorded objects. You can mark current values and show differences.
  • Allocation call tree
    Shows a call tree or methods, classes, packages or JEE/Spring components with annotated allocations of selected classes.
  • Allocation hot spots
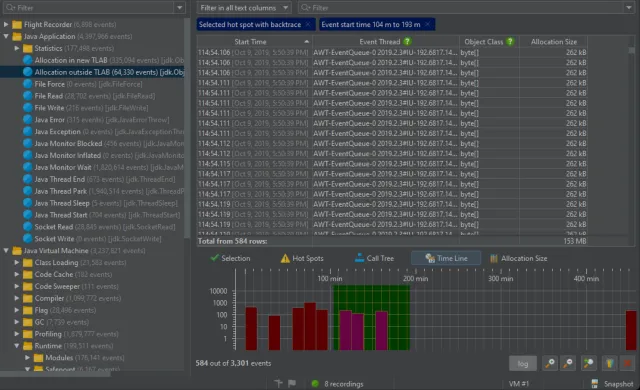
    Shows a list of methods, classes, packages or JEE/Spring components that allocate selected classes. You can mark current values and show differences. The tree of backtraces can be shown for each hot spot.
  • Class tracker
    Shows a time line with a graph of instance counts for selected classes.
Heap Walker

In JProfiler's heap walker you can take a snapshot of the heap and drill down to objects of interest by performing selection steps. The heap walker has five views:

  • Classes
    Shows all classes and their instances.
  • Allocations
    Shows allocation tree and allocation hot spots for recorded objects.
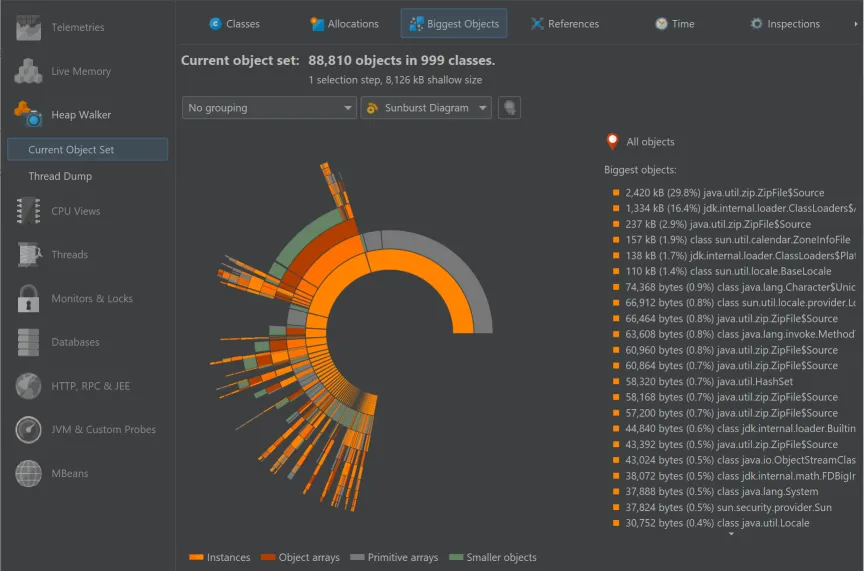
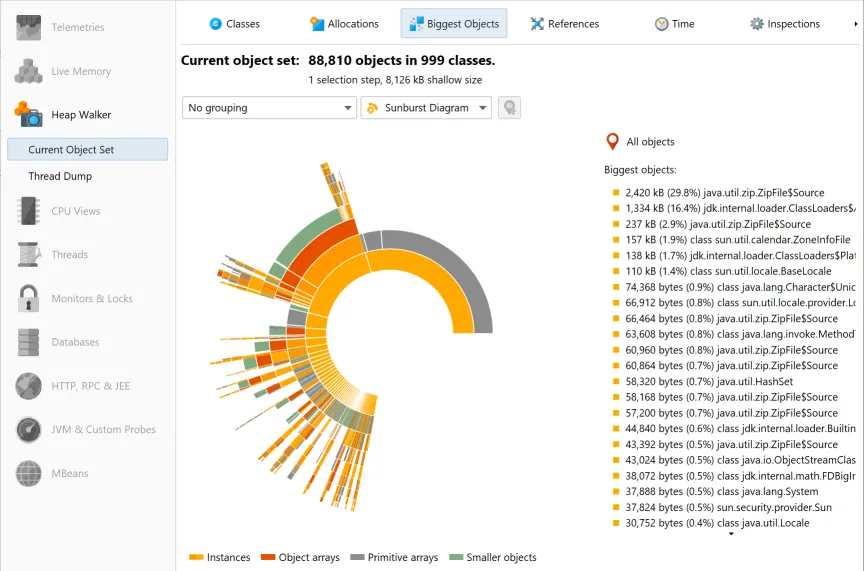
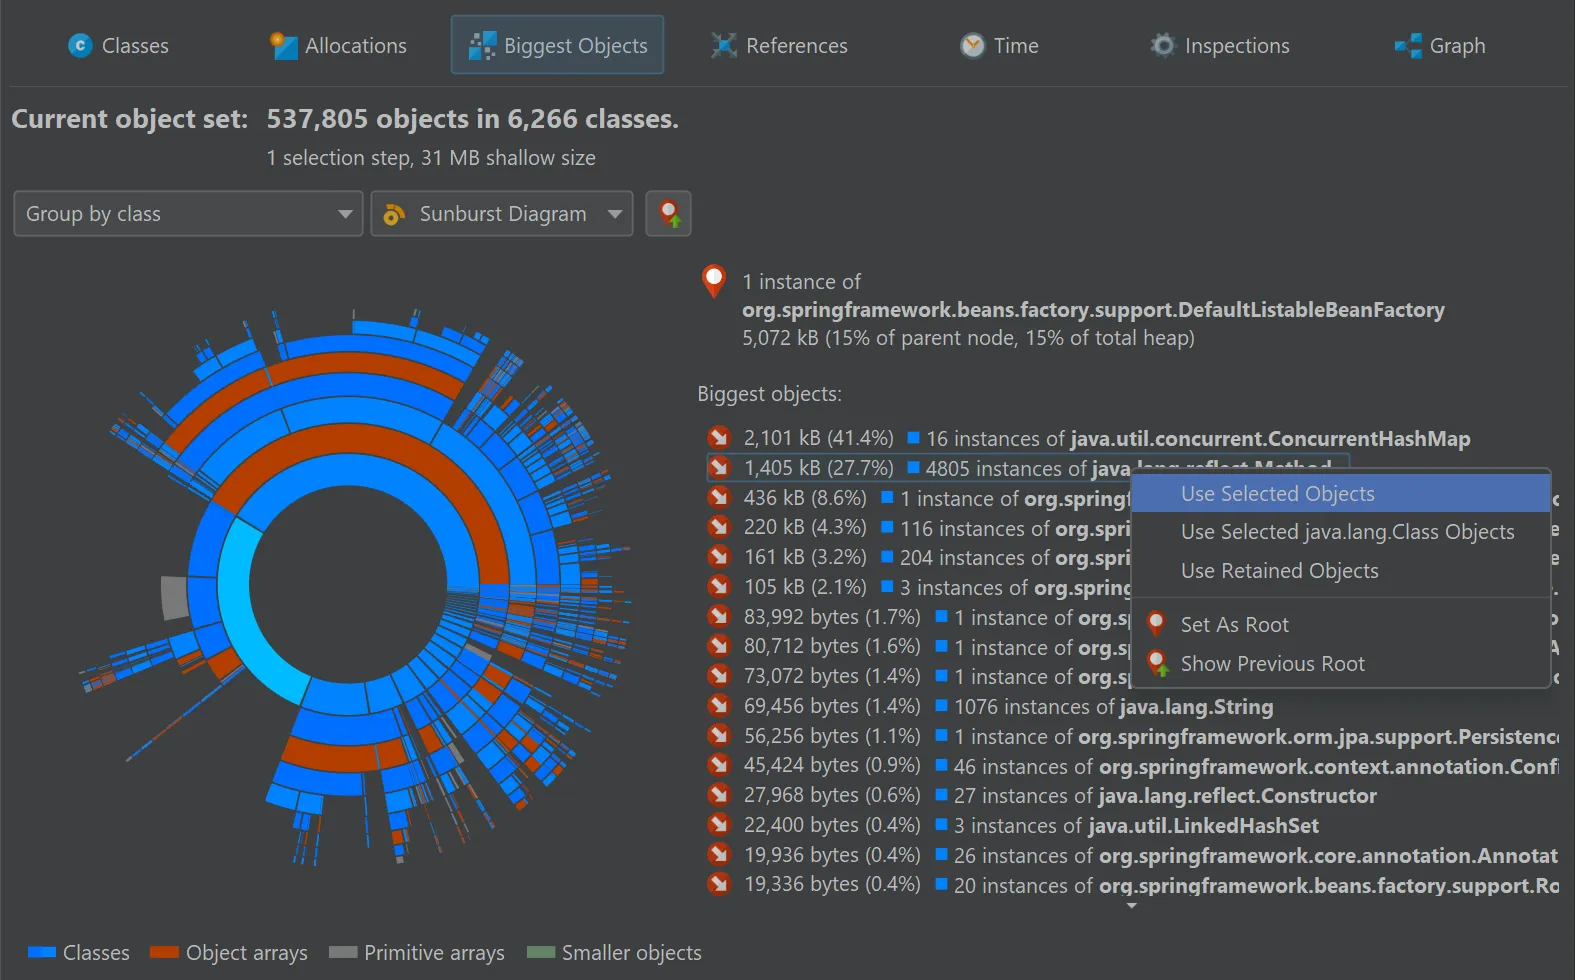
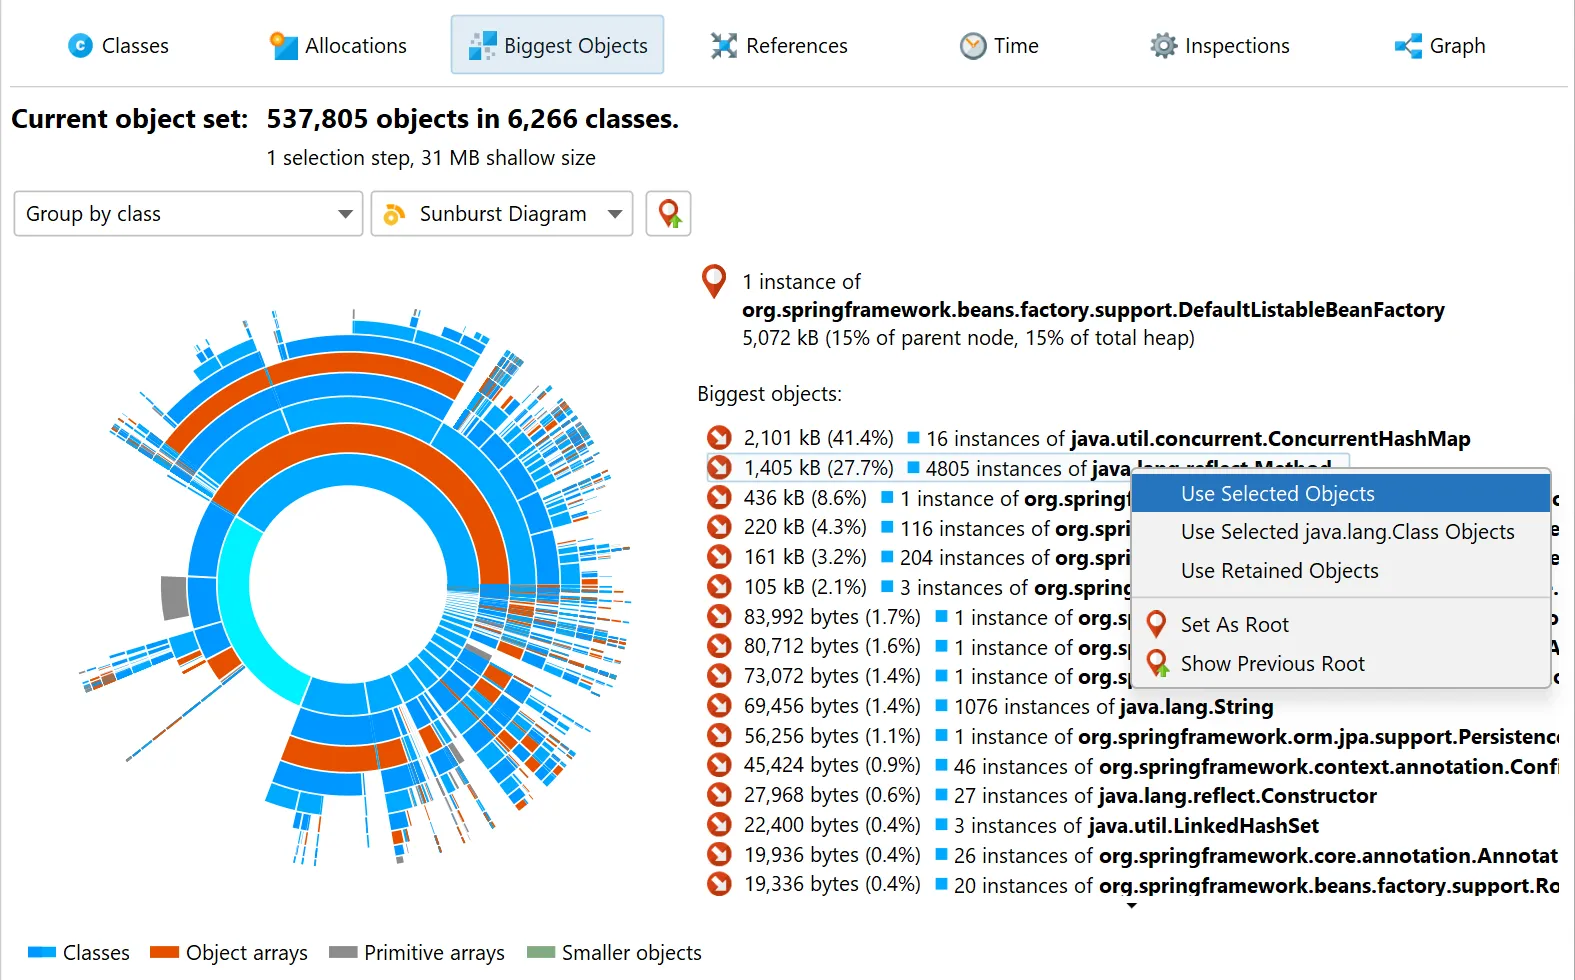
  • Biggest objects
    Shows the objects that block the largest parts of the heap from being garbage collected. The dominator tree can be expanded in place to show these retained objects.
  • References
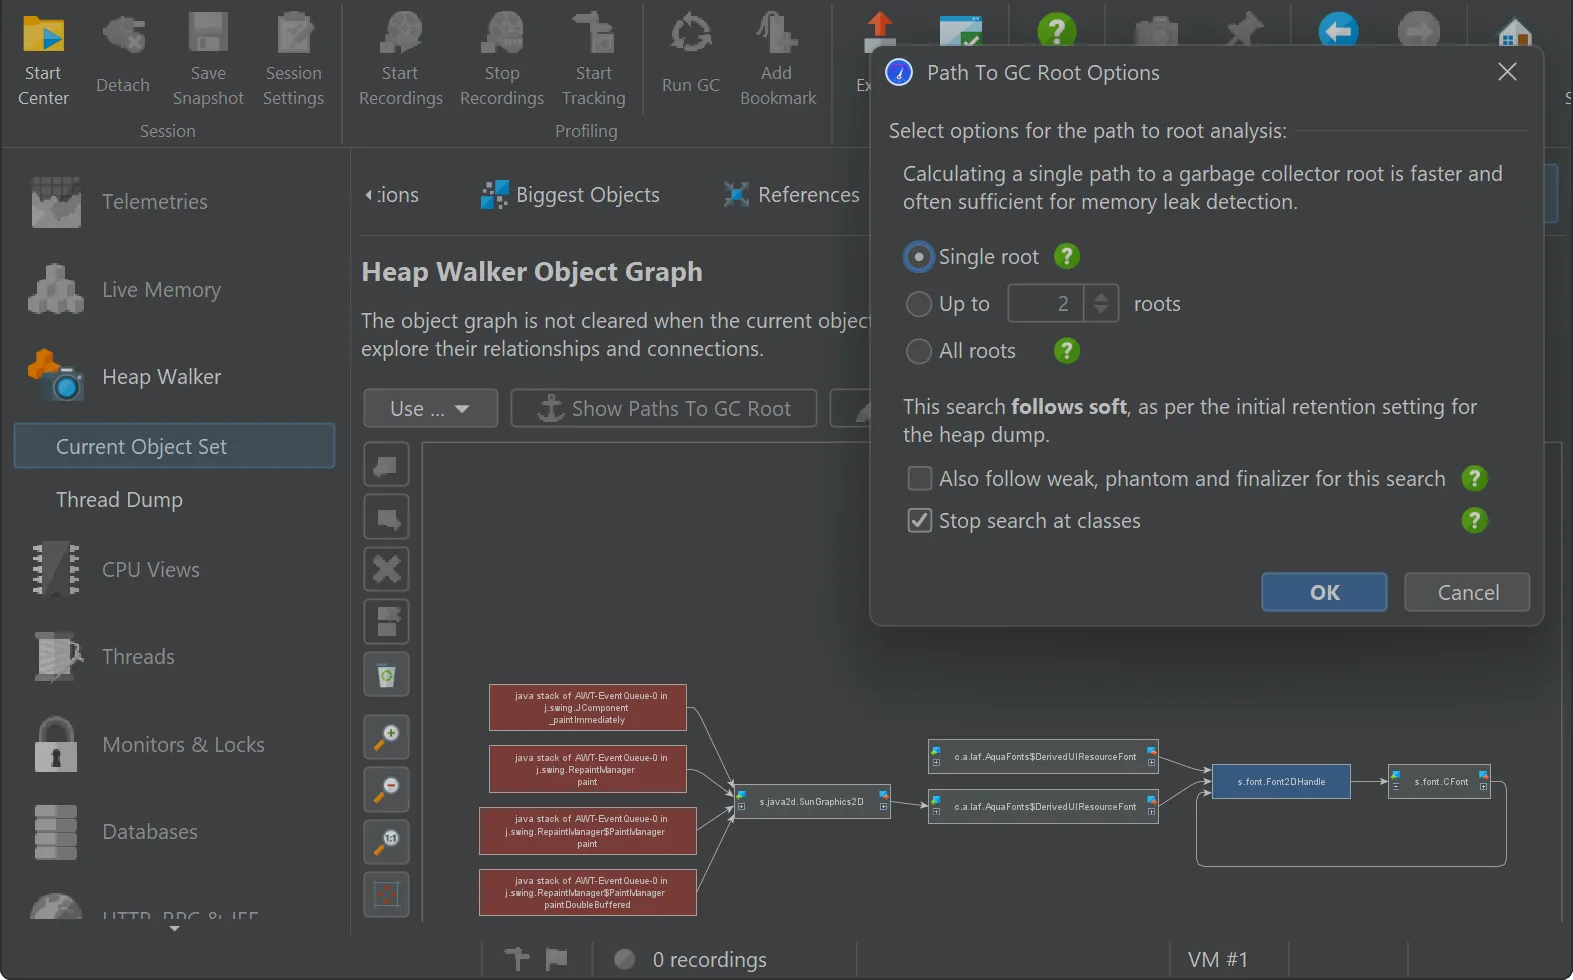
    Shows outgoing references for individual objects with primitive data and incoming references with "show path to garbage collector root" functionality. Also offers cumulated views for incoming and outgoing references. In the outgoing references view, you can apply filters. There are two different filter types: Filtering by primitive values and filtering with a script.
  • Data
    Shows instance and class data for individual objects.
  • Time
    Shows a time-resolved histogram of recorded objects.
  • Inspections
    In the inspections view, you can run a number of inspections on the current object set that analyze your objects in various ways.
  • Graph
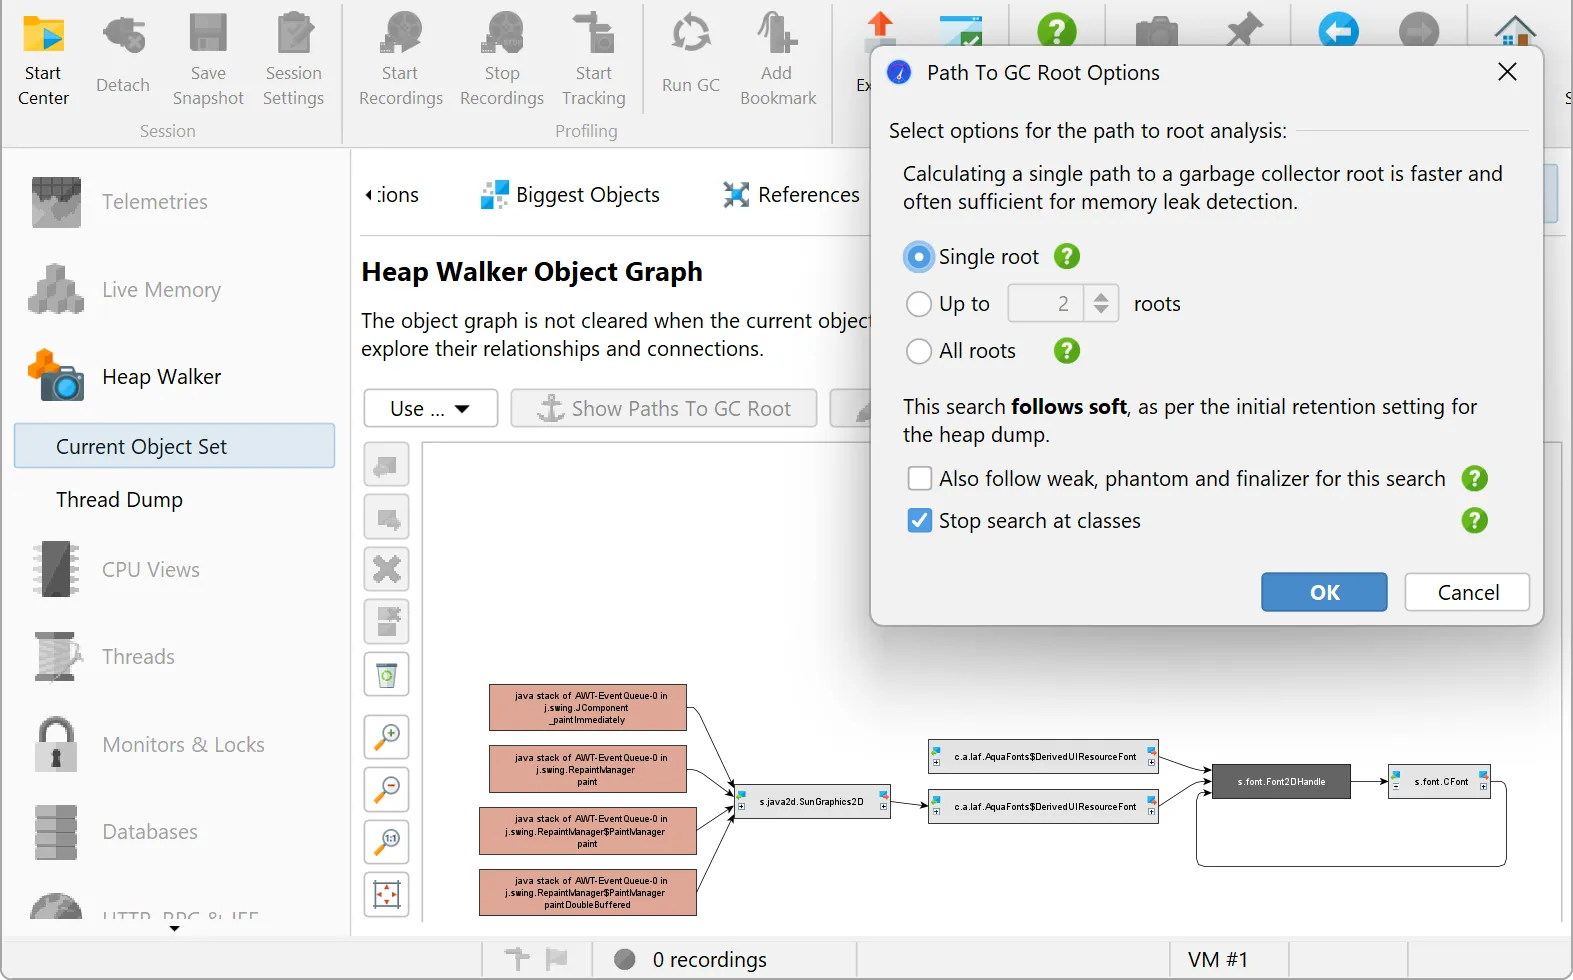
    In the graph you can add objects from different object sets and explore their relationships by opening incoming and outgoing references, finding paths between selected objects and showing paths to garbage collector roots.
CPU profiling

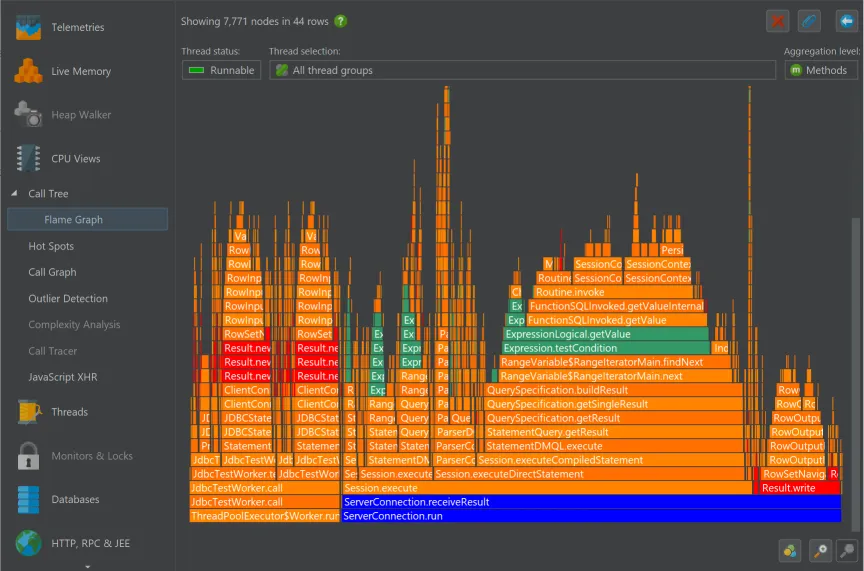
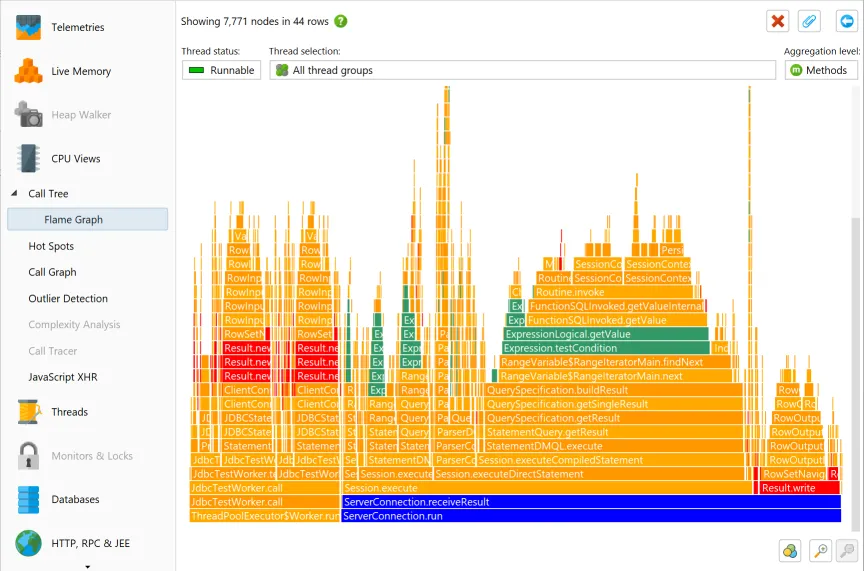
JProfiler offers various ways to record the call tree to optimize for performance or detail. The thread or thread group as well as the thread status can be chosen for all views. All views can be aggregated on a method, class, package or JEE/Spring component level. The CPU view section contains:

  • Call tree
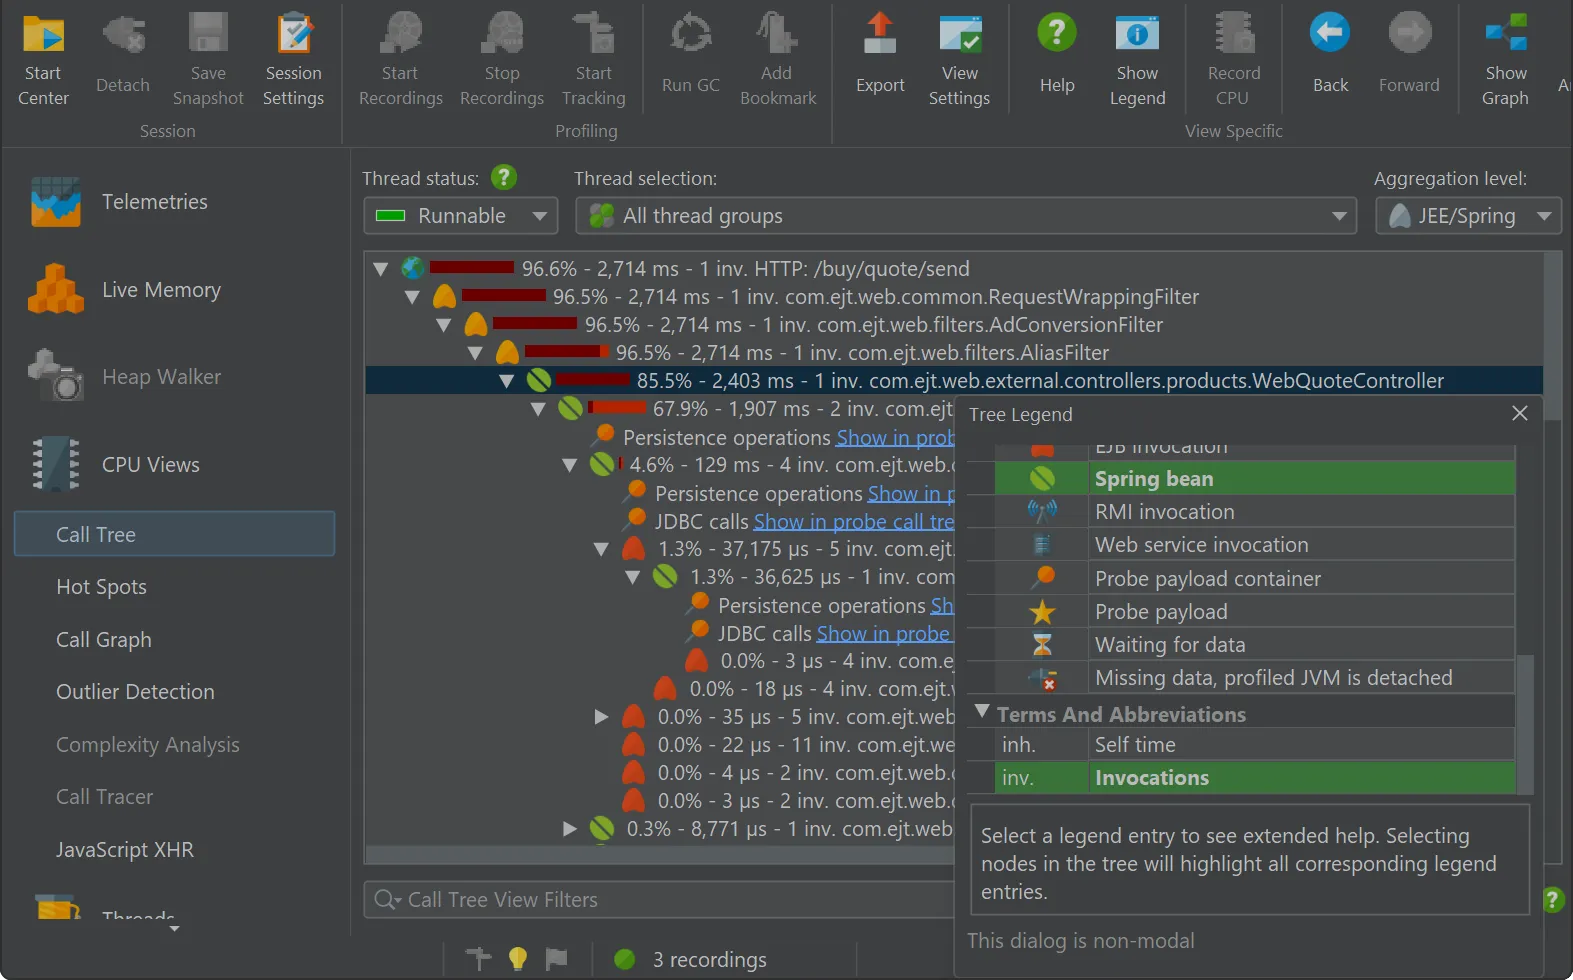
    Shows a cumulated top-down tree of all recorded call sequences in the JVM. JDBC, JMS and JNDI service calls are annotated into the call tree. The call tree can be split for different request URL to a servlet or JSP. You can mark methods for "exceptional method run recording" and see the slowest invocations separately. With request tracking, you can connect call sites to execution sites in multi-threaded applications.
  • Hot spots
    Shows the list of the most time consuming methods. The tree of backtraces can be shown for each hot spot.
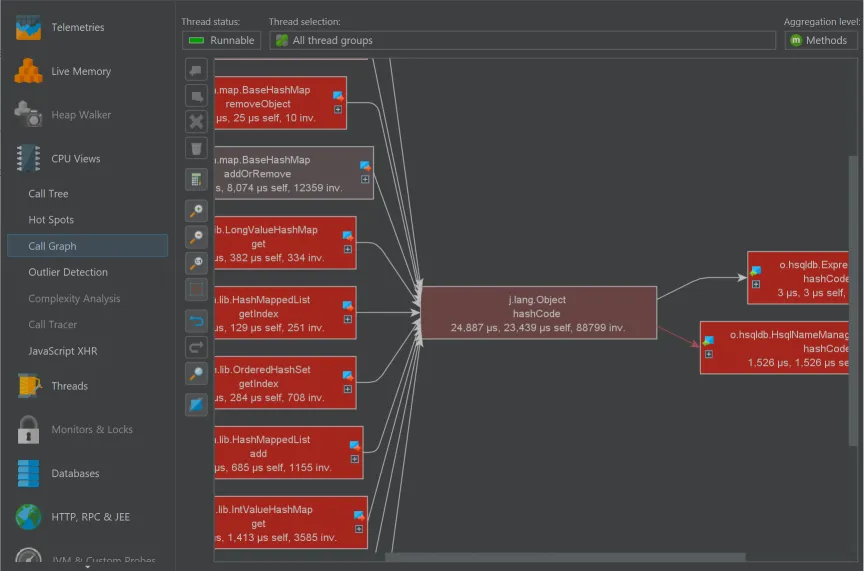
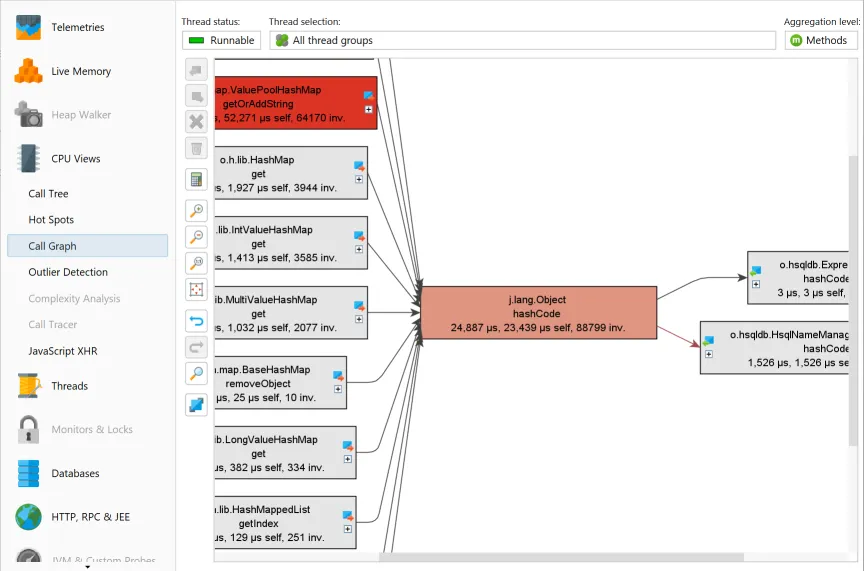
  • Call graph
    Shows a graph of call sequences starting from selected methods, classes, packages or JEE/Spring components.
  • Method statistics
    Shows statistical information about the distribution of call times for all methods together with a call time distribution graph, that can be used to spot outliers.
  • Call tracer
    Shows recorded chronological traces for method calls grouped by thread, package and class.
Thread profiling

For thread profiling, JProfiler offers the following views:

  • Thread history
    Shows a time line with thread activity and thread status.
  • Thread monitor
    Shows a list of all live threads with their current activity.
  • Thread dumps
    You can take multiple thread dumps and analyze them in the thread dumps view.
Monitor profiling

For monitor profiling, JProfiler offers the following views:

  • Current locking graph
    Shows a graph of all waiting and blocking situations in the JVM.
  • Current monitors
    Shows the currently used monitors and their associated threads.
  • Locking history graph
    Shows the history of recorded waiting and blocking situations as graphs.
  • Monitor history
    Shows the history of recorded waiting and blocking events.
  • Monitor usage statistics
    Shows statistics for monitors grouped by monitors, threads and classes of monitors.
VM telemetry

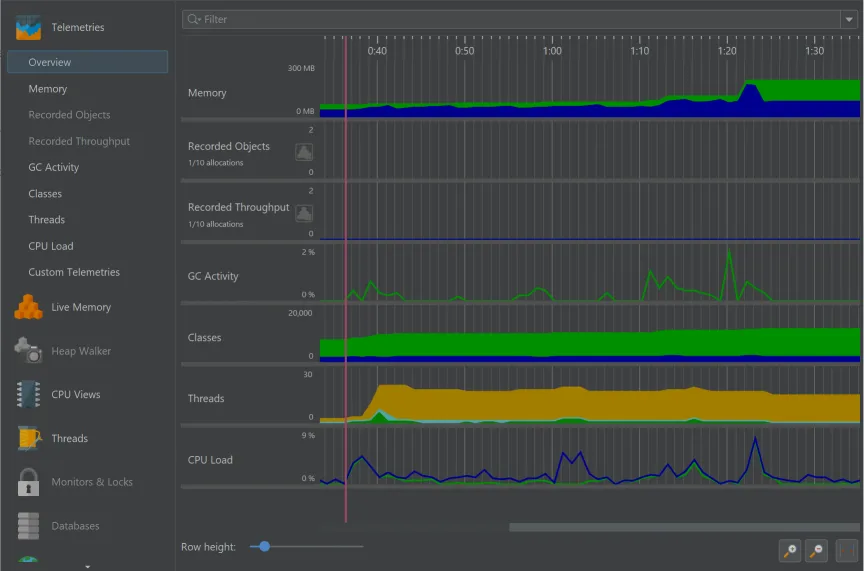
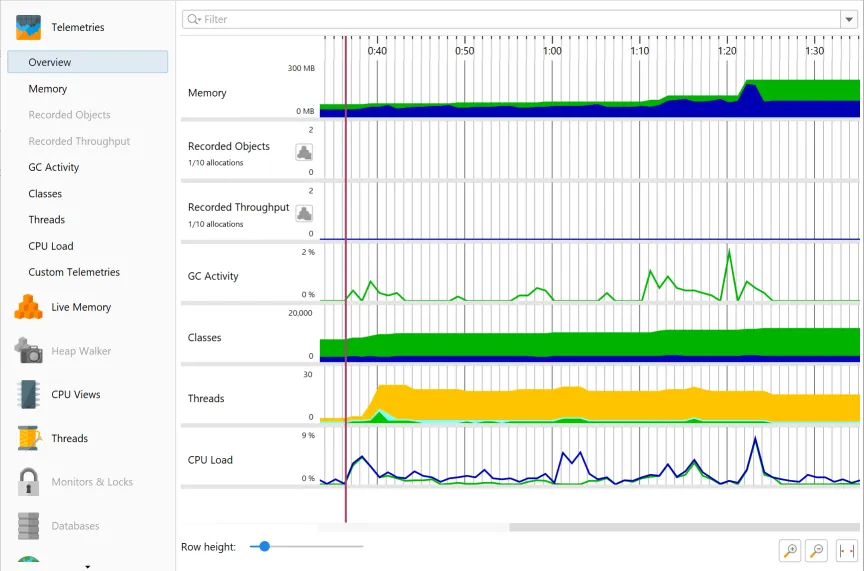
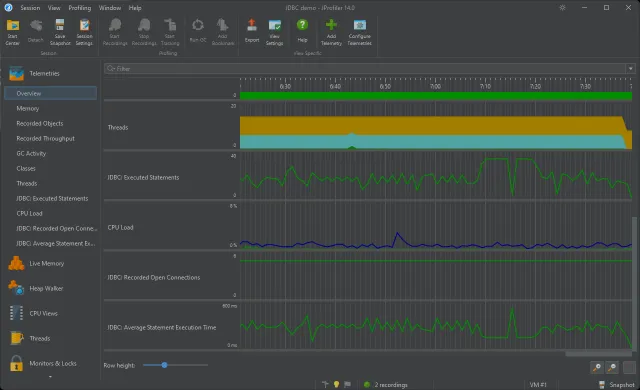
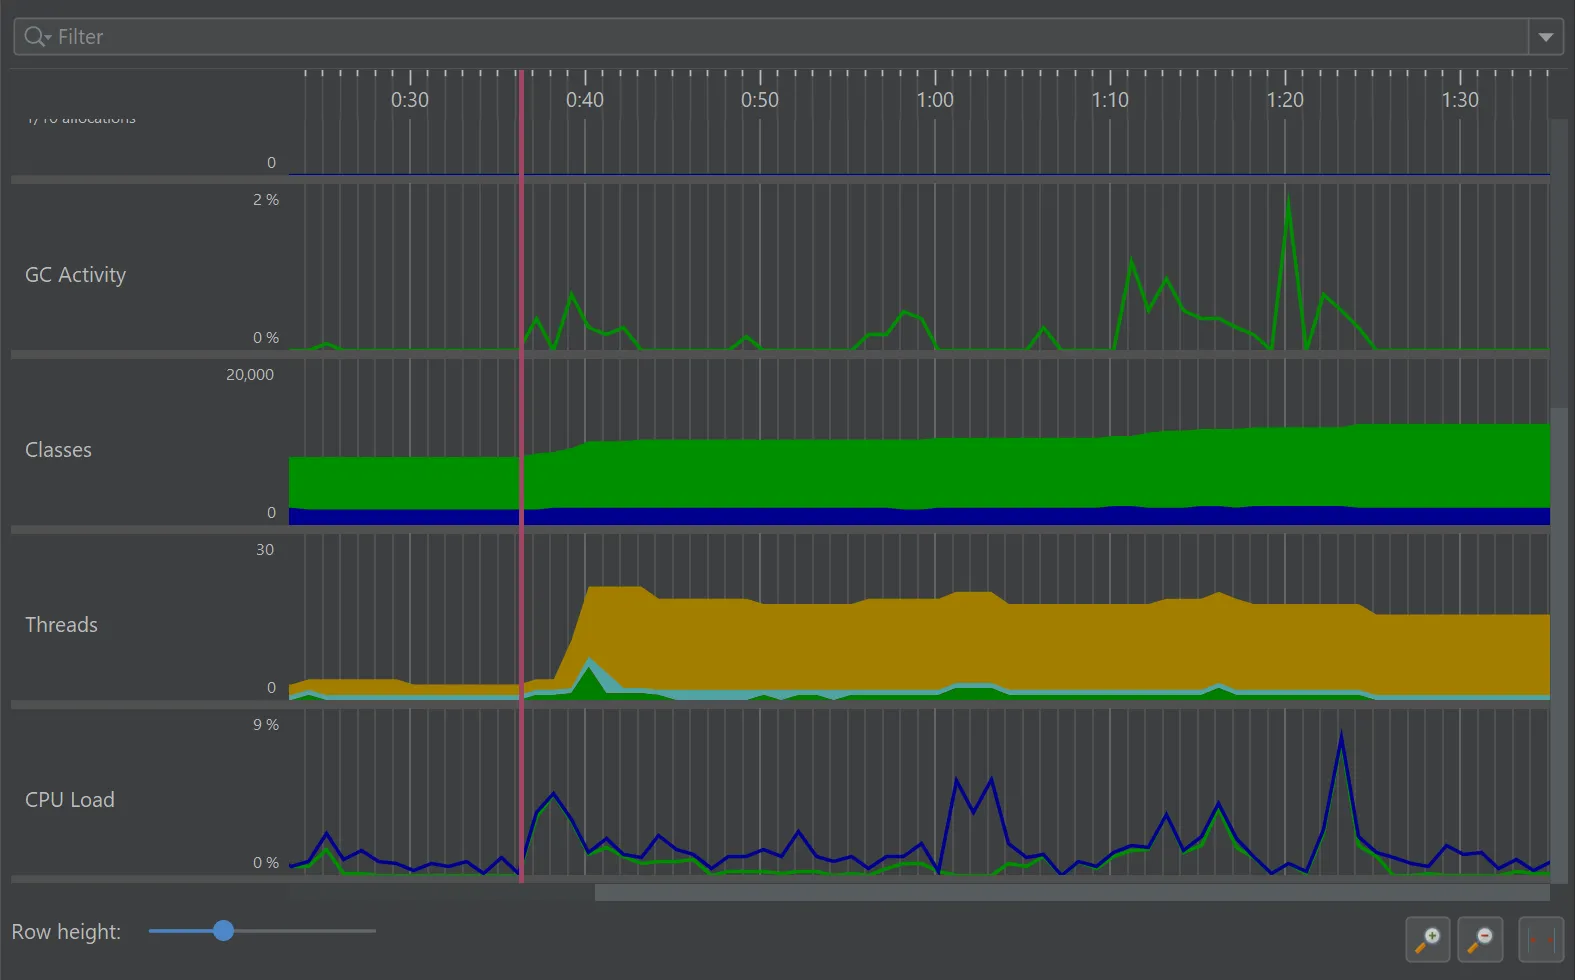
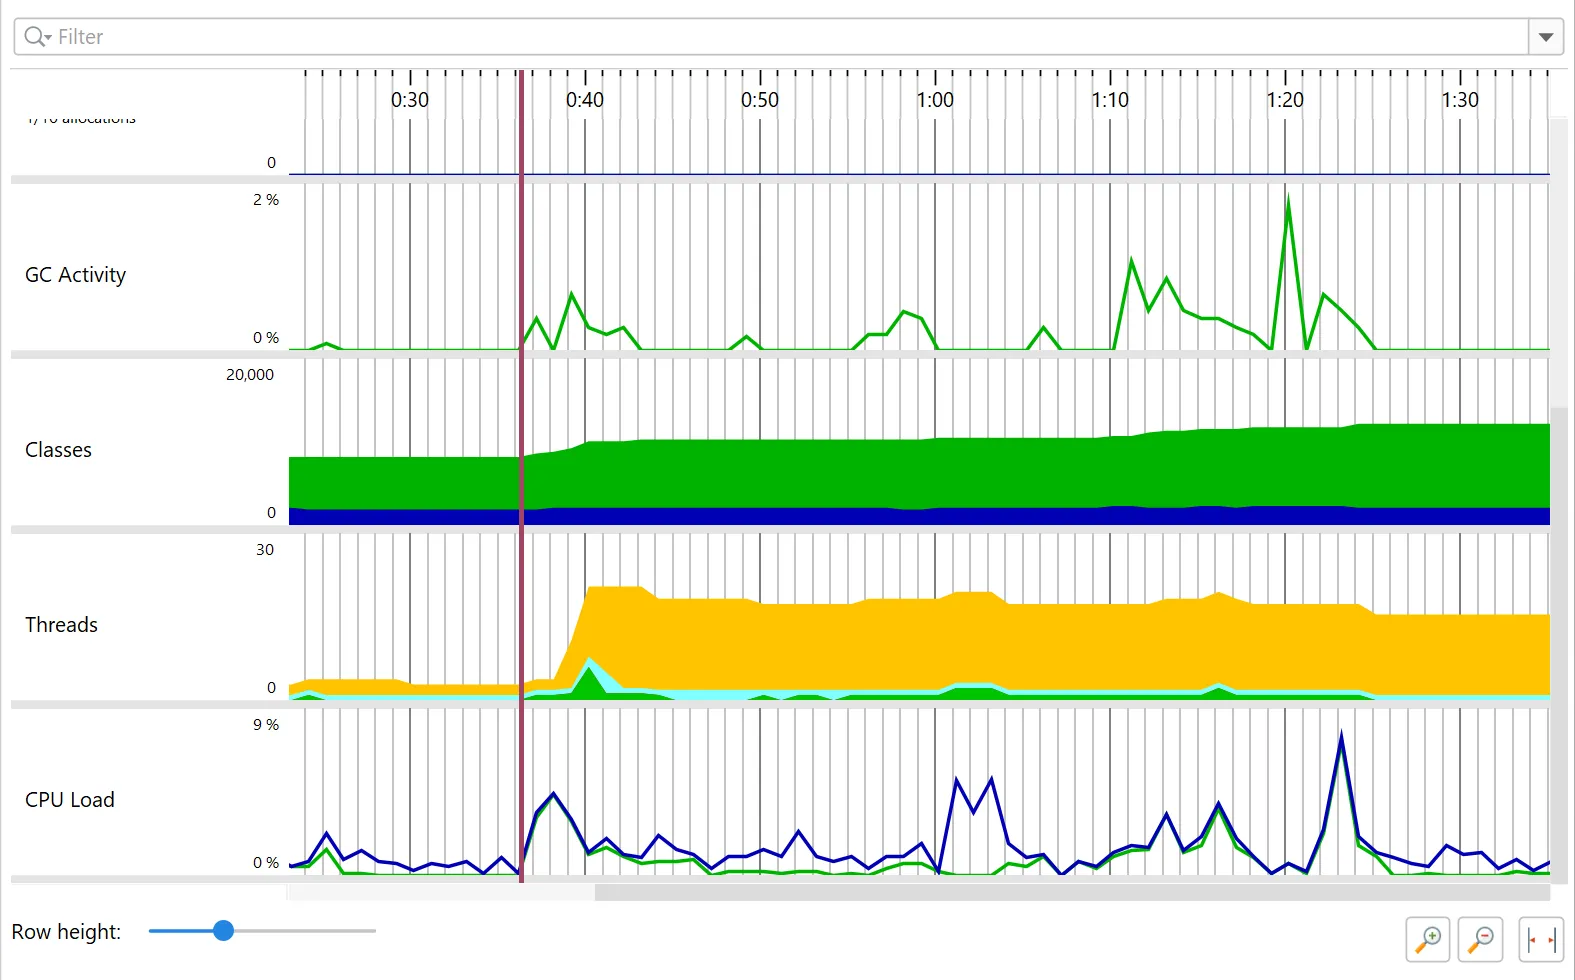
To observe the internal state of your JVM, JProfiler offers various telemetry views:

  • Heap
    Shows a time line with a graph of the used heap and the heap size.
  • Recorded objects
    Shows a time line with a graph of live objects and arrays that have been recorded.
  • Recorded throughput
    Shows a time line with a graph of the rates of object creation and garbage collection for recorded objects.
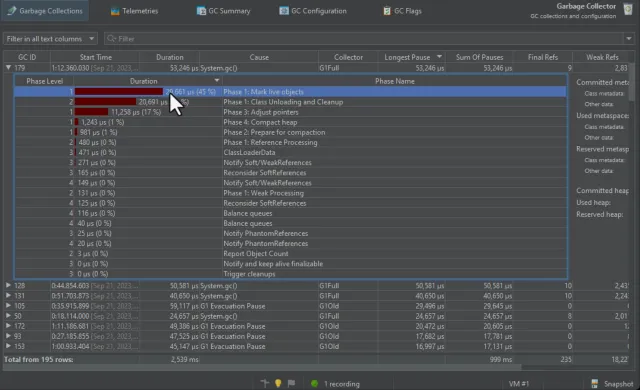
  • GC activity
    Shows a time line with a graph of garbage collector activity.
  • Classes
    Shows a time line with a graph of loaded classes.
  • Threads
    Shows a time line with a graph of active threads.
  • CPU load
    Shows a time line with a graph of the CPU load generated by the profiled application.
Databases

JProfiler supports specific probes for the following databases:

  • JDBC
  • JPA/Hibernate
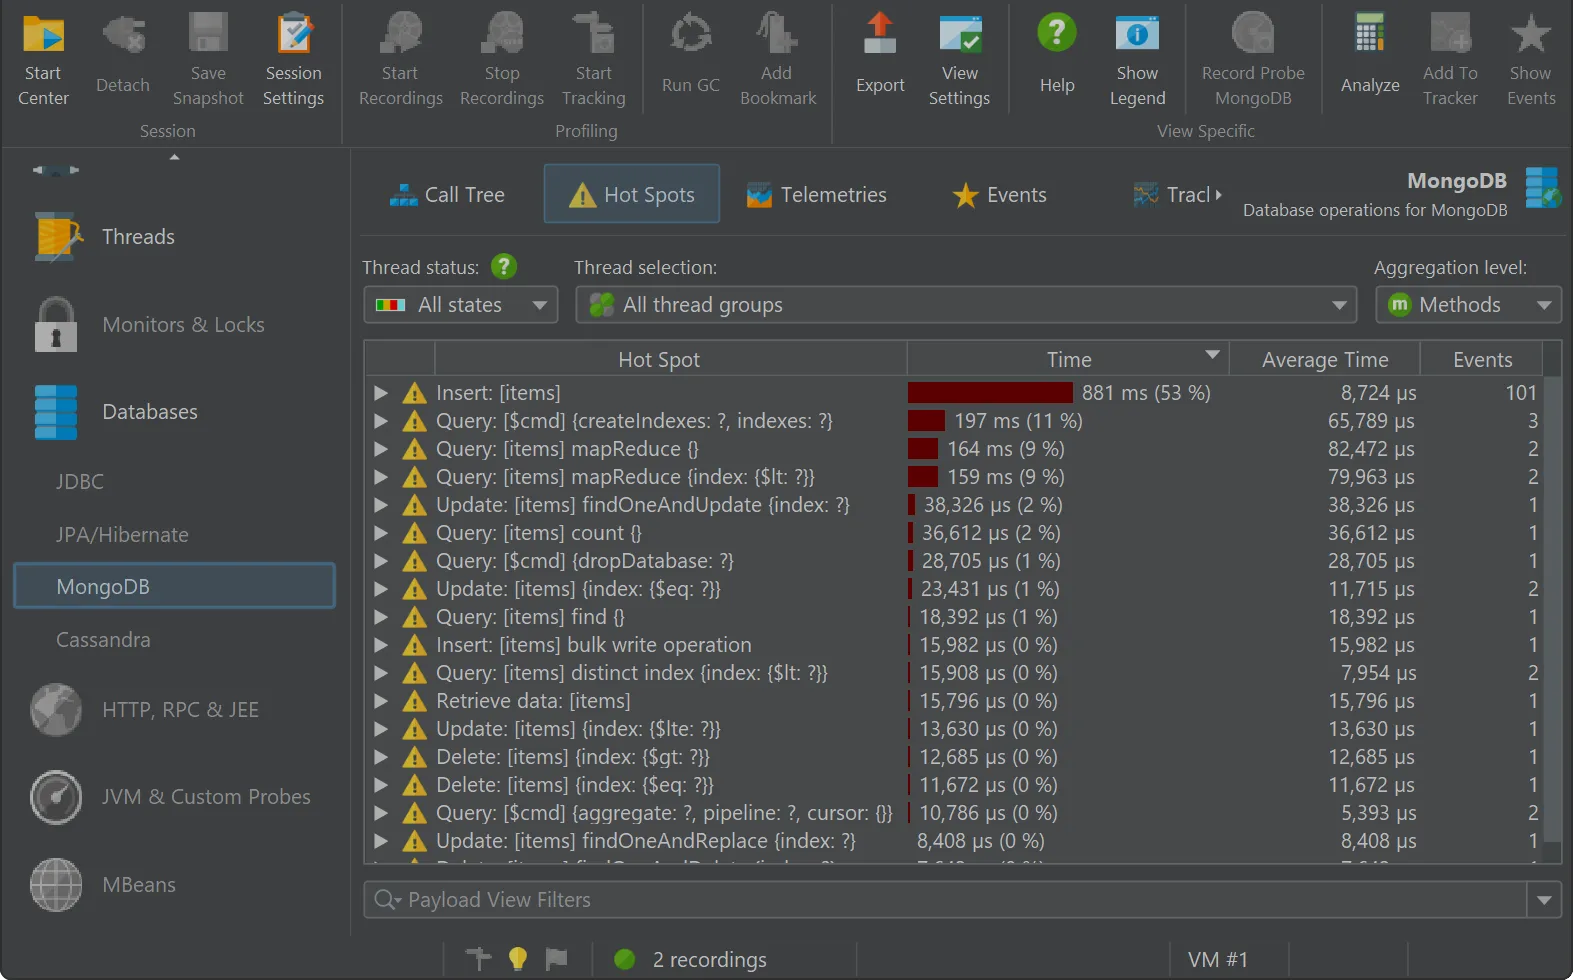
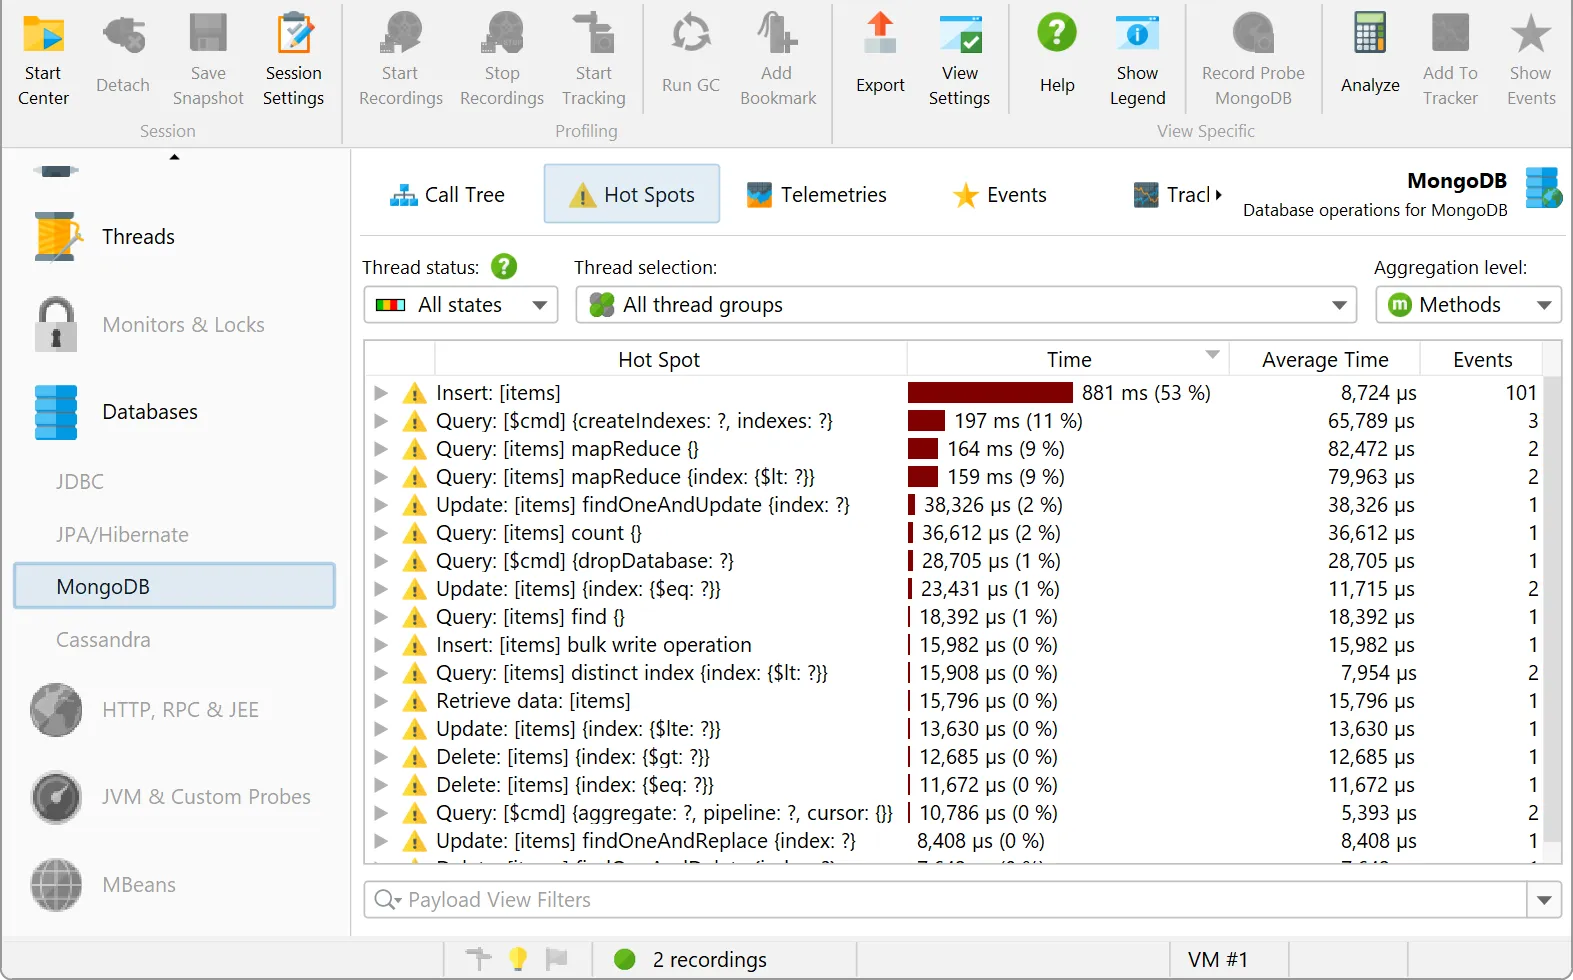
  • MongoDB
  • Cassandra
  • HBase
JEE & Probes

JProfiler offers probes for:

  • JDBC
  • JPA/Hibernate
  • Servlets
  • Netty
  • HTTP requests
  • Web services
  • JMS
  • JNDI
  • RMI
  • gRPC
  • Files
  • Sockets
  • Processes

Probes show the following information:

  • Time line
    In the time line view, the probe shows its control objects as colored bars along a time axis. Control objects are long-lived objects associated with single probe events. For example, in the JDBC probe, the control objects are the database connections. The colors on the time line bars correspond to the different states that the control object can be in.
  • Control objects
    Tabular details about control objects are shown in the control objects view. It shows more details about the control objects as well as statistics on the recorded events, such as total throughput for file I/O. With the filter controls and the total line at the bottom you can make quick summations for subsets of control objects. Some probes show additional detail in nested tables, where you can open a dialog to show interesting multi-line values in more details. For example, the command line parameters of a process can be very long.
  • Hot spots
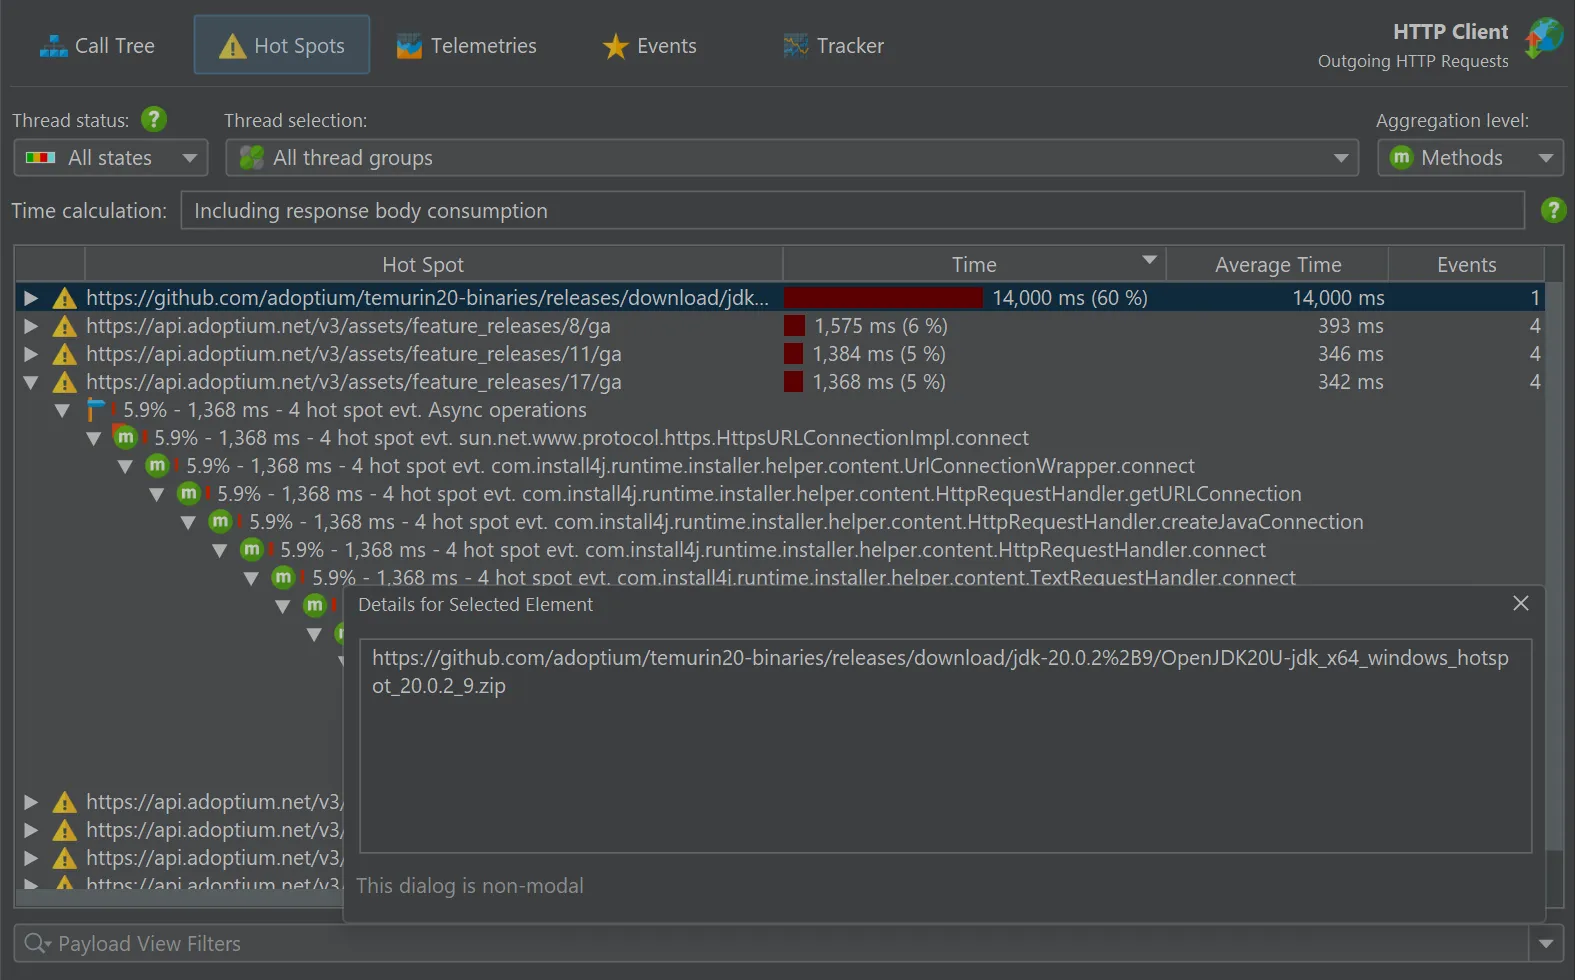
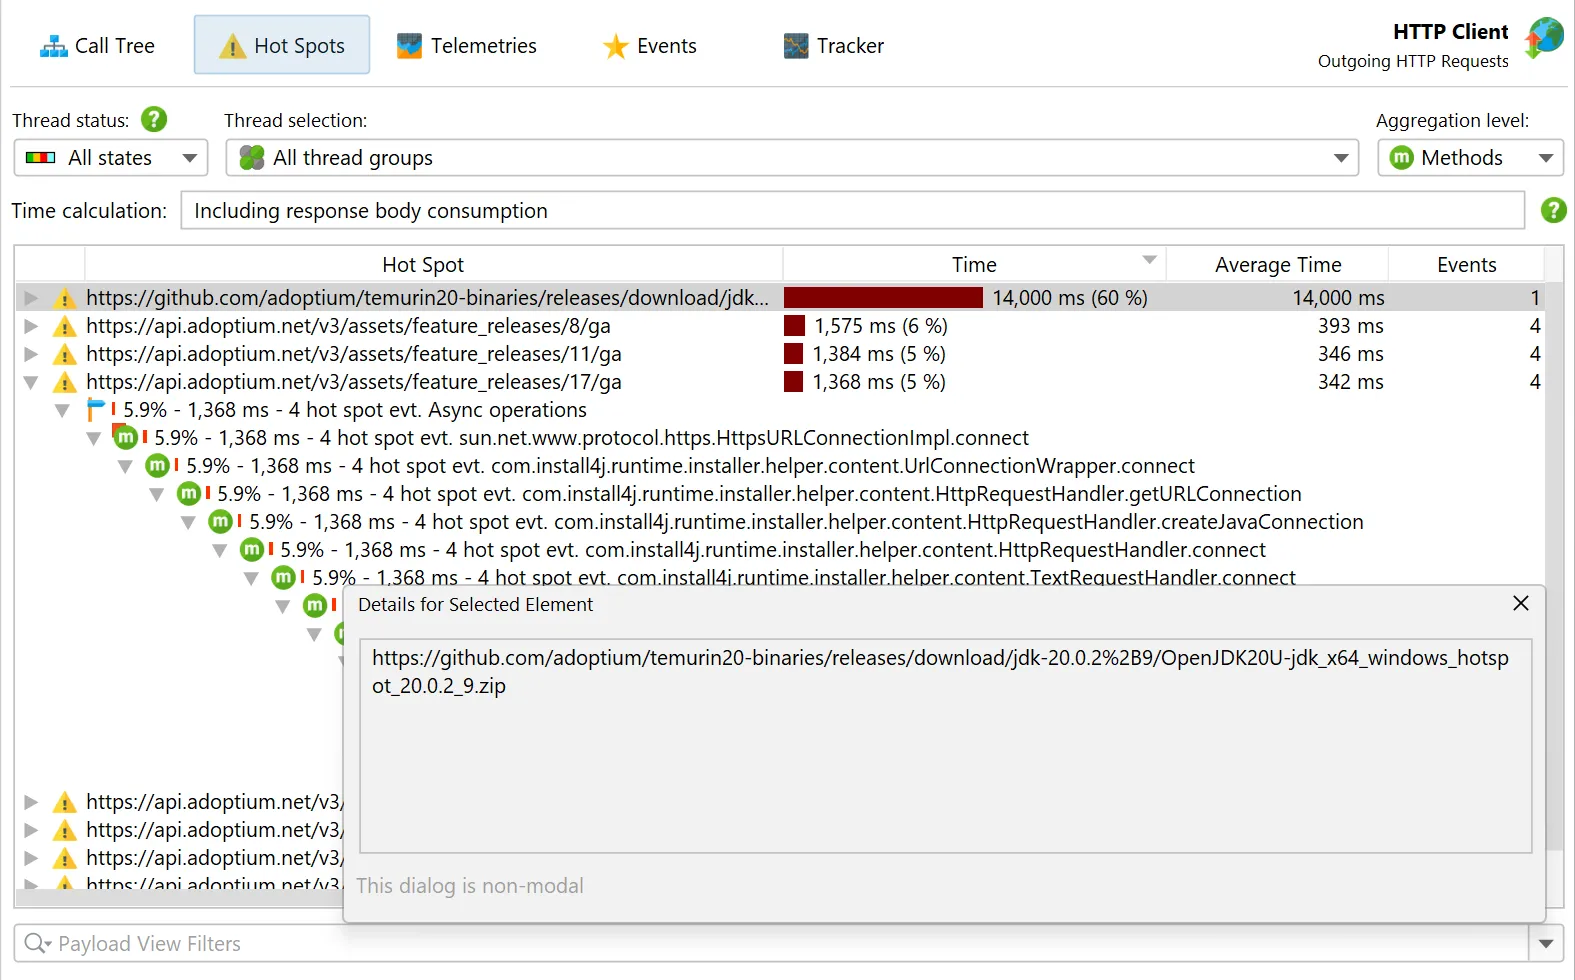
    In the hot spots view, the probe shows hot spots of payload names published by probe events that are sorted by execution time. For example, the file probe shows file names, the JDBC probe shows SQL strings and the JNDI probe shows queries. Each hot spot can be expanded to show the back traces that contribute to the hot spot.
  • Telemetries
    In the telemetries view>, you can see the various telemetries that are published by the probe.
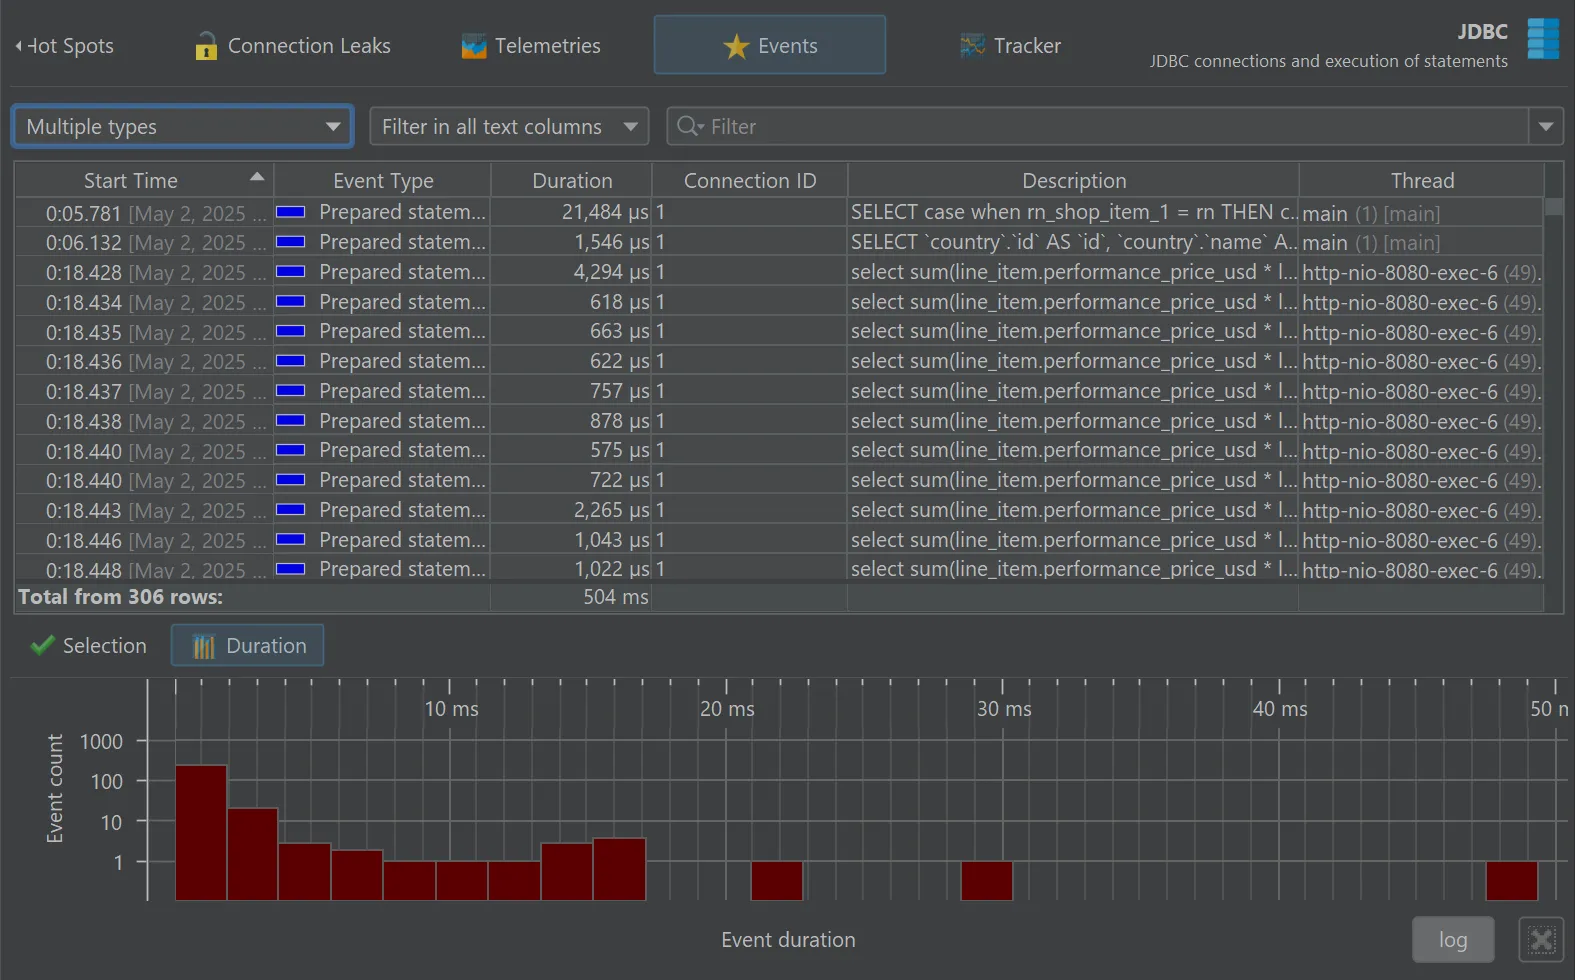
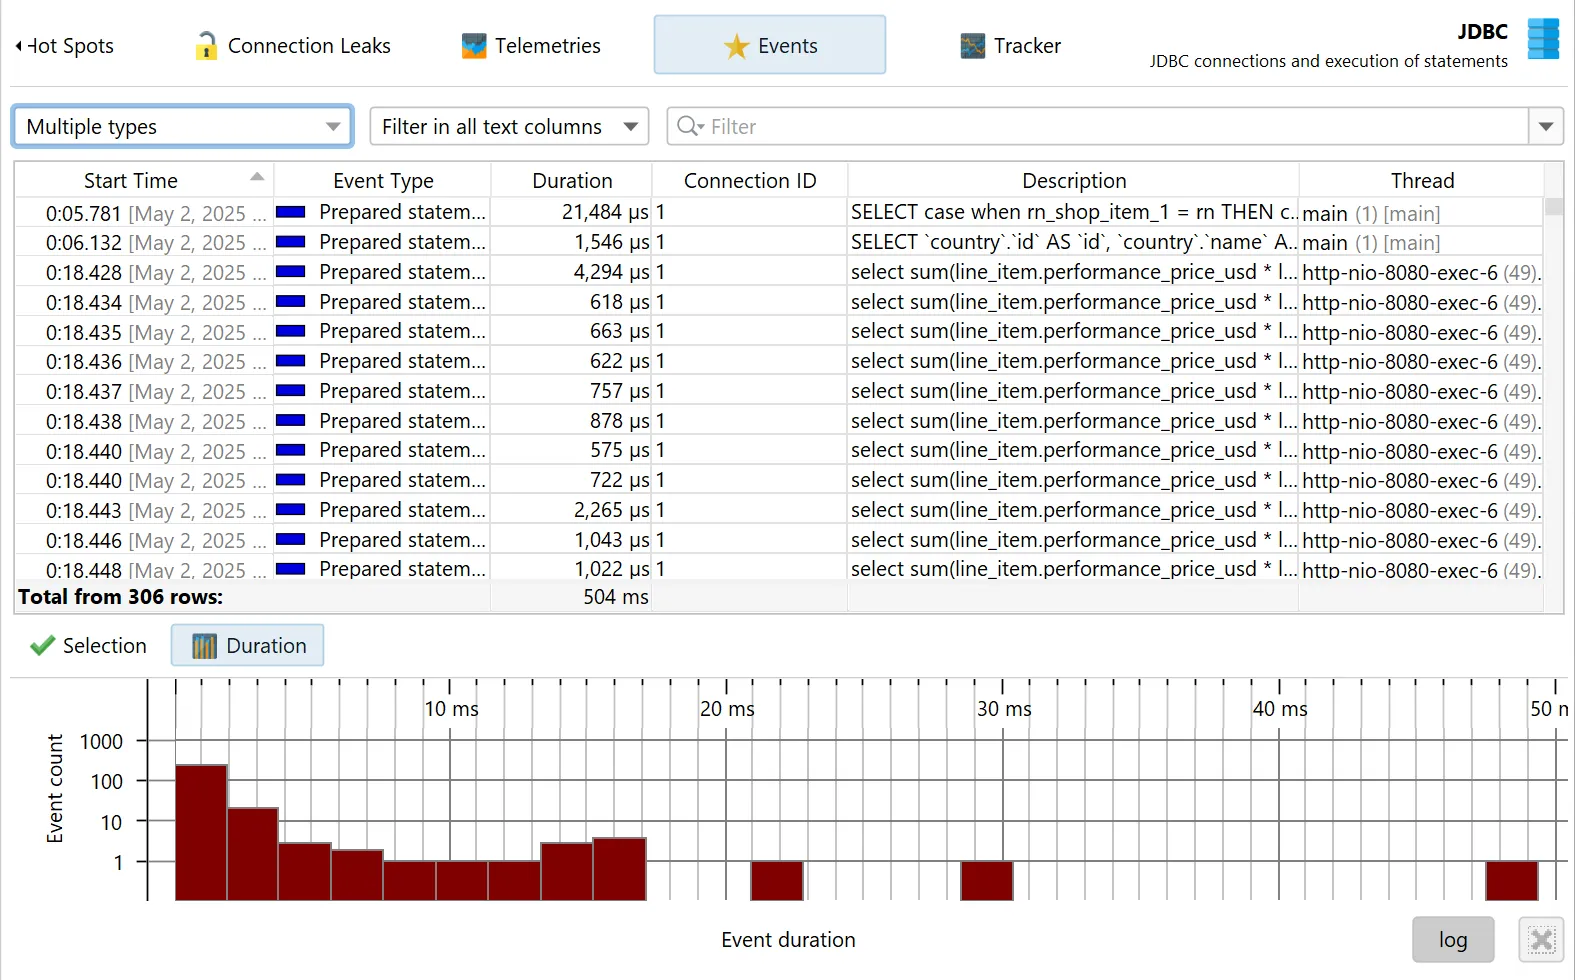
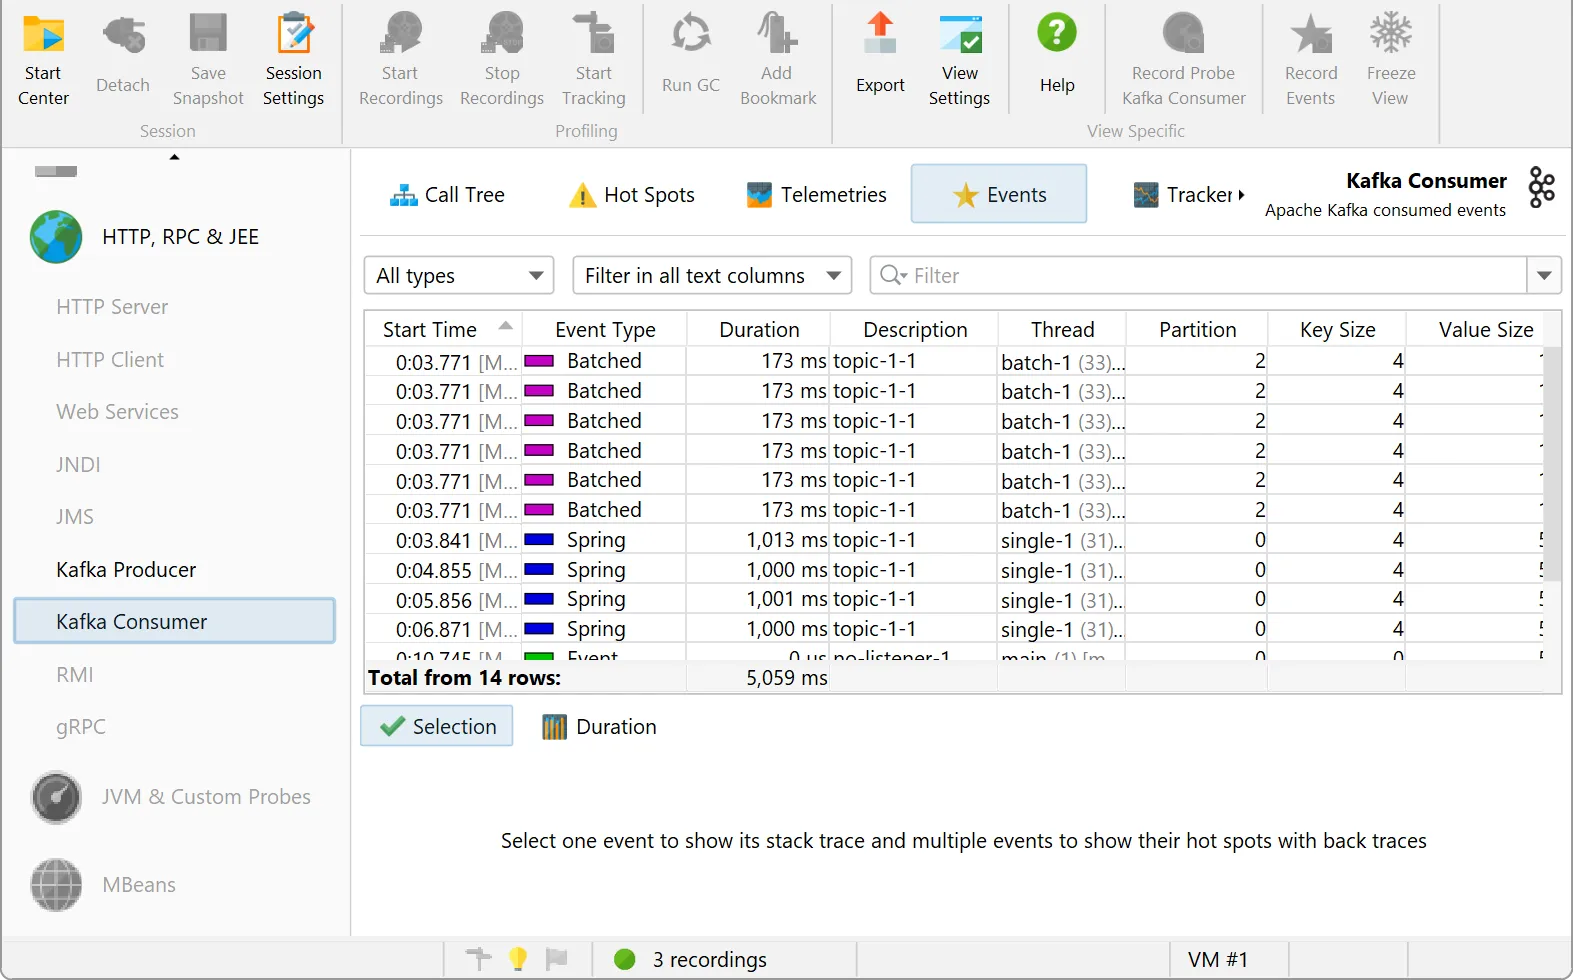
  • Events
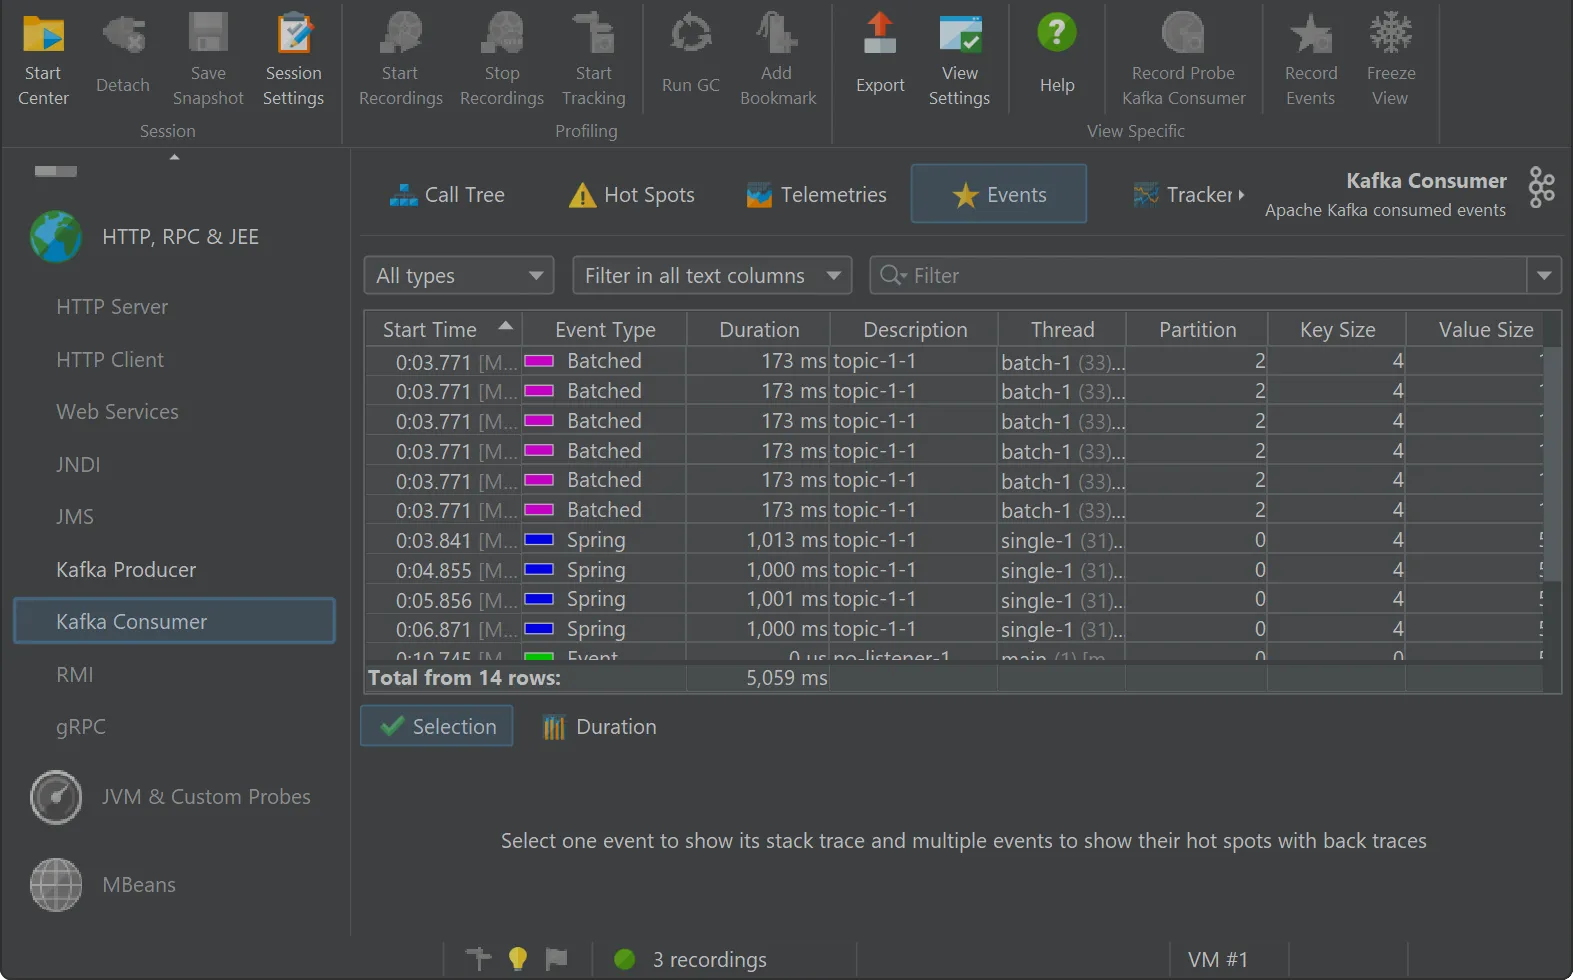
    The events view shows the single events recorded by the probe. Events have thread and stack trace information, and you can easily jump to the associated control object. Again, the filters and the total line allow you to sum selected events.