What's new in perfino

Please see the change log for a detailed list of all changes.

    perfino 4.02020-05-29change log

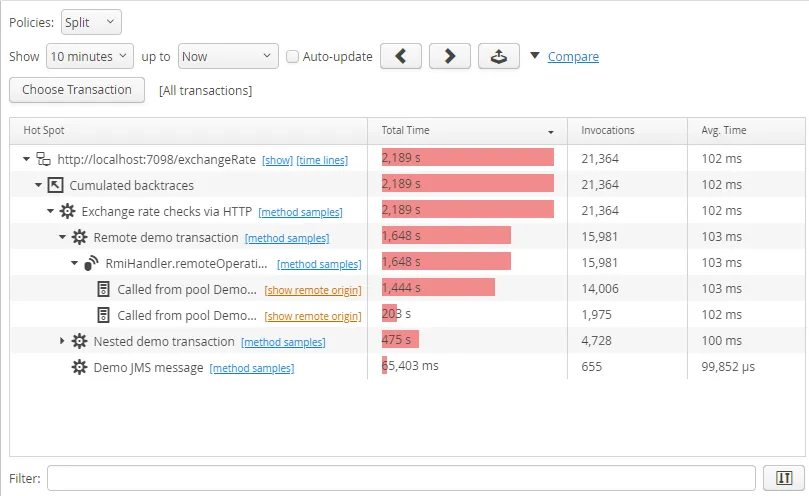
    An HTTP probe has been added that measures all outgoing HTTP calls and shows them as a probe hot spots view Both synchronous and asynchronous calls are measured. The supported HTTP clients are:

    • java.net.URLConnection
    • Java HTTP Client (Java 11+)
    • Apache HttpClient 4.x and 5.x
    • OkHttp 3.9+ and 4.x
    • Jersey (JAX-RS) Async Client 2.x
    • RestEasy Async Client 3.x and 4.x
    • CXF Async Client 3.1.1+
    Screenshot

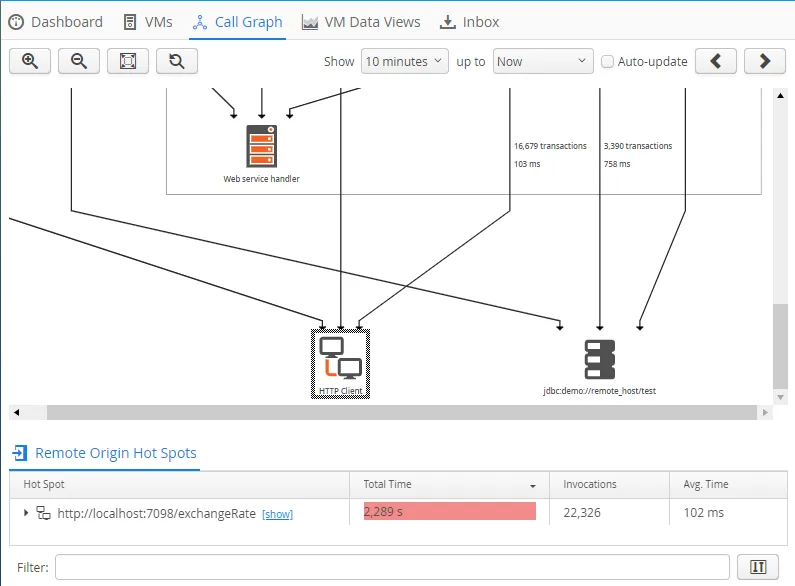
    In the call graph, outgoing HTTP calls are shown with their own node, just like other probes.

    Screenshot

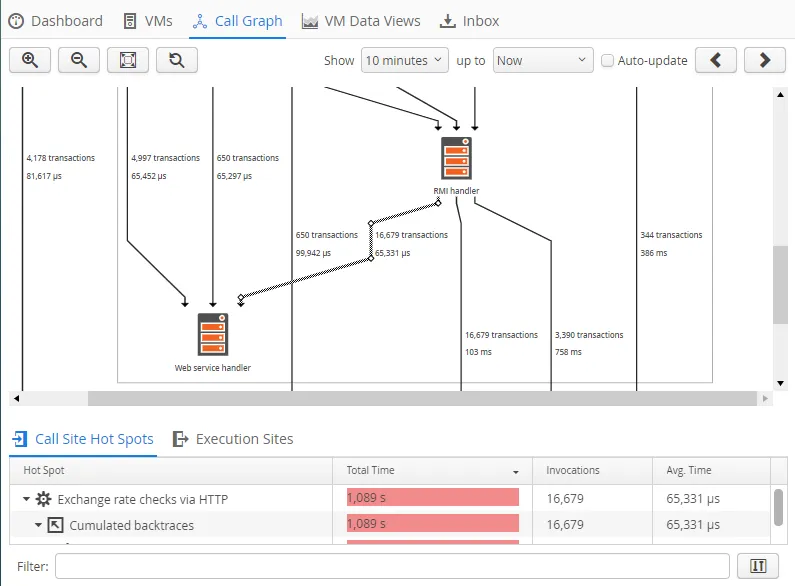
    All HTTP calls are tracked between VMs that are monitored by perfino, so the call tree view and the call graph will show links between those VMs. In the call graph, you can inspect the involved transactions on both sides by selecting the appropriate edge.

    Screenshot

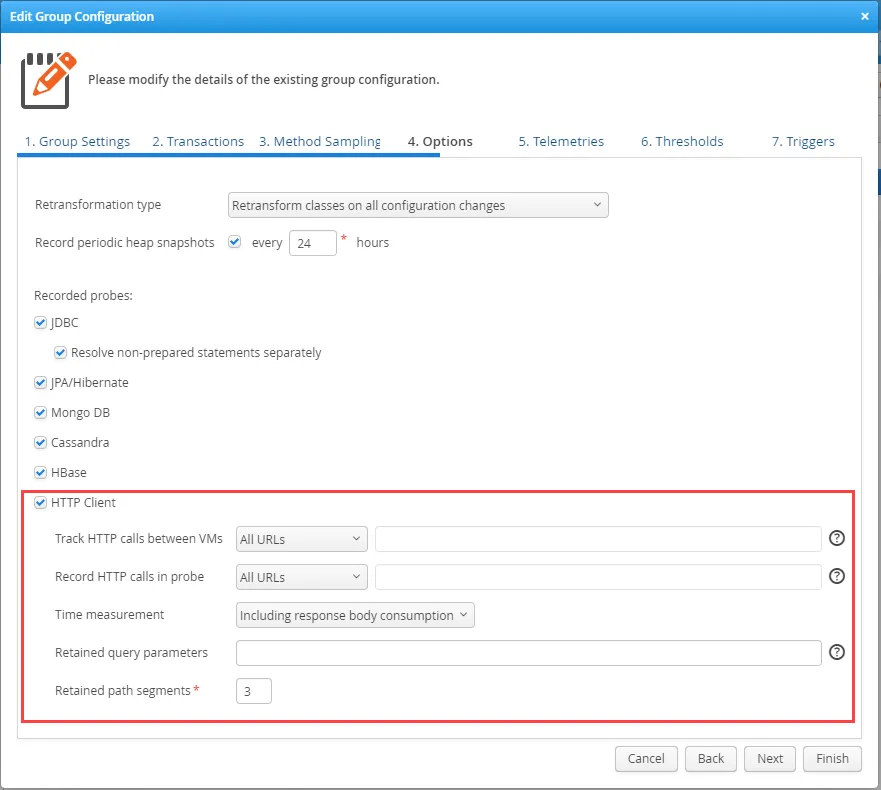
    The probe configuration allows you to select which URLs are tracked and which are recorded for the probe. For example, you may want to prevent perfino to add the tracking HTTP header to calls that go to external services and you may not want to record tracked HTTP calls for the probe.

    By default, only a limited number of URL path segments are retained by the probe and query parameters are discarded. This strategy reduces the load on the database and provides better hot spots. To tune the recording, you can decide to retain more path segments or to retain selected query parameters.

    Finally, the time measurement of HTTP calls may include the entire time while the response body is being consumed or stop after the initial response is received.

    Screenshot

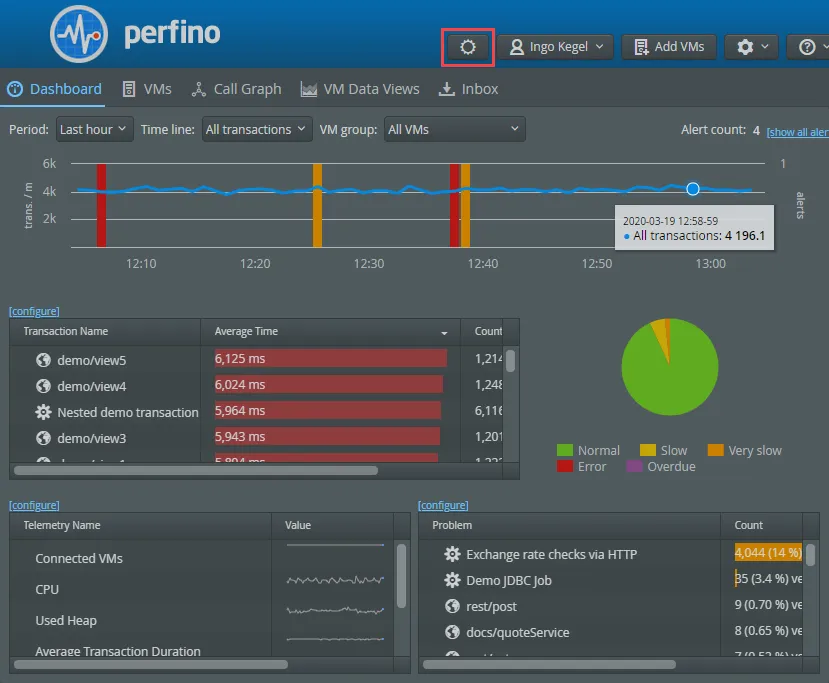
    A dark mode has been added. You can switch the theme with the theme selector button in the header at any time. The selection is persistent for your browser across sessions.

    Screenshot

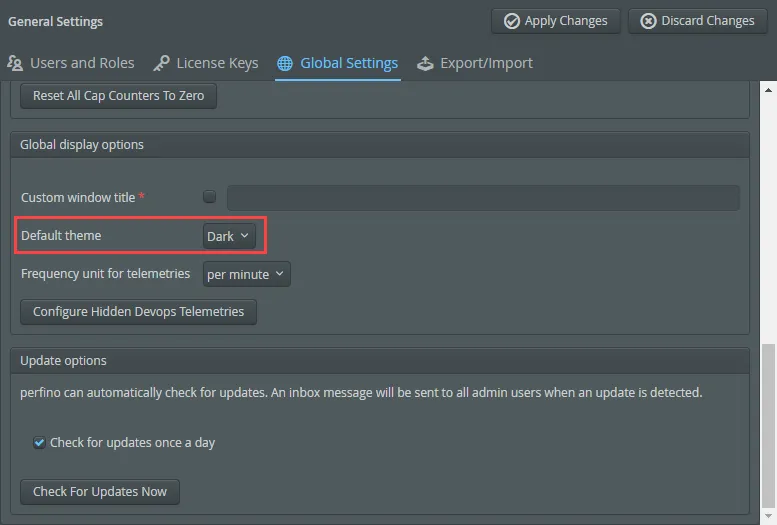
    The default theme is the light theme, but this can be changed in the general settings.

    Screenshot

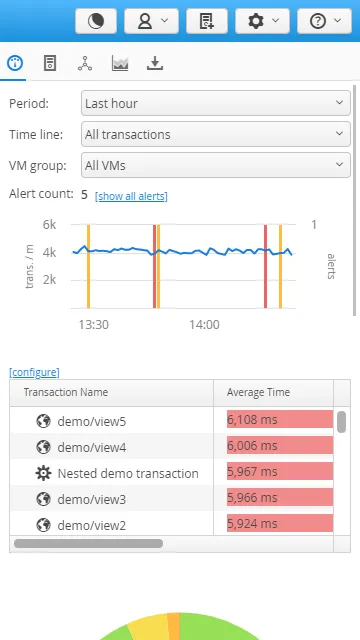
    The perfino UI is now responsive and works on mobile devices down to a viewport width of 320px.

    Screenshot

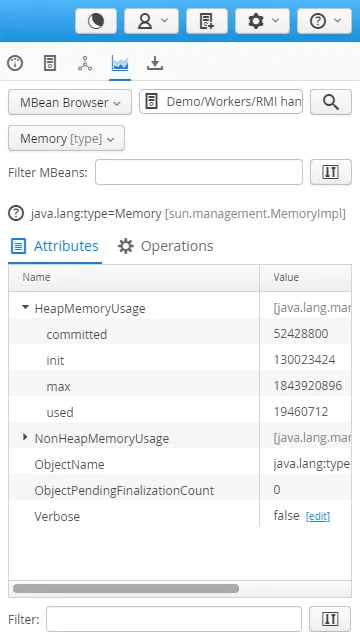
    Not only the dashboard, but all views and configuration screens adapt to the screen width of the device.

    Screenshot

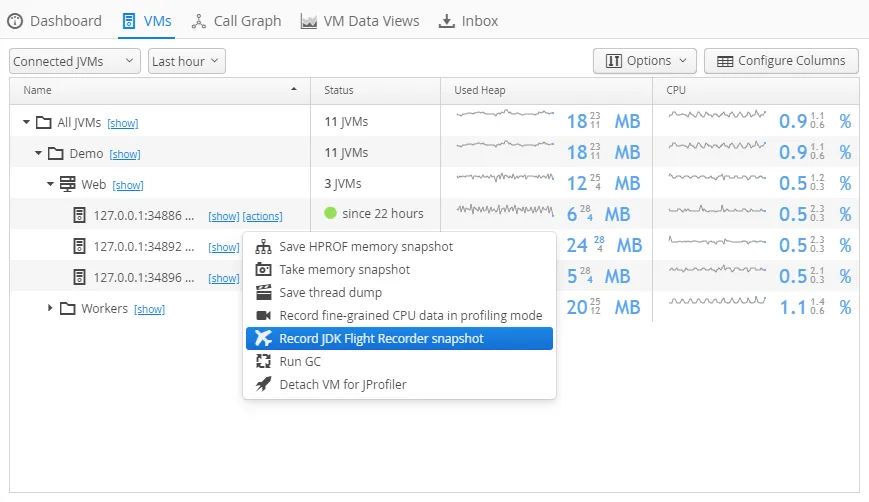
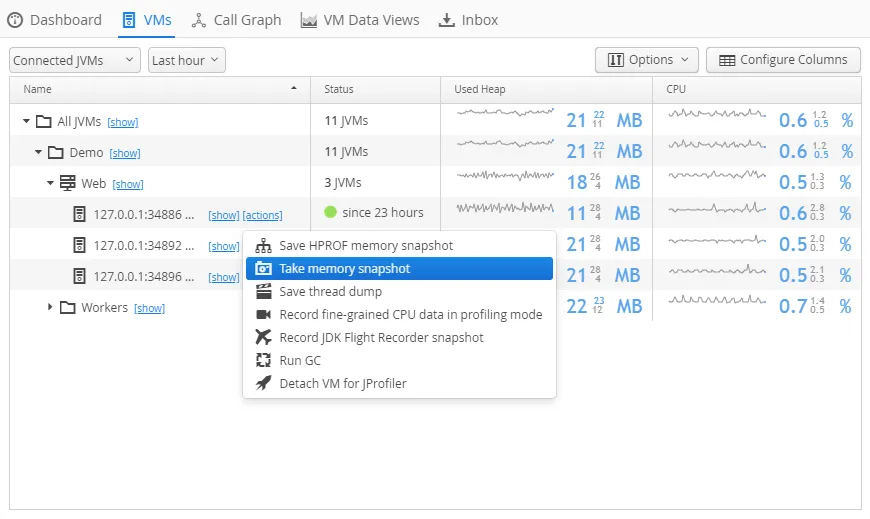
    JDK Flight Recorder (JFR) snapshots can be recorded from the VMs view. This is a non-intrusive way to collect more low-level profiling data for a selected JVM. A corresponding trigger action is also available.

    Screenshot

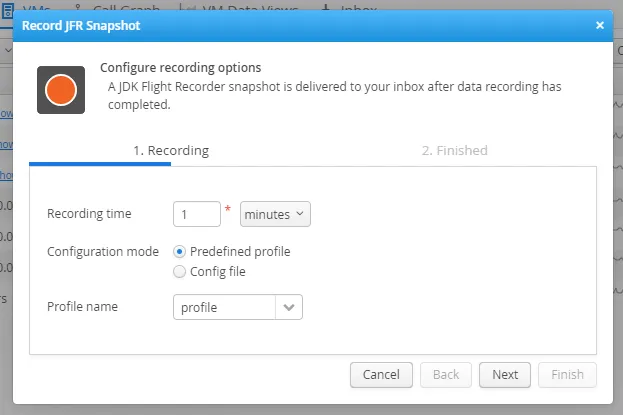
    In addition to the recording duration you can choose one of the predefined settings or upload a settings file that was exported from the "Flight recording template manager" in JMC.

    Screenshot

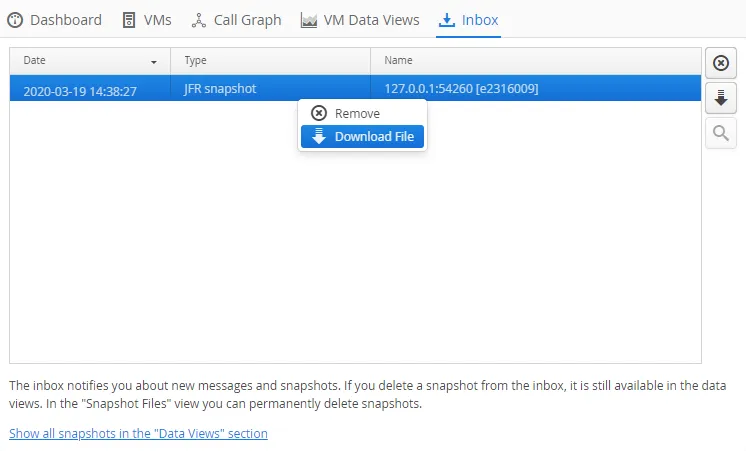
    When the snapshot is ready, you can download it from the perfino UI and open it in JProfiler or in JMC.

    Screenshot

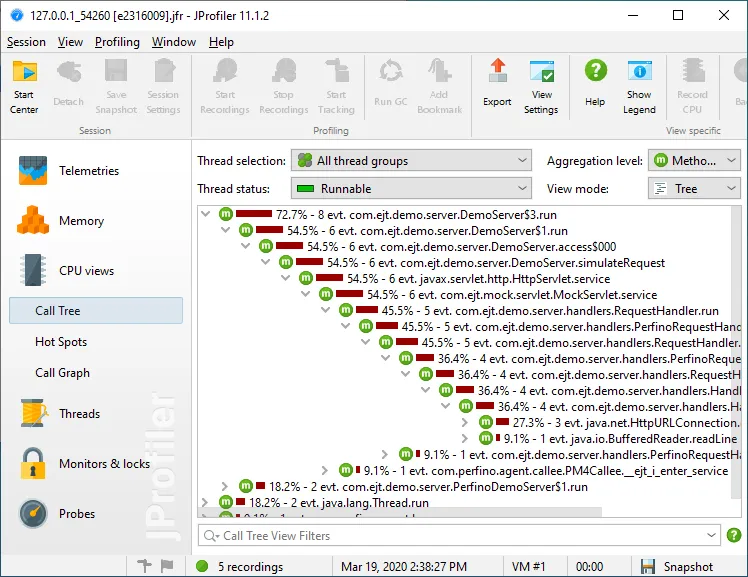
    In perfino's sister product JProfiler, both CPU and memory analysis as well as probes are available to deep-dive into the method-level details of the profiled JVM.

    Screenshot

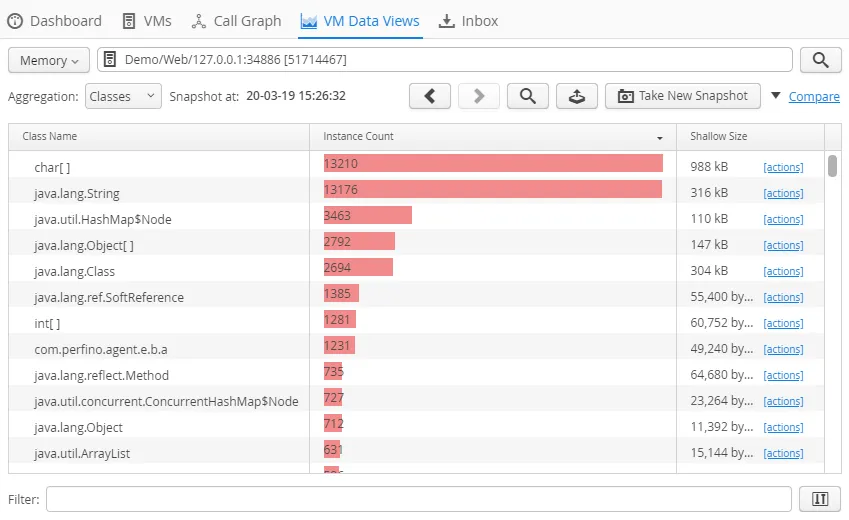
    Another new snapshot that can be taken from the VMs view as well as with a trigger action is the shallow memory snapshot that could previously only be recorded in the "Memory" data view. This is a low-overhead memory snapshot that gives you an overview on how many objects are on the heap.

    x
    Screenshot

    The action in the VMs data view switches to the "Memory" view to display the data, the trigger action simply adds the snapshot to the database, just like for the periodic snapshots.

    Screenshot

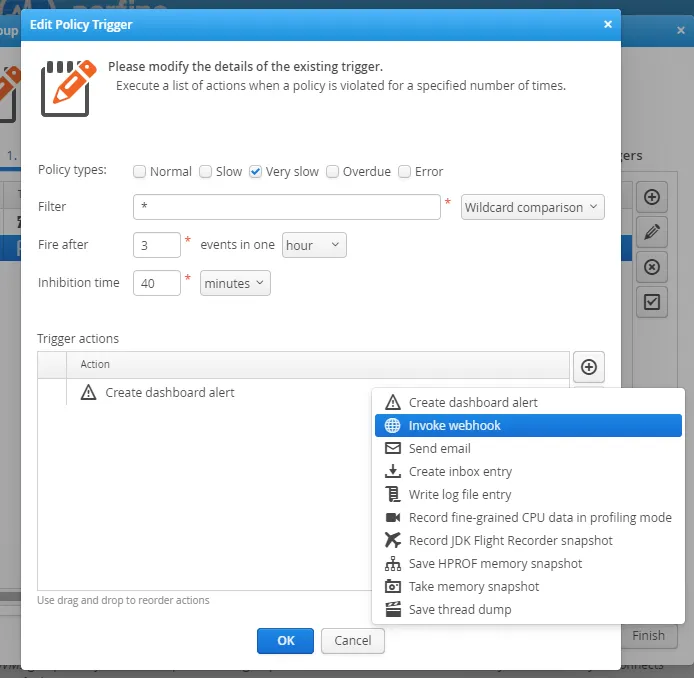
    With the new Webhook trigger action, you can invoke URLs when a trigger fires. Integration with chat servers, workflow tools or other monitoring solutions can often be implemented in this way.

    Screenshot

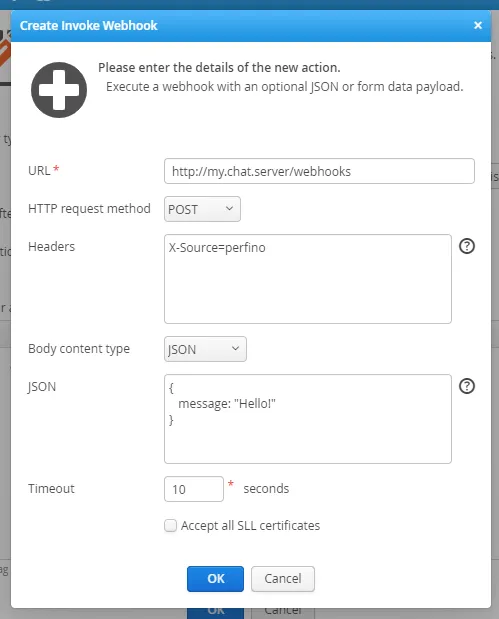
    Besides the URL, you can choose the HTTP request method, define headers and pass additional data as JSON or form data.

    Screenshot

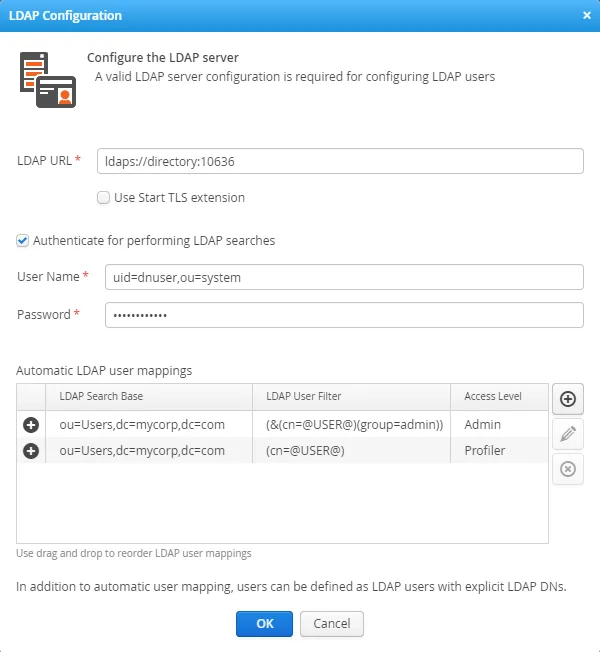
    With LDAP authentication you can delegate user authentication to an external LDAP server, such as Microsoft Active Directory. An LDAP server can be defined in the general settings. The protocols LDAP, LDAPS and StartTLS are supported, in addition, you can specify a user for performing searches.

    Screenshot

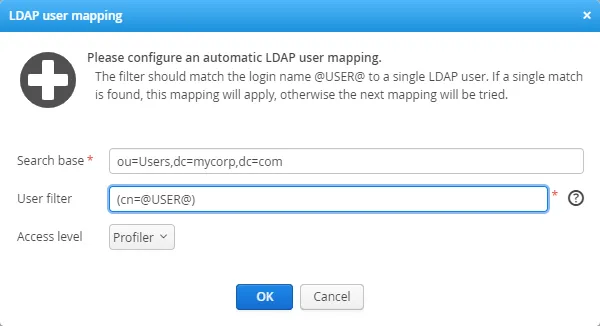
    LDAP users can be mapped automatically, by defining a search base and a user filter. When a user logs in, the specified user name will be tested against all mappings and the first matching mapping will be used.

    Screenshot

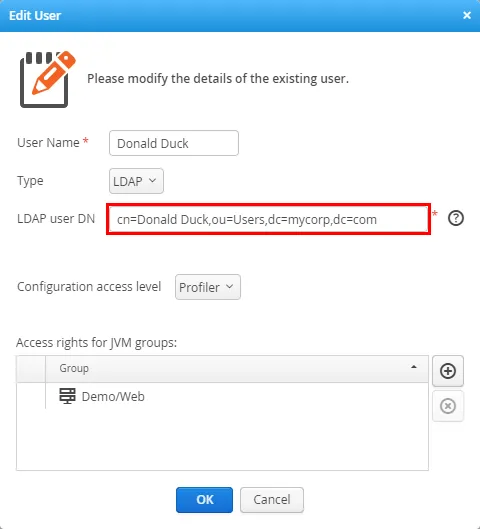
    After a user is authenticated by an LDAP server, a local user is created in perfino with an "LDAP" user type and an LDAP DN. Instead of mapping users automatically, you can also create such users manually and only defer the password authentication to the LDAP server.

    Screenshot

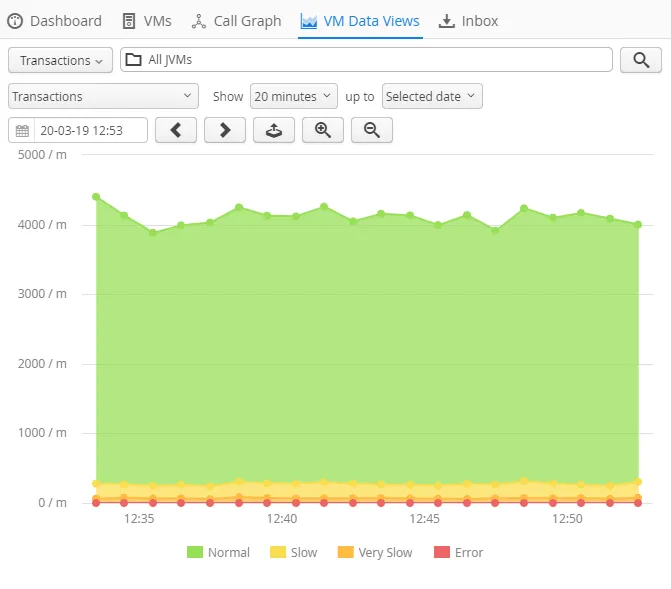
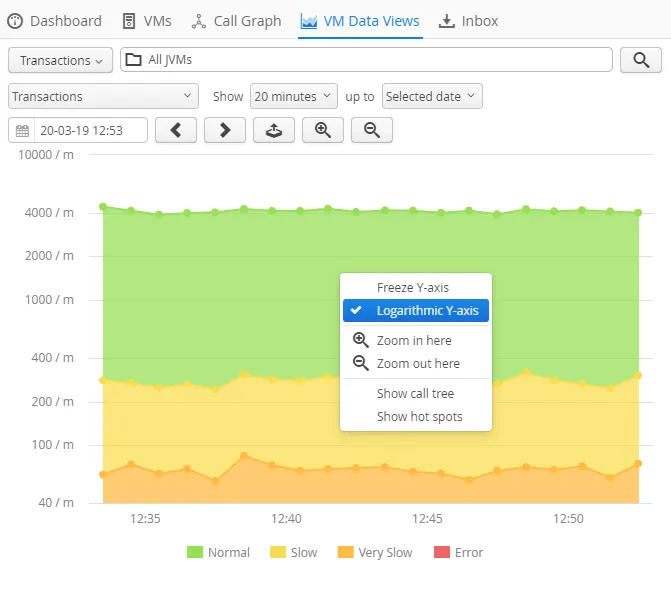
    Telemetries now offer options for displaying the y-axis in the context menu. One problem with telemetries is that expected outliers cause an excessive scale of y-axis for analyzing the regular data. Similarly, in stacked telemetries not all data lines have comparable magnitudes.

    Screenshot

    Switching to a logarithmic scale for the y-axis solves this problem.

    Screenshot

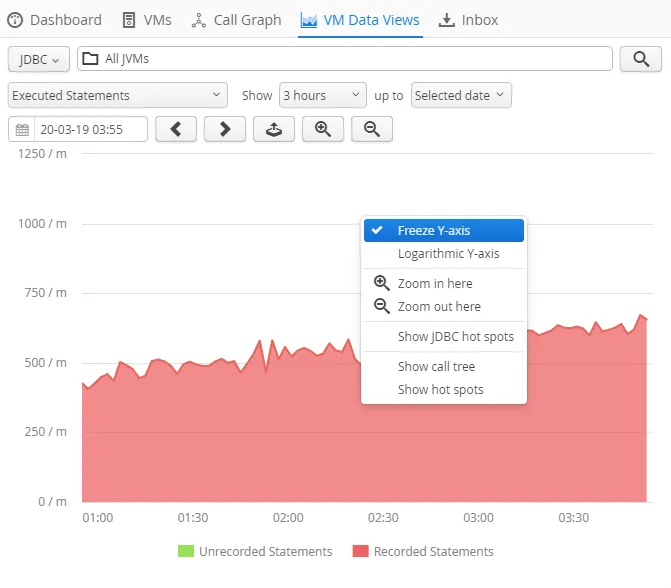
    Another problem is that the automatic adjustment of the y-axis while moving between time ranges can make it difficult to compare the absolute values. Now you can freeze the y-axis in the context menu.

    Screenshot

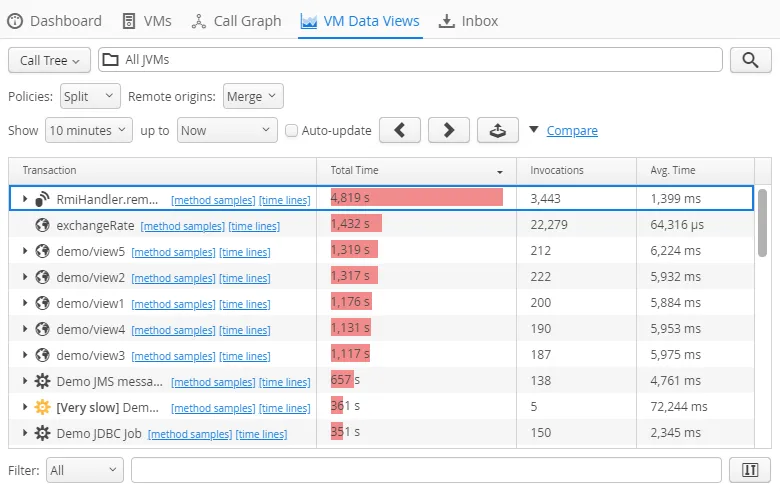
    The perfino UI is now much more keyboard friendly. Tables can be navigated with the keyboard, and there is a focus indicator for selected rows. Actions in table rows can be invoked with the enter key.

    Screenshot

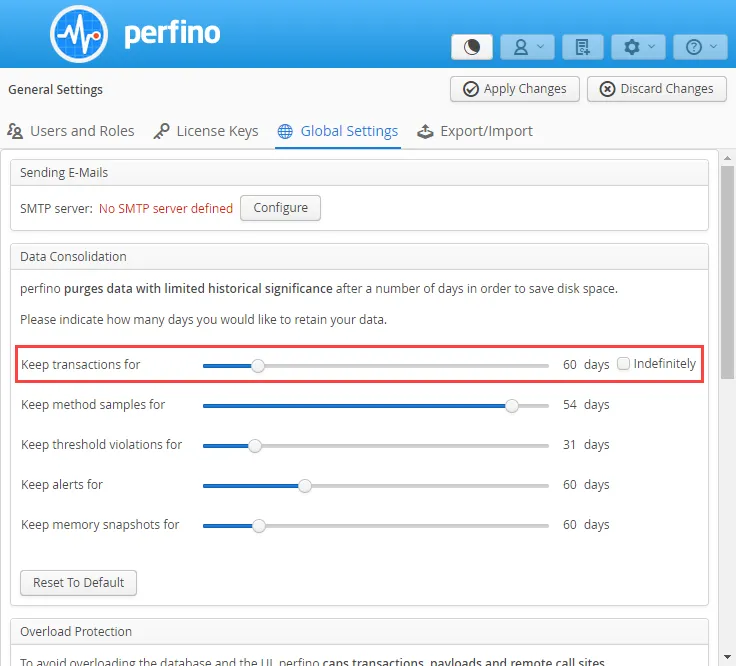
    A maximum retention time for transactions is now configurable. The default for new installations is 60 days. When upgrading from 3.x or earlier, the "Indefinitely" setting is activated, which was the only available behavior in previous versions.

    This limited retention reduces the size of database, especially in situations where a lot of different transaction names or payloads have been recorded that are otherwise never removed from storage.

    Screenshot
      perfino 3.02016-09-14change log

      perfino's licensing model has been changed to a micro service-friendly licensing scheme: Only the perfino installation requires a license, the number of monitored VMs is not important anymore.

      There is also no restriction on the number of machines on which the monitored VMs are running.

      Each separate perfino installation requires its own license.

      Screenshot

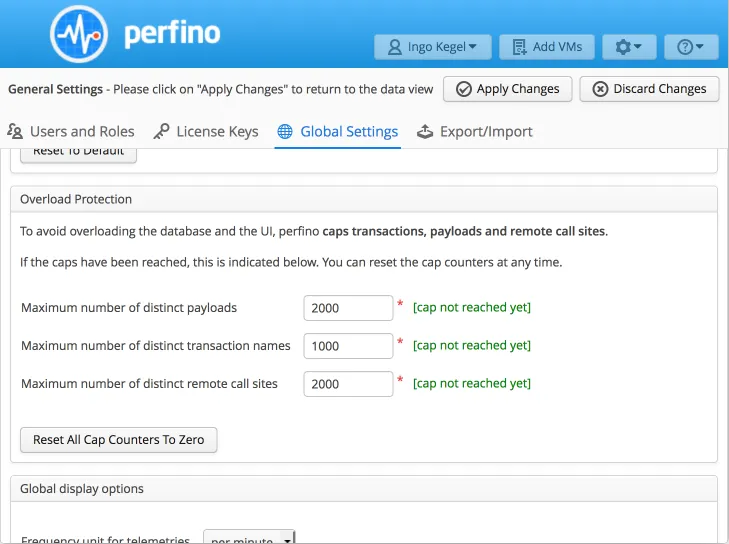
      perfino now has a comprehensive overload protection mechanism. When too much data is being collected, perfino consolidates data under "capped description" nodes.

      In the general settings, you can configure separate caps for payload data (for example SQL strings), transaction names and remote call sites.

      If any cap is hit, perfino sends you an inbox message. After fixing the configuration, you can reset the cap counters.

      Screenshot

      You can now perform hot backups of the database with the REST API. By calling the /triggerBackup URL, a directory named "backup" is created in the data directory that can be renamed to "db" when you need to restore the backup.

      If the REST API is impractical to use, or if you have not activated it for your perfino installation, you can also create a file named trigger_backup in the perfino data directory. After a few seconds, the file will be deleted and the backup will be performed.

      Also, the perfino database has been split into two parts, a database for the configuration and a database for the recorded data. You can discard the database with the recorded data if you want to start with a clean slate, but keep all your settings.

      The database size has been reduced considerably through various optimizations and shorter retention times.

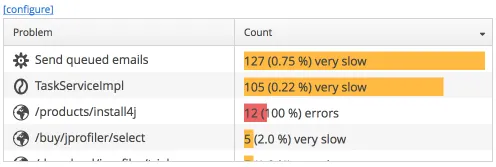
      A problems view has been added to the dashboard. If policy violations are detected for a business transactions ("slow", "very slow", "overdue" or "error") a row is added to the problems view, showing how many such issues have occurred in the selected time range.

      Screenshot

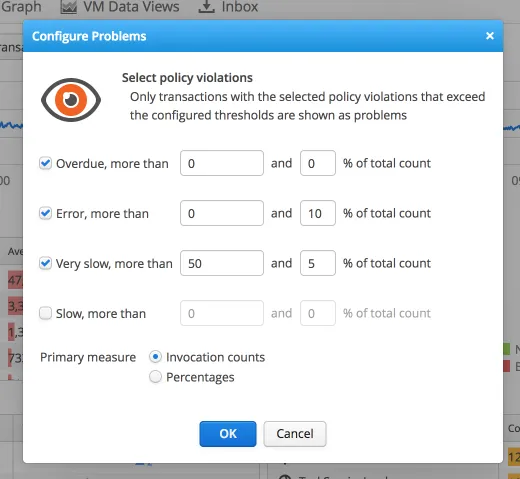
      You can configure absolute and relative limits for each policy violation type to limit the minimum severity for which a business transaction shows up in the problems view. Also, you can decide if the histogram should be drawn for the invocation counts or the percentages.
      Screenshot

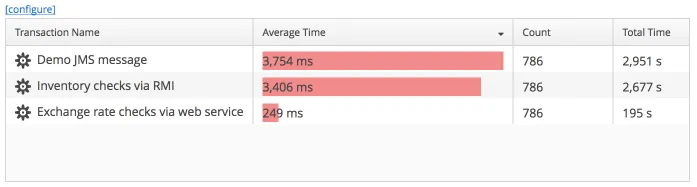
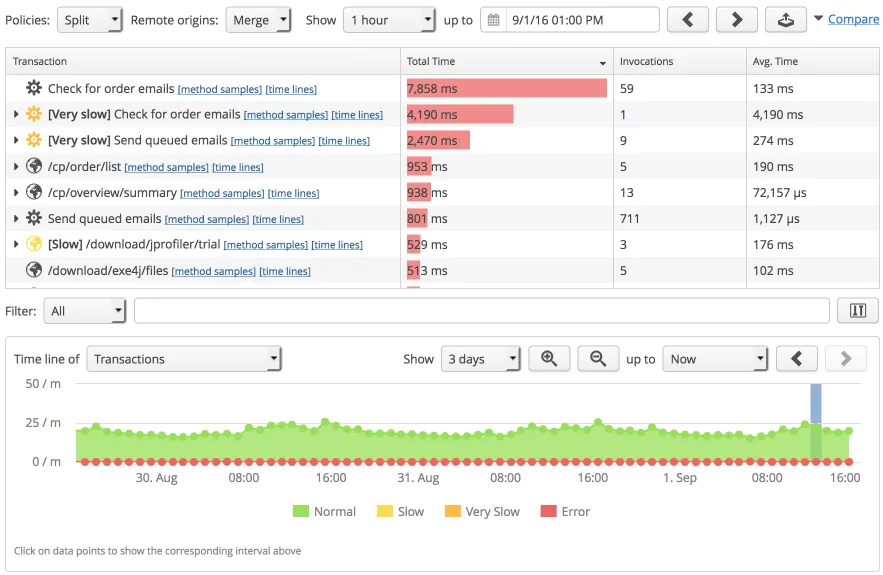
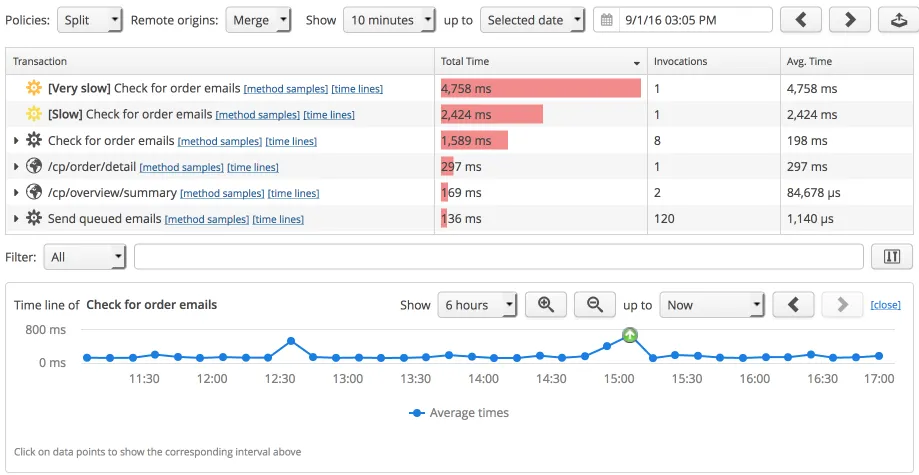
      The transaction table in the dashboard has been redesigned. It now shows count, average time and total time for your most important business transactions.
      Screenshot

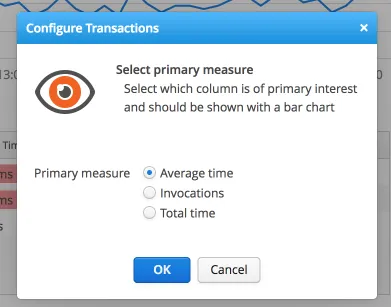
      Depending on your perspective, each of theses numbers can be the most important one. It's called the "primary measure" and it determines for which column an inline histogram is shown in the table.
      Screenshot

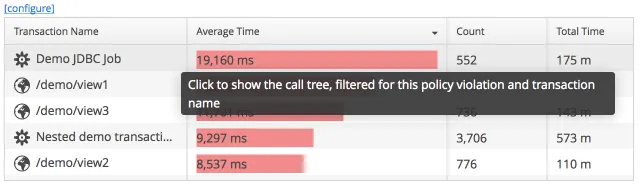
      All elements in the dashboard now link to the VM data views. When you click on rows in any dashboard table or a pie slice in the policy violation chart, the corresponding VM data view is shown with the appropriate view parameters, so you can start your drill-down directly in the dashboard.

      Screenshot

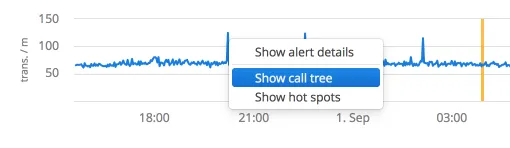
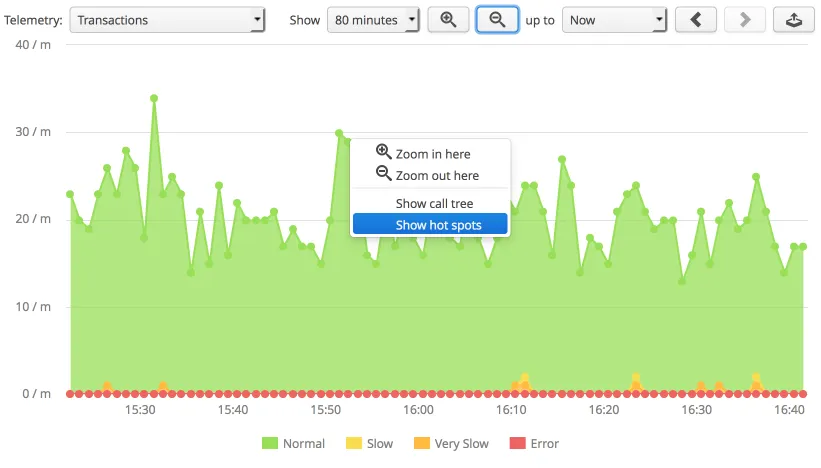
      In the transaction timeline, you can now right-click any data point and jump to the call tree or hot spots view.

      Screenshot

      Generally, all sparklines now link to their full telemetry views with similar time ranges, also in the columns of the "VMs" view.

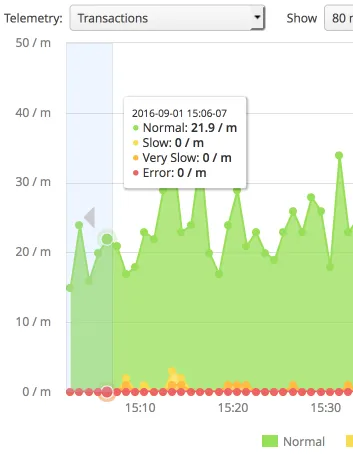
      Telemetries have been enhanced. In perfino 3, there are a lot more time ranges, and the new zoom buttons allow you to quickly see more or less data. Double-clicking on the timeline zooms in at that location, if possible.

      The context menu now contains actions for jumping to other relevant views at the selected point in time. Besides call tree and hot spot views, this can include probe hot spot views for probe telemetries.

      Screenshot

      When you zoom or navigate the time range to earlier or later times, vertical scale changes are animated, this makes it a lot easier to interpret data. Navigating is now more convenient with the additional inline navigation buttons that appear when you hover at the edges of the telemetry.

      Moving to earlier or later times now shifts the starting point of the displayed interval by 1/3 of the total display range. To skip full intervals, press the CTRL key while navigating.

      Screenshot

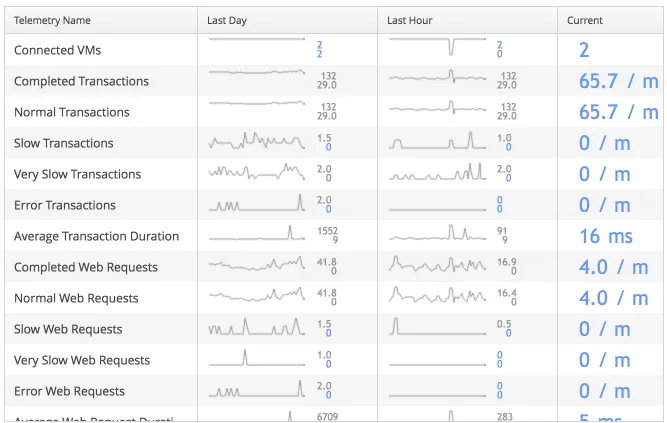
      When you select the "Telemetries" or the "Custom telemetries" node in the view selector, you now see an overview for all contained telemetries with sparklines for the last hour and the last day. Clicking on any sparkline will show the full telemetry view with a similar time range.

      Screenshot

      Transaction timeline for call tree and hot spot views. The new transaction telemetry at the bottom gives you a better context for the main view by showing the displayed time range with a different background. Also, it allows you to navigate to a particular interval by clicking on a data point.

      Screenshot

      The timelines for single transactions are still available and hide the default transaction time line. With the "close" button, you can restore the default transaction timeline.

      Screenshot