What's new in JProfiler

Please see the change log for a detailed list of all changes.

JProfiler 16.22026-07-16change log

Offline profiling can now be configured directly in the -agentpath VM parameter, without a JProfiler config file. Previously, offline mode required you to export a session configuration from the JProfiler UI first.

You can specify the most common profiling settings inline: the call tree collection mode with callTreeMode and the profiled, compact and ignored package filters with profile, compact and ignore. On top of that, you can add a complete automated recording sequence that saves a snapshot without any API calls or jpcontroller, using the snapshot, recording, duration and delay options.

For example, the parameter

-agentpath:...=offline,callTreeMode=sampling,profile=com.mycorp.,\
    snapshot=/tmp/snapshot.jps,recording=cpu:allocation,duration=10m

records CPU and allocation data for ten minutes and then saves a snapshot.
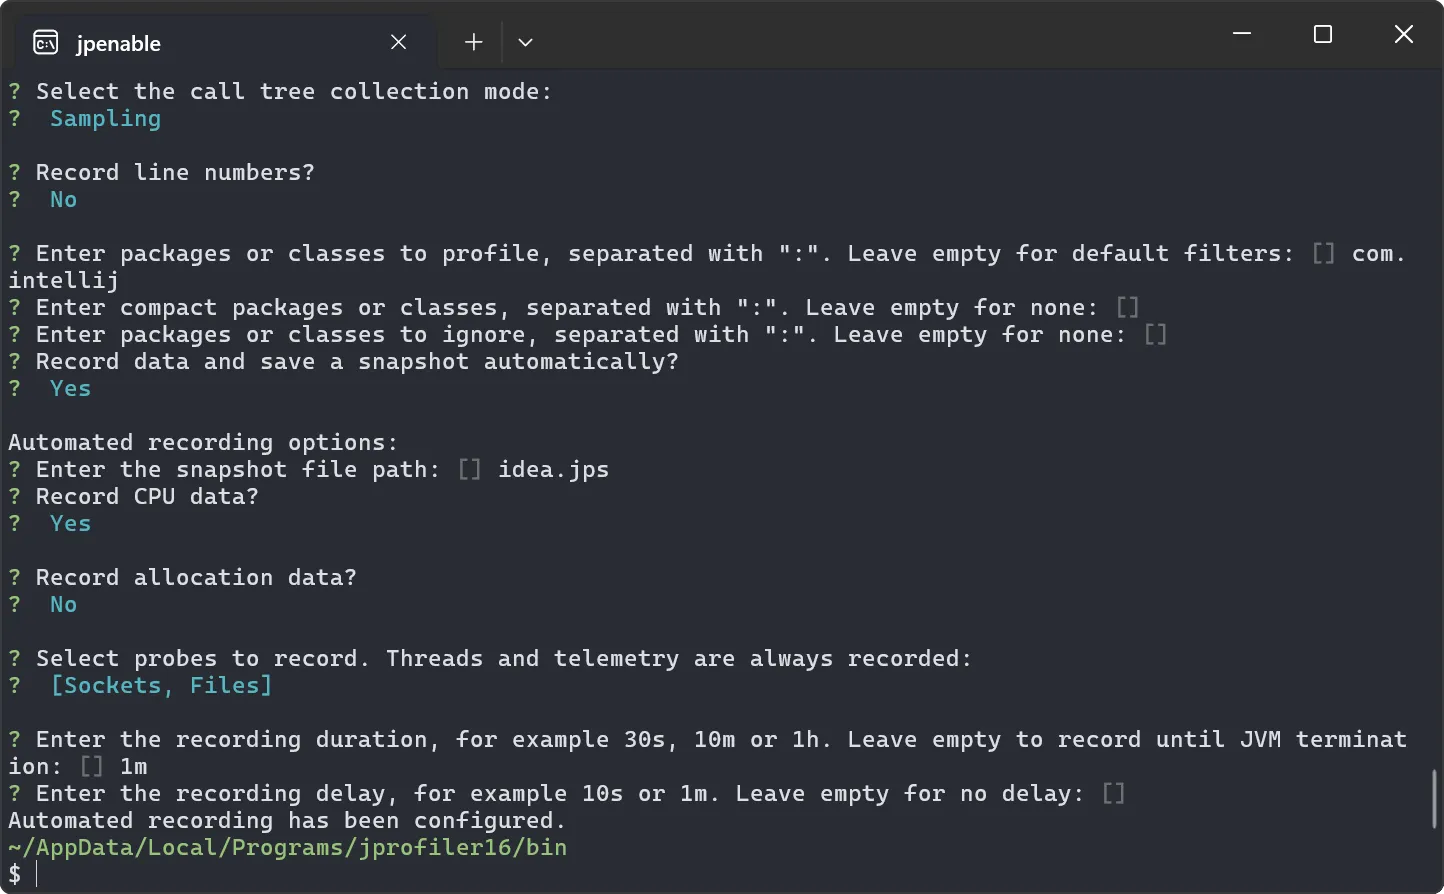
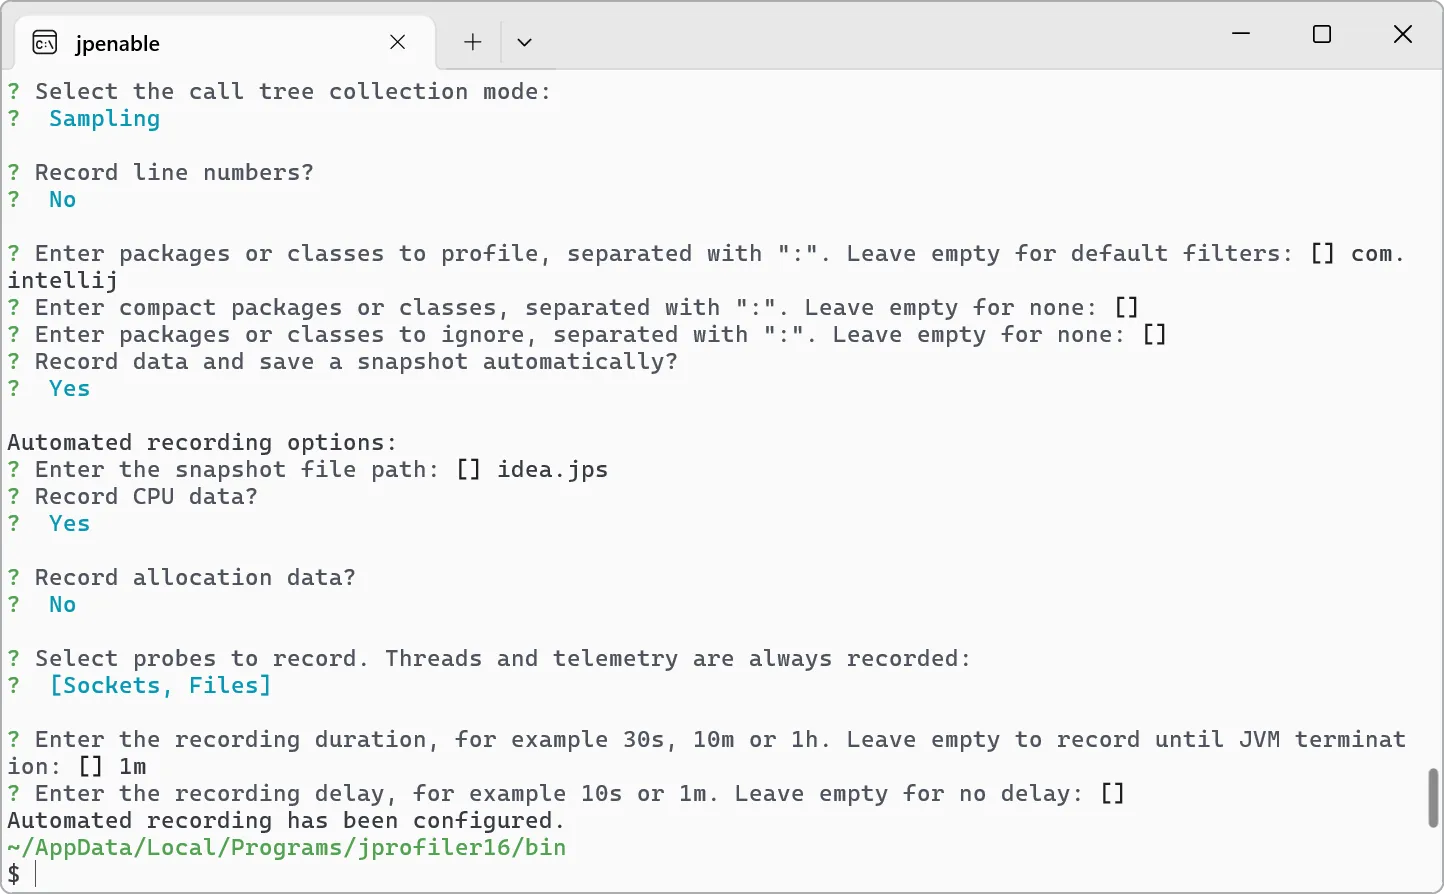
The same inline settings and recording options are also available for the jpenable command line tool, which attaches the profiling agent to an already running JVM. When you select offline mode, jpenable guides you through the settings with its interactive rich console.

ScreenshotScreenshot

Alternatively, you can supply the settings on the command line with --call-tree-mode, --profile, --line-numbers, --snapshot, --recording, --duration and more for non-interactive use in a CI pipeline.

The Gradle and Ant profiling tasks expose the same capability through task attributes, so you can configure offline profiling and automated recording sequences right in your build script.

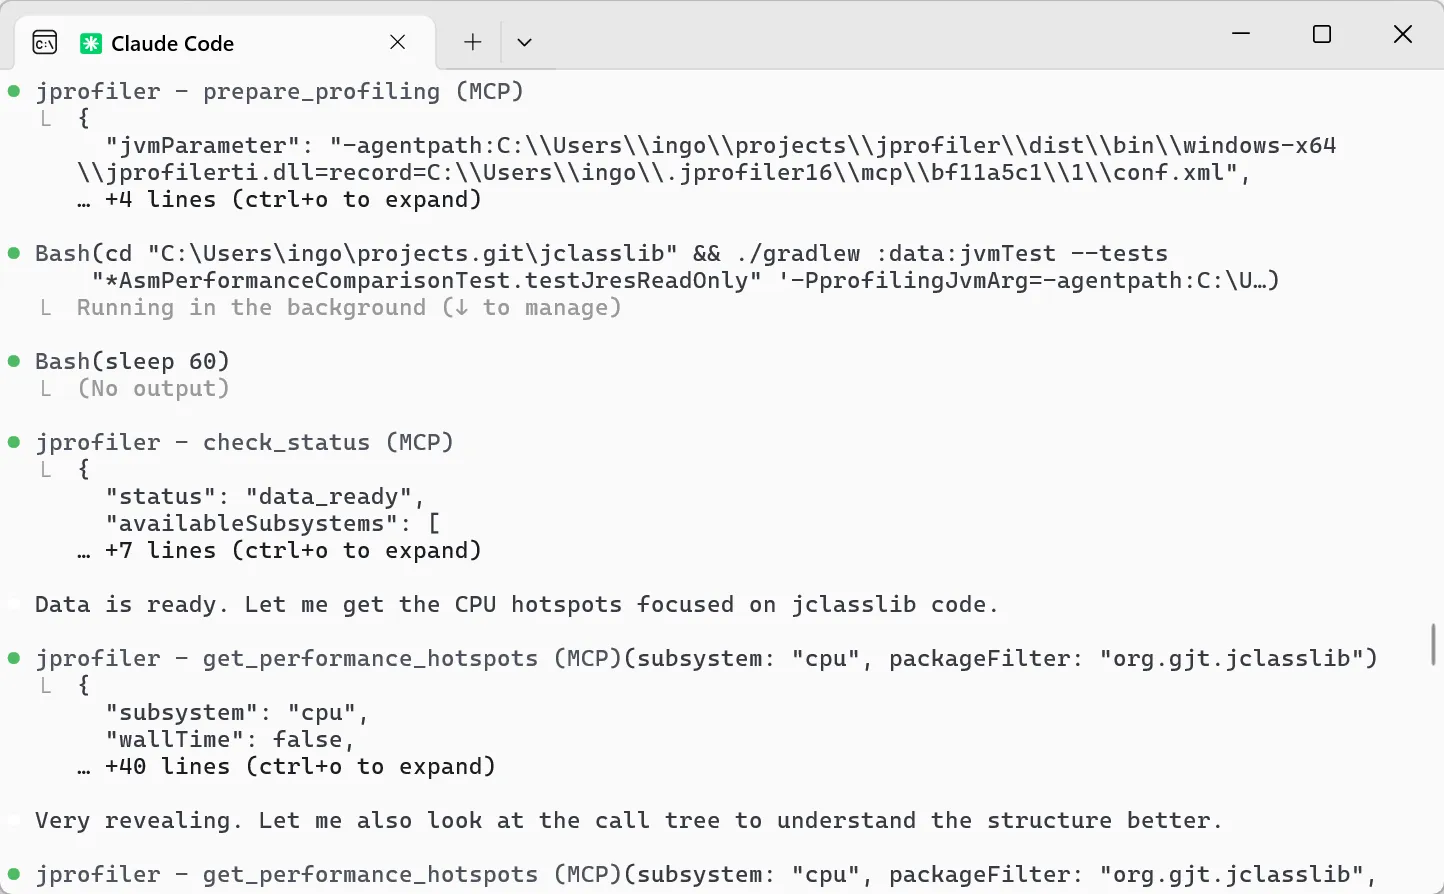
The MCP server introduced in JProfiler 16.1 has been improved. It now works reliably with weaker models and follows the profiling workflow more robustly. Antigravity has been added as a supported AI coding tool.

JProfiler 16.12026-04-09change log

JProfiler now ships with an MCP (Model Context Protocol) server that lets AI coding agents profile your Java applications, analyze the results, and act on them. It works with Claude Code, Cursor, Codex, Gemini CLI and any other MCP-compatible AI coding tool.

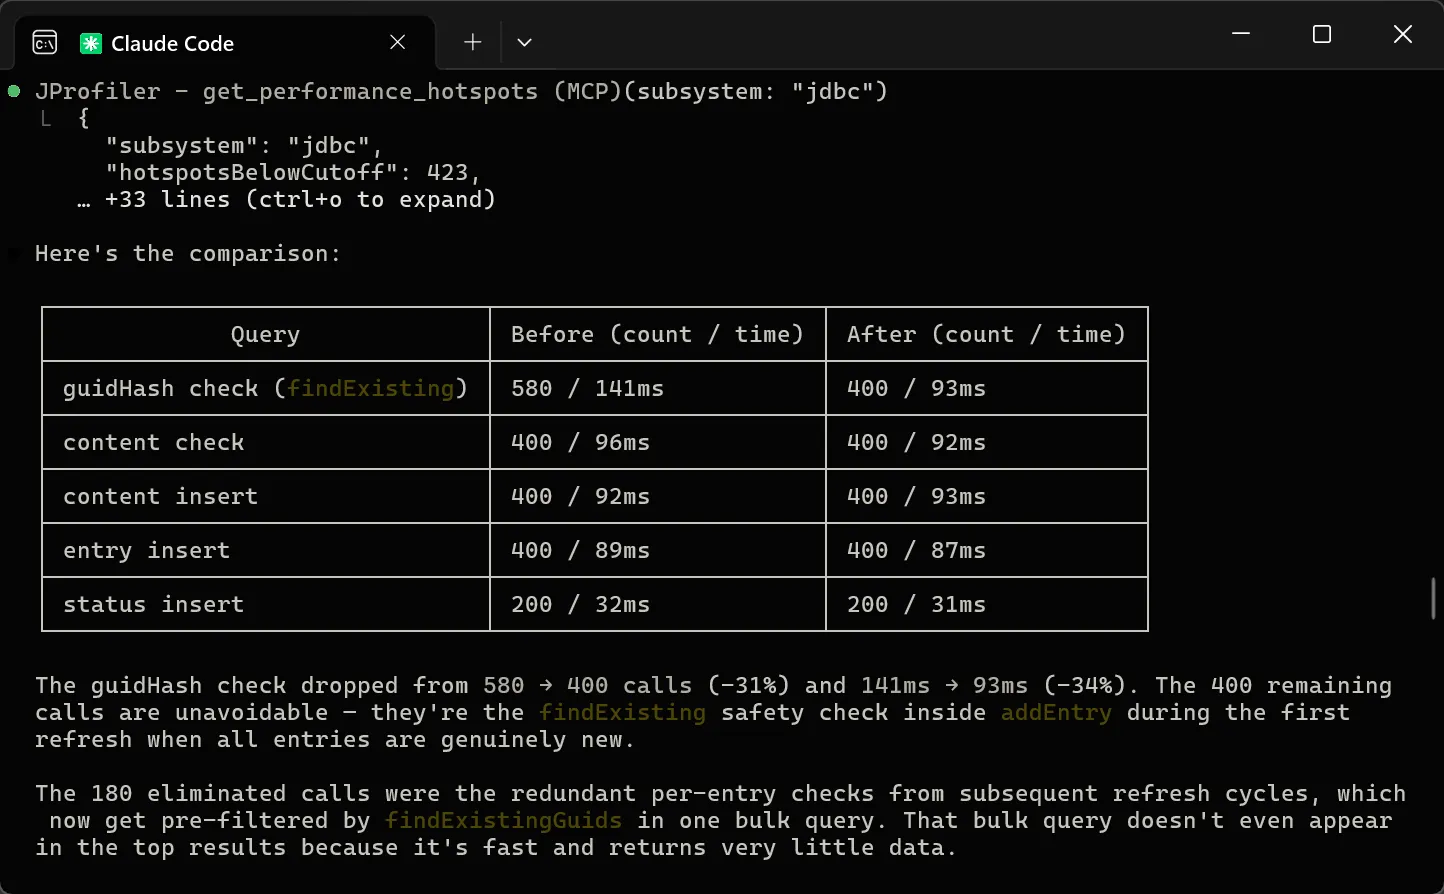
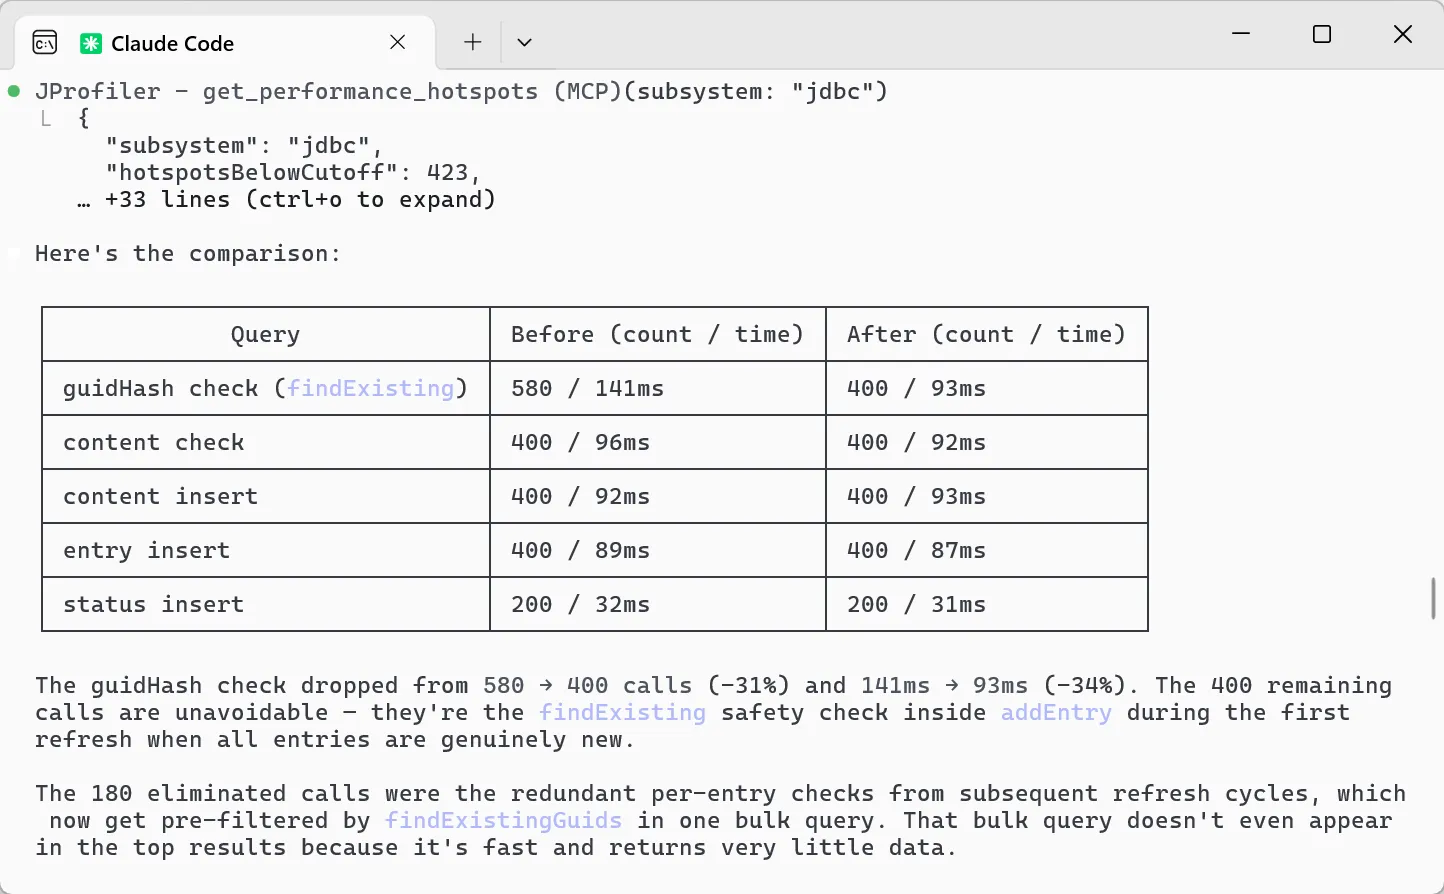
Until now, profiling has been something you do with a GUI: you start a session, navigate views, and interpret data. With the MCP server, an agent can close the loop on its own. It profiles an application, discovers that JDBC queries dominate execution time, modifies the code to eliminate redundant database calls, re-profiles to verify the improvement, and presents a before-and-after comparison with concrete numbers.

ScreenshotScreenshot

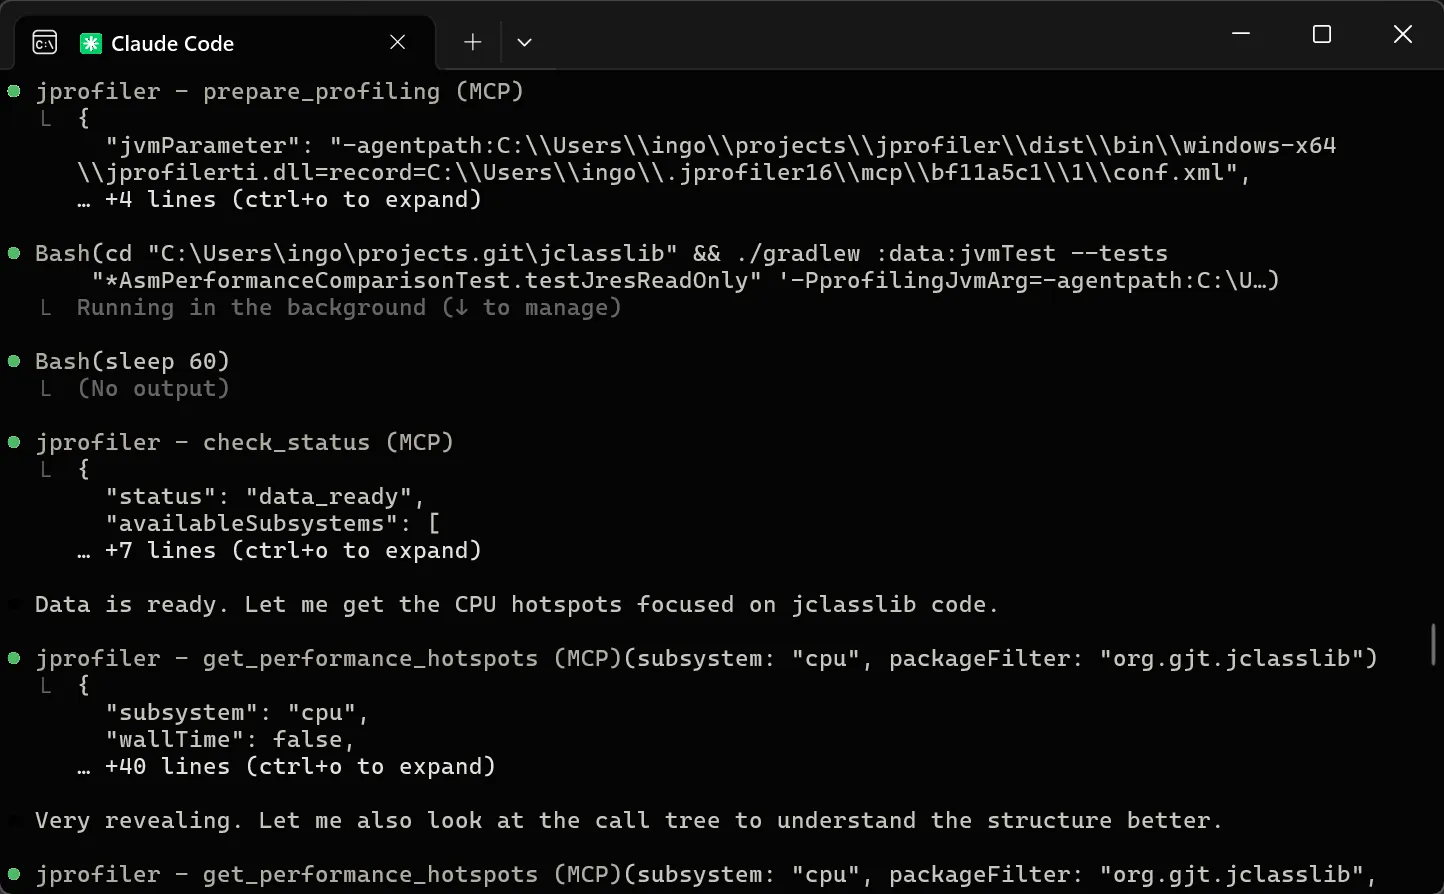
The tools exposed by the MCP server have been carefully crafted and tested so that agents reliably follow a profiling workflow that mirrors how an expert would use JProfiler. The agent first sets up profiling for the target application. After the test run completes, it checks for data availability and retrieves the initial aggregated hotspot view to understand where time is being spent. From there, it drills into specific hotspots, following the call chain to the root cause.

The data at each step is carefully filtered so agents see what matters without being overwhelmed, whether they are analyzing CPU hotspots, JDBC and JPA queries, HTTP calls, MongoDB operations, or heap dumps. Beyond live profiling of local and containerized JVMs, agents can also load existing JProfiler, HPROF, or JFR snapshots for analysis.

ScreenshotScreenshot

Setup is zero-friction: the MCP server auto-installs the JProfiler binary on first use and handles licensing through the MCP protocol. You can set up your agent directly from the JProfiler UI, or follow the instructions on the MCP setup page. For the full story behind this release, see the announcement blog post.