JProfiler 11.0 introduces the following notable new features:
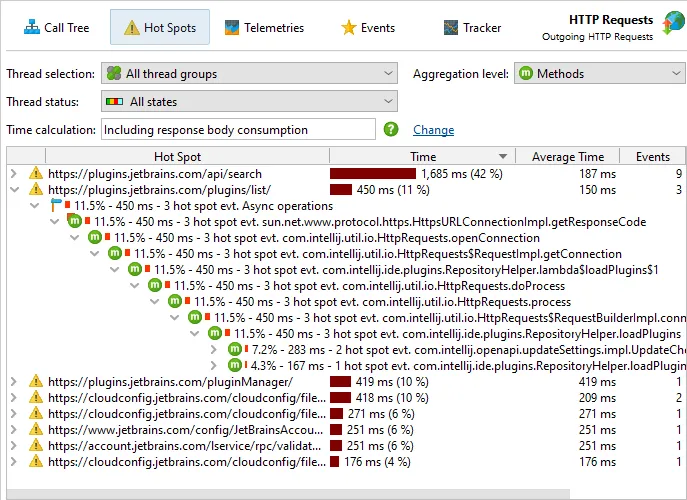
An HTTP probe for outgoing requests has been added. Both synchronous and asynchronous calls are
measured. The supported HTTP clients are:
- java.net.URLConnection
- Java HTTP Client (Java 11+)
- Apache HttpClient 4.x
- Apache Async HttpClient 4.x
- OkHttp 3.9+
- Jersey (JAX-RS) Async Client 2.x
- RestEasy Async Client 3.x
- CXF Async Client 3.1.1+
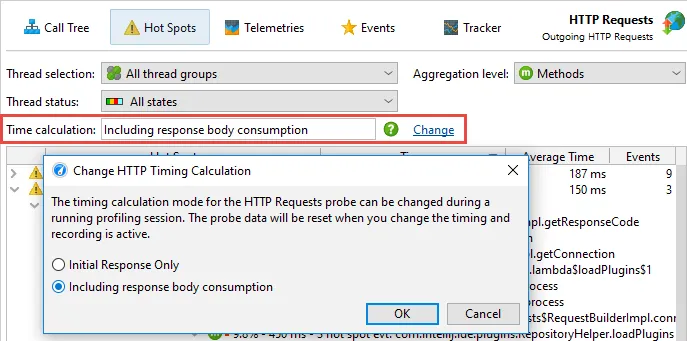
You can choose whether to include the consumption of the request body in the time measurement or stop
timing when the response code is available. This setting can be changed on the fly.
As with other probes, you can optionally annotate HTTP requests into the call tree view.
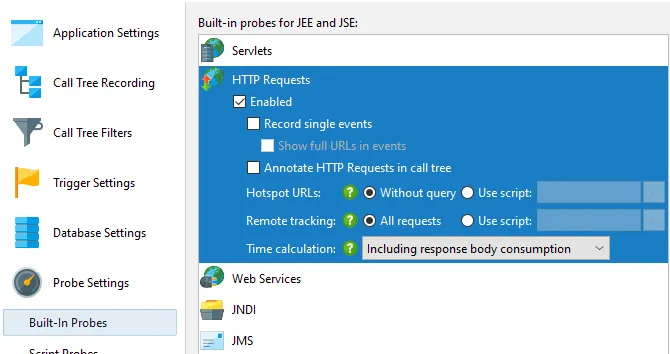
By default, the description of the HTTP request is the URL without the query, with an option
to retain the full URL for the probe events view. Optionally, you can configure a script that constructs
a description for the HTTP request which may be important to get useful hot spots.
HTTP calls can now be tracked between JVMs. When using a supported HTTP client and a servlet
container on the server side, call sites and execution sites are navigable in both directions.
Call sites get a special icon and a hyperlink that shows the execution site in the server JVM
that must be profiled and open in a separate window for the navigation to work.
Execution sites are recorded separately for each call site so you can analyze different types of requests
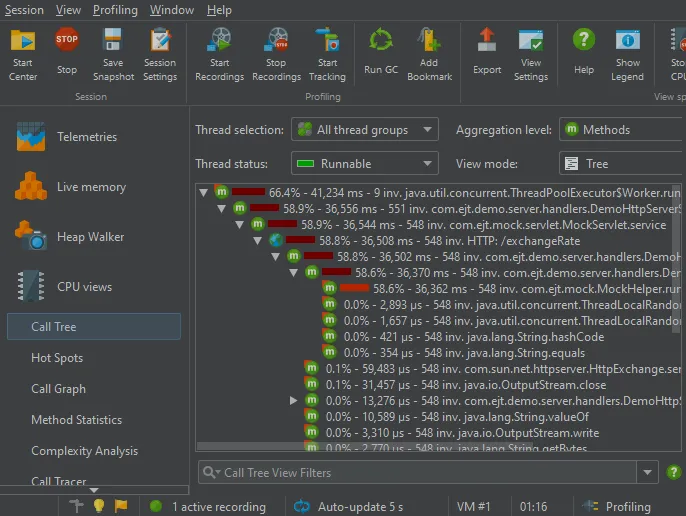
in isolation. Each execution site is represented by a special node that is inserted into the call tree.
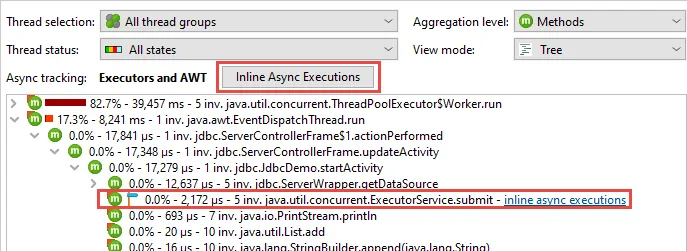
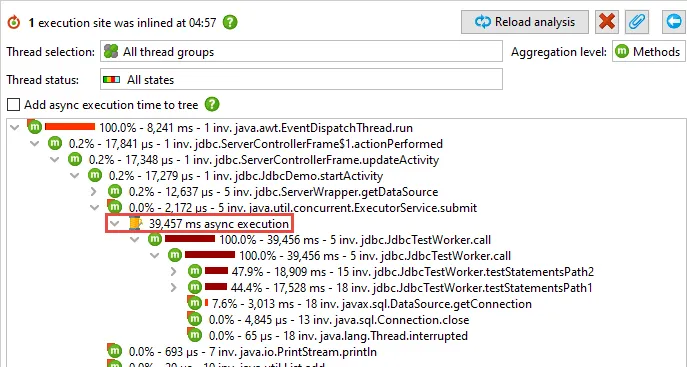
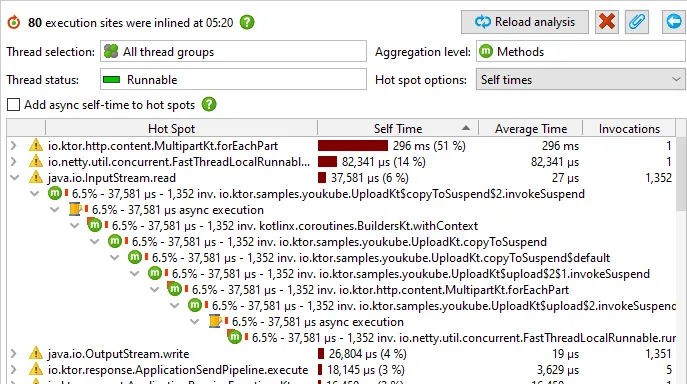
Async executions can be inlined. Both call tree and hot spots views now have an
"Inline Async executions" call tree analysis for this purpose. If async tracking is active,
a status display above the call tree provides easy access to the action that creates the inlined view.
Also, nodes in the call tree where an async call was intercepted have a corresponding hyperlink.
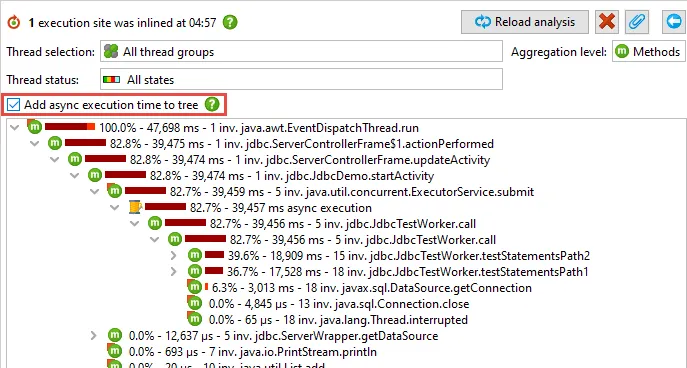
In the call tree analysis, "async execution" nodes show the call tree from the execution sites.
By default, the time below async nodes is not added to the parent nodes in the tree to show the non-blocking
nature of the calls.
You can also choose to add the times as though the calls were blocking. This is useful for analyzing
which call stacks cause most time to be spent in the async execution sites.
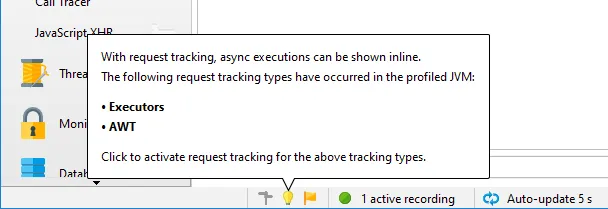
When async tracking is not activated, JProfiler detects which async tracking types have occurred in the JVM
and presents them to you in the status bar. With a single click you can then activate tracking.
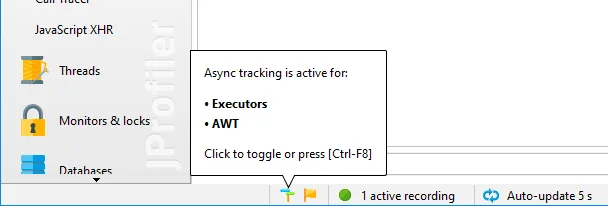
To quickly see which async tracking types are activated, hover the mouse over the status bar icon and click it
to invoke the configuration dialog.
If async calls originate in unprofiled call stacks, they are not recorded by default in order to avoid
cluttering the analysis with framework internals. If such filtered async calls are detected, the async status bar
offers actions to switch on recording for these calls.
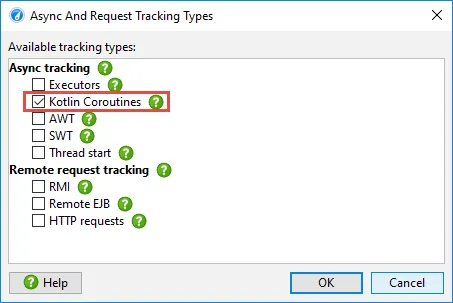
Support for tracking Kotlin Coroutines has been added.
Coroutines are the basis for
asynchronous programming with Kotlin in a multi-platform way. Without dedicated tool support, a call tree
involving coroutines is highly segmented and a lot of information about causality is lost.
When the tracking of Kotlin Coroutines is activated, the "Inline Async executions" call tree analysis produces
a call tree that shows call stacks across suspension boundaries. If applied to the hot spots view, the
call tree analysis shows you backtraces that would otherwise terminate at the first suspended method call.
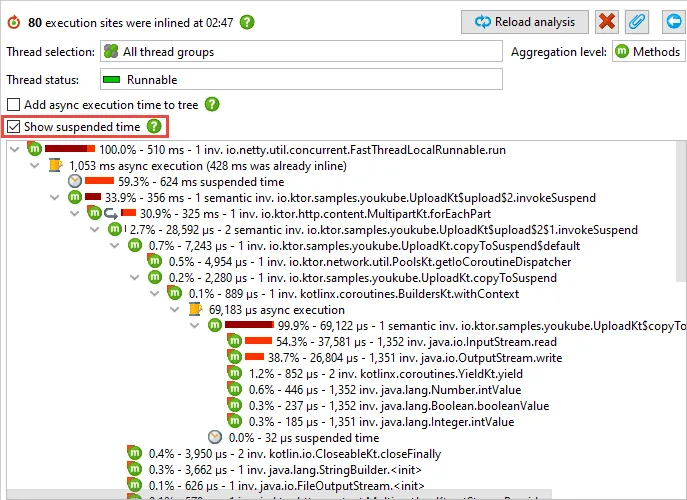
Kotlin Coroutine tracking also measures the times when coroutines are suspended and shows these times in separate
nodes in the inline call tree. This is needed to determine how long coroutine execution takes in total. If only
the actual processing times of coroutines are of interest, suspended times can be hidden.
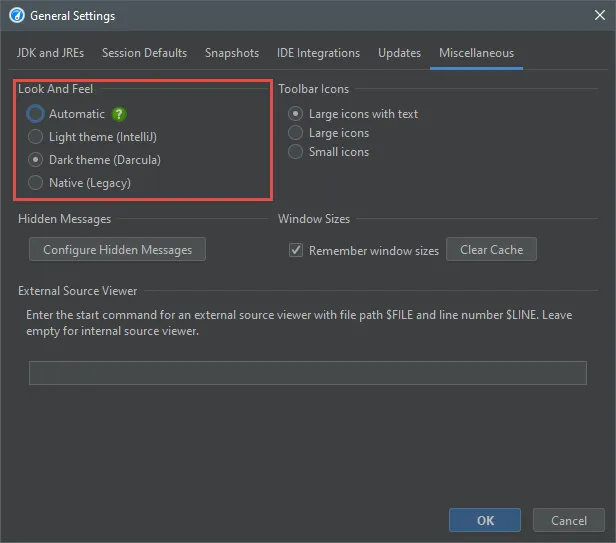
JProfiler has new light and dark look and feels. The look and feels are based on the
IntelliJ IDEA Darcula look and feel and its light
derivative. These look and feels support HiDPI on Windows, Linux and macOS. On Windows and macOS,
JProfiler is bundled with the "JetBrains Runtime" OpenJDK
that has better HiDPI support than the default JDK.
The default setting for the look and feel is now "Automatic", which chooses the dark theme if the OS is in dark
mode and the light theme otherwise. This detection is currently implemented on macOS 10.14+ and Windows 10 build 1809+.
A non-interactive mode for jpcontroller has been added. jpcontroller is a command line executable for
controlling recording and saving snapshots. In addition to the existing interactive mode, you can now also
automate profiling sessions without the need for manual input.
For an automated invocation, you pass [pid | host:port] to select a profiled JVM as well as the
--non-interactive argument. A list of commands is read, either from stdin, or from a command file that
is specified with the --command-file argument.
Commands for this non-interactive mode are the same as the method names in the
JProfiler MBean.
They require the same number of parameters, separated by spaces. In addition, a sleep <seconds>
command is provided.
For example, a command sequence could look like this:
addBookmark "Hello world"
startCPURecording true
sleep 10
stopCPURecording
saveSnapshot /path/to/snapshot.jps
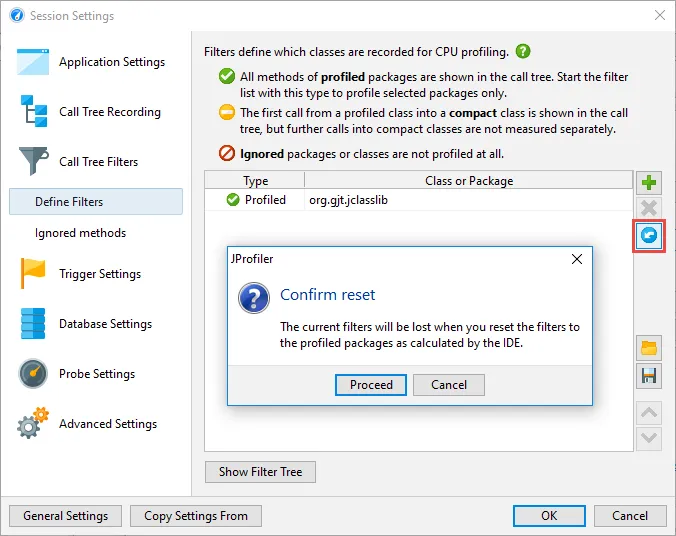
Automatic detection of call tree filters for IDE integrations. For new sessions, the IDE integrations
for IntelliJ IDEA, eclipse, and NetBeans now scan the source packages of the profiled project and set inclusive
filters accordingly. Inclusive filters yield much better results than the default exclusive filters.
If all packages with editable source files have a common prefix package, that package will be used, otherwise
all top-level packages that contain classes will be added separately.
This detection will only be performed the first time a project is profiled, and any manual changes in the
call tree filter settings will not be lost. On the "Define filters" tab of the session settings dialog, you can
force this calculation to be repeated with the reset button.
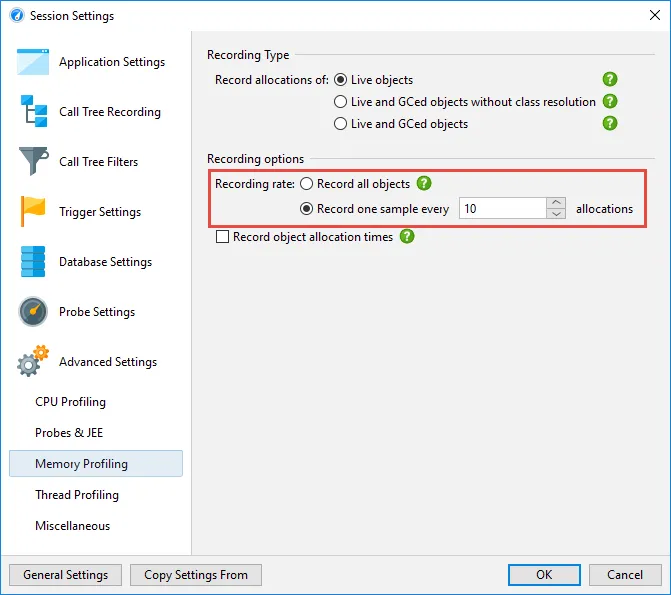
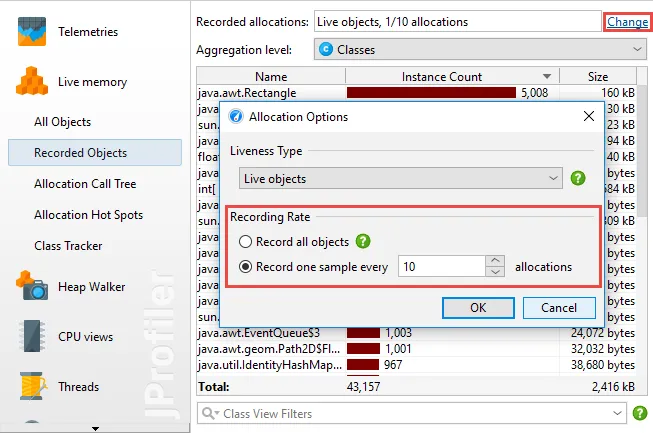
Sampling for allocation recording reduces the high overhead of allocation recording considerably.
By default, every 10th allocation is recorded which roughly reduces the overhead to 1/10th compared to
recording all allocations.
For live sessions, the sampling rate can be adjusted on the fly without losing any data.
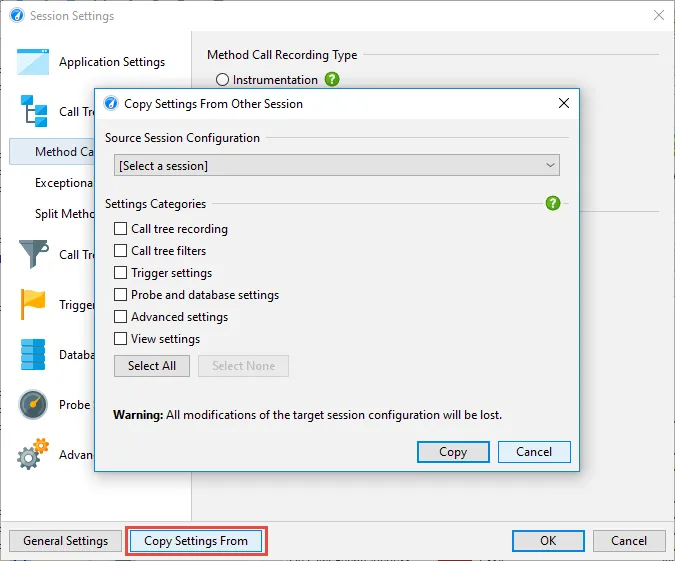
Session settings have been improved. The previously separate "Profiling settings" dialog has been integrated
into the new session settings dialog.
You can now easily copy selected parts of other sessions into the current session configuration.
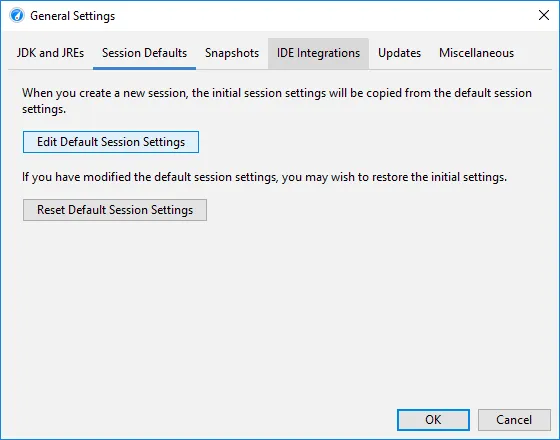
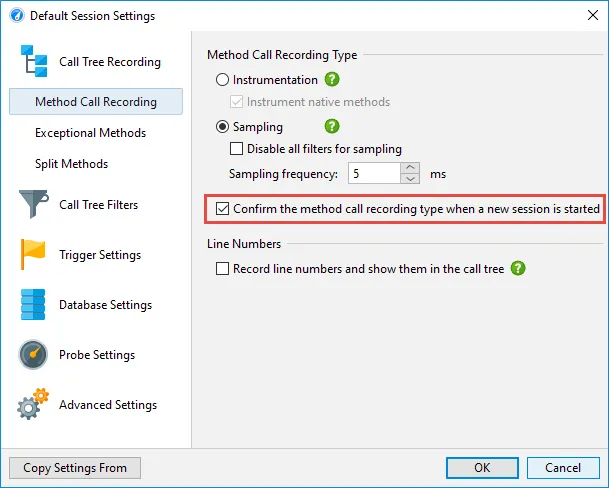
There is now a default session that you can configure from the general settings dialog. All new sessions
start out with these defaults.
In the default session, you can now disable the initial question for new sessions whether
sampling or instrumentation should be used.
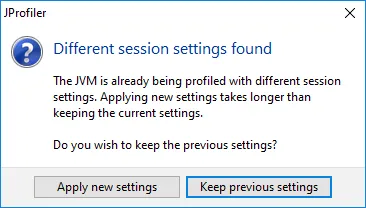
If you connect to a JVM is already profiled with different session settings, JProfiler will give you the option
to keep the previous session settings. These previous settings can be inspected in the session settings
dialog after the profiling session has been started. This mechanism eliminates time-consuming class
retransformations.
Applying profiling settings at startup without using the JProfiler UI has been made more convenient.
When using the "id" or "config" options in the -agentpath VM parameter, you no longer have to specify the
"nowait" option which is now implied. The "id" option is no longer necessary if the config file only contains
a single session. A typical VM parameter for profiling will now look like this:
-agentpath:/opt/jprofiler/bin/linux-x64/libjprofilerti.so=config=~/jprofiler_config.xml
The ~ character is now replaced with the home directory on all platforms, and the default name of the JProfiler
config file has been changed to jprofiler_config.xml in order to make it less generic.
When configuring profiling sessions on remote machines or offline profiling sessions without the JProfiler UI,
it is sometimes necessary to inspect the config file and make manual changes. In this release,
the config file format has been improved making it less verbose by omitting default settings and
making all aspects of the configuration easily understandable.
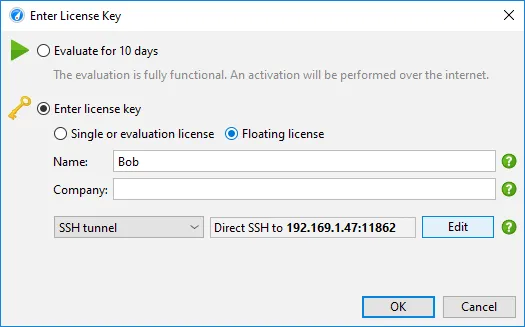
Floating licenses now work over SSH. Customers with floating licenses can now configure an SSH connection
to the floating license server using the same configuration as for SSH connections to profiled JVMs.
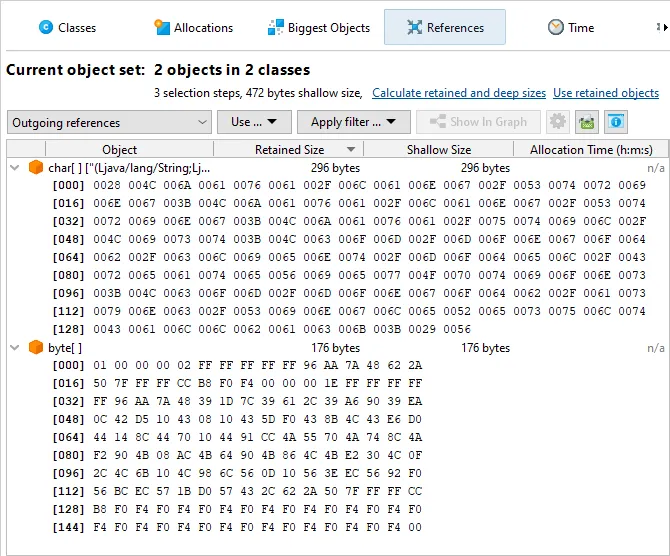
A tabular display of char and byte arrays has been added in the outgoing reference view of the heap
walker. Larger amounts of data can now be interpreted much more easily.
In addition, char arrays now show their string value right next to the instance.
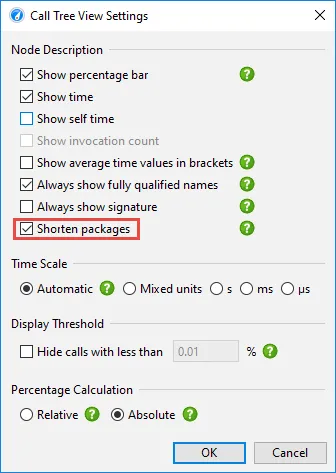
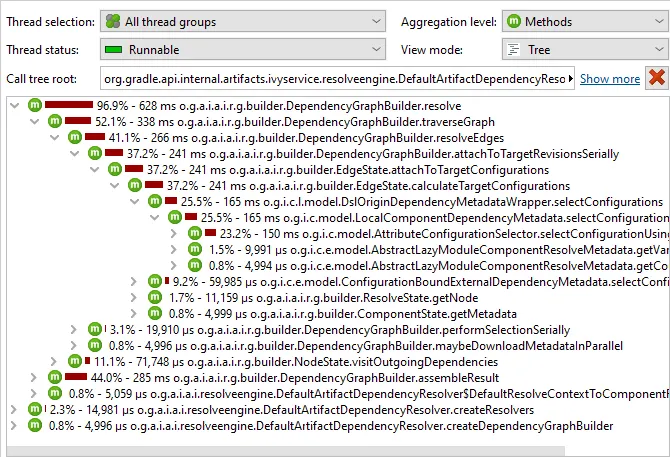
Shortened package names in call trees have been implemented. This optional setting is configurable
in the view settings dialog.
For code bases with deep package structures, the shortened package names reduce the amount of displayed text
and make it easier to focus on class and method names.
Improved support for IBM and OpenJ9 JVMs. This release brings feature parity with HotSpot JVMs in
a number of areas:
- Support for primitive data in the heap walker
- All inspections in the heap walker are now supported
- File and process probes are supported for IBM 8+ JVMs
- The "Save HPROF snapshot" UI action and "Create an HPROF heap dump" trigger action now generate PHD dumps
Support for profiling Java 12+. Also, all OpenJDK variants are now supported when starting sessions
from the JProfiler UI.
