JProfiler, the #1 Java profiler
for youfor your AI agentfor you


Why JProfiler?
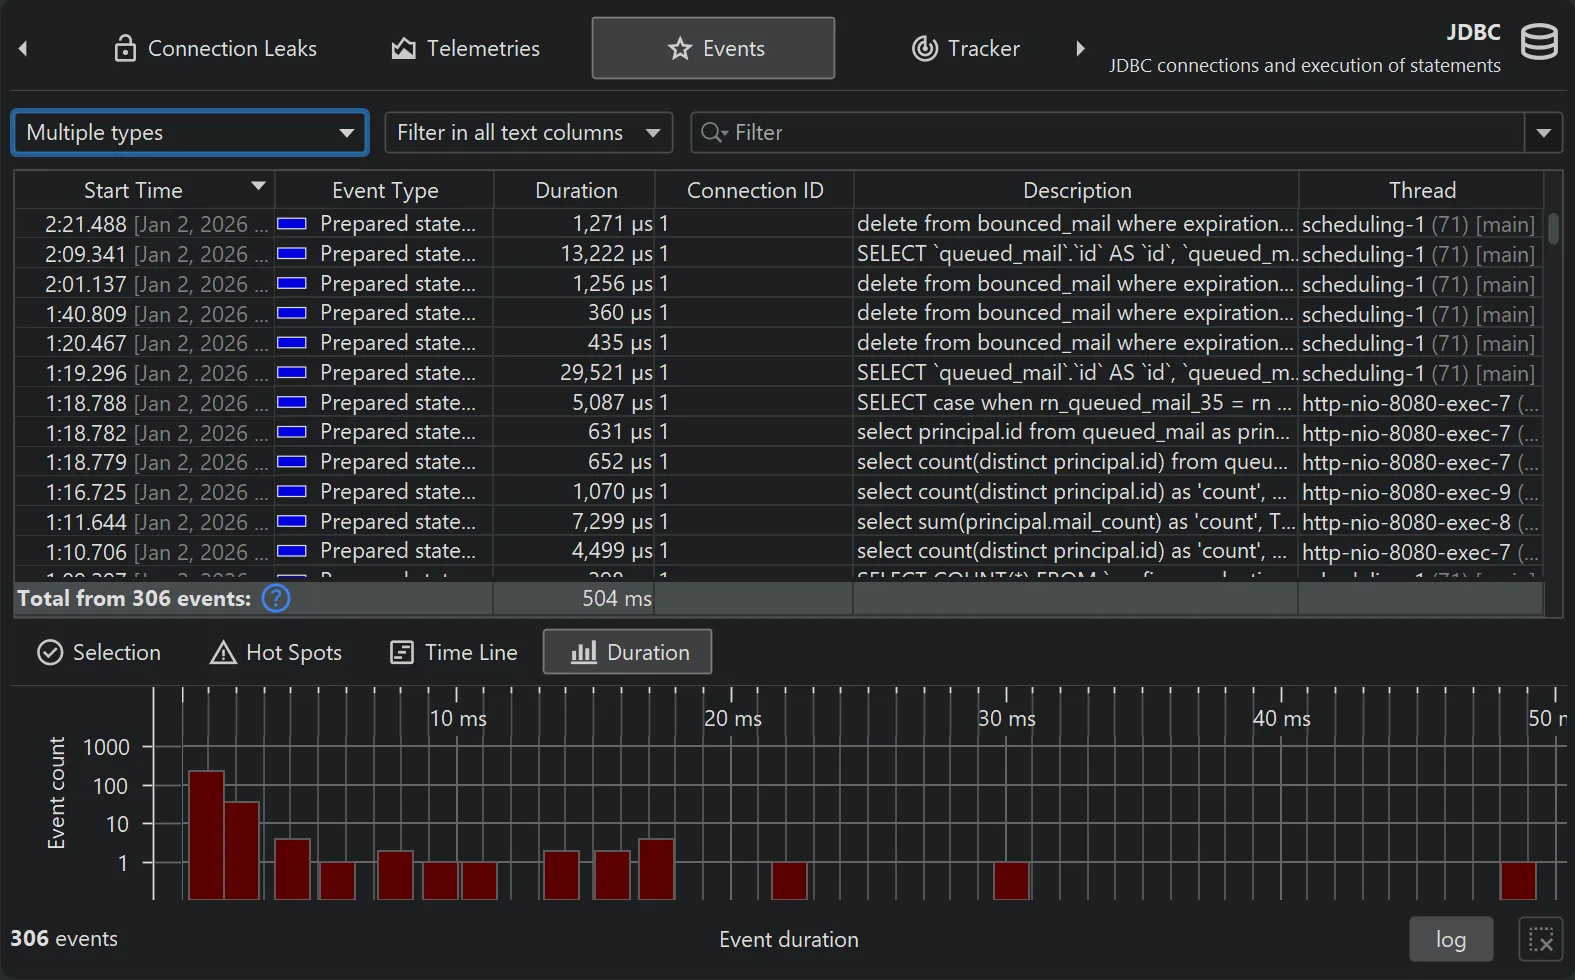
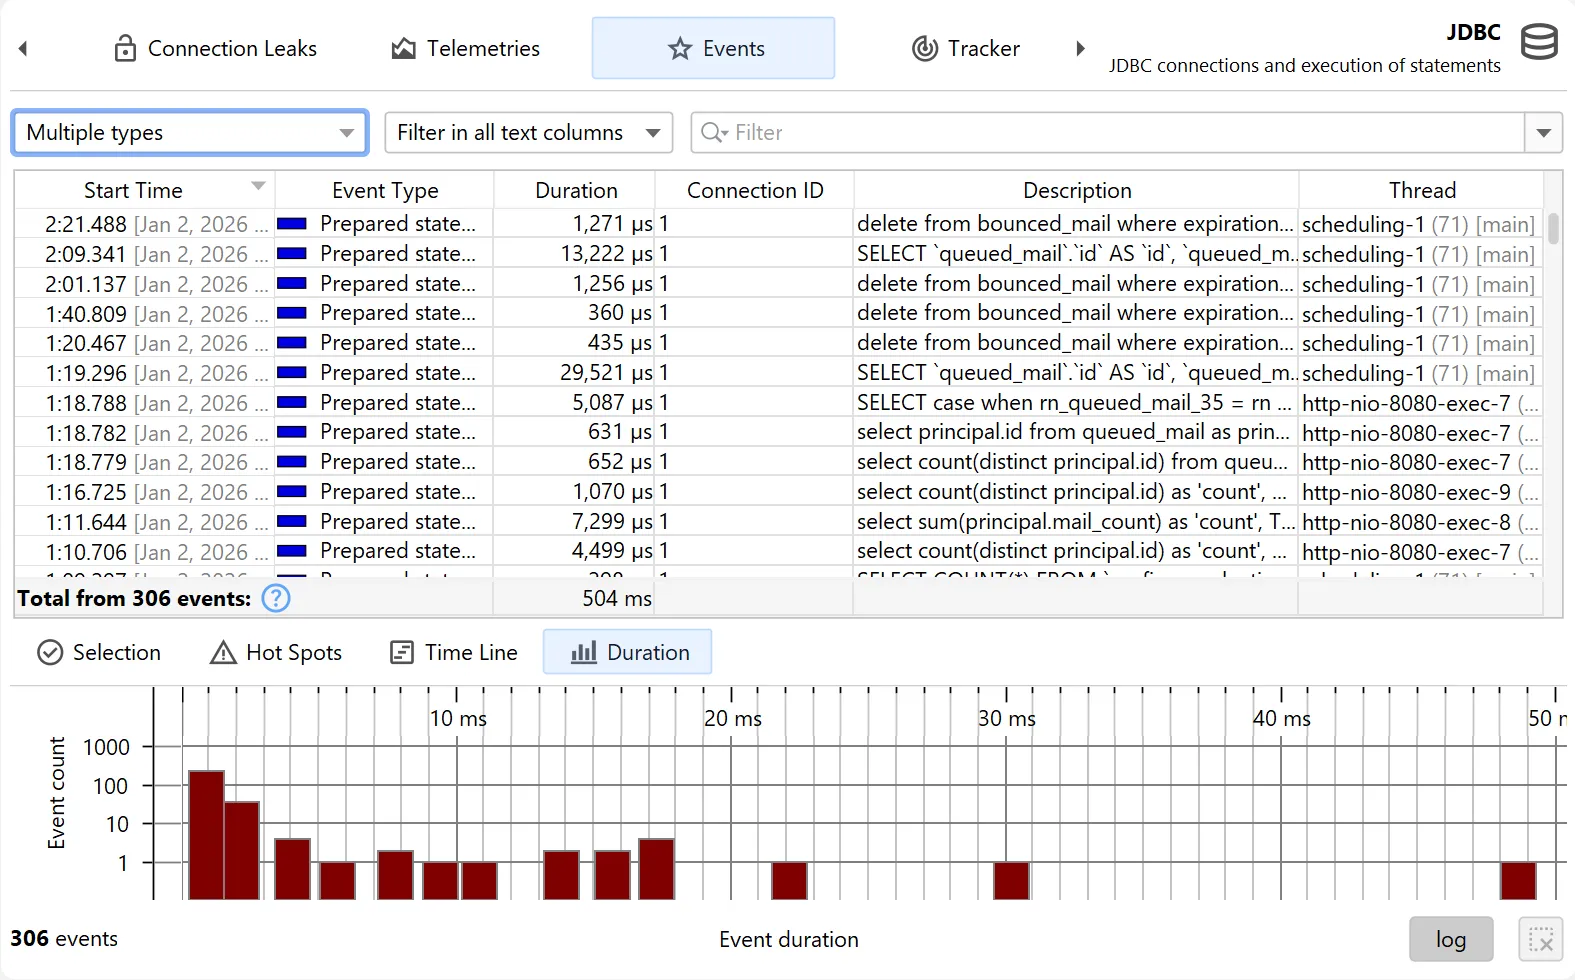
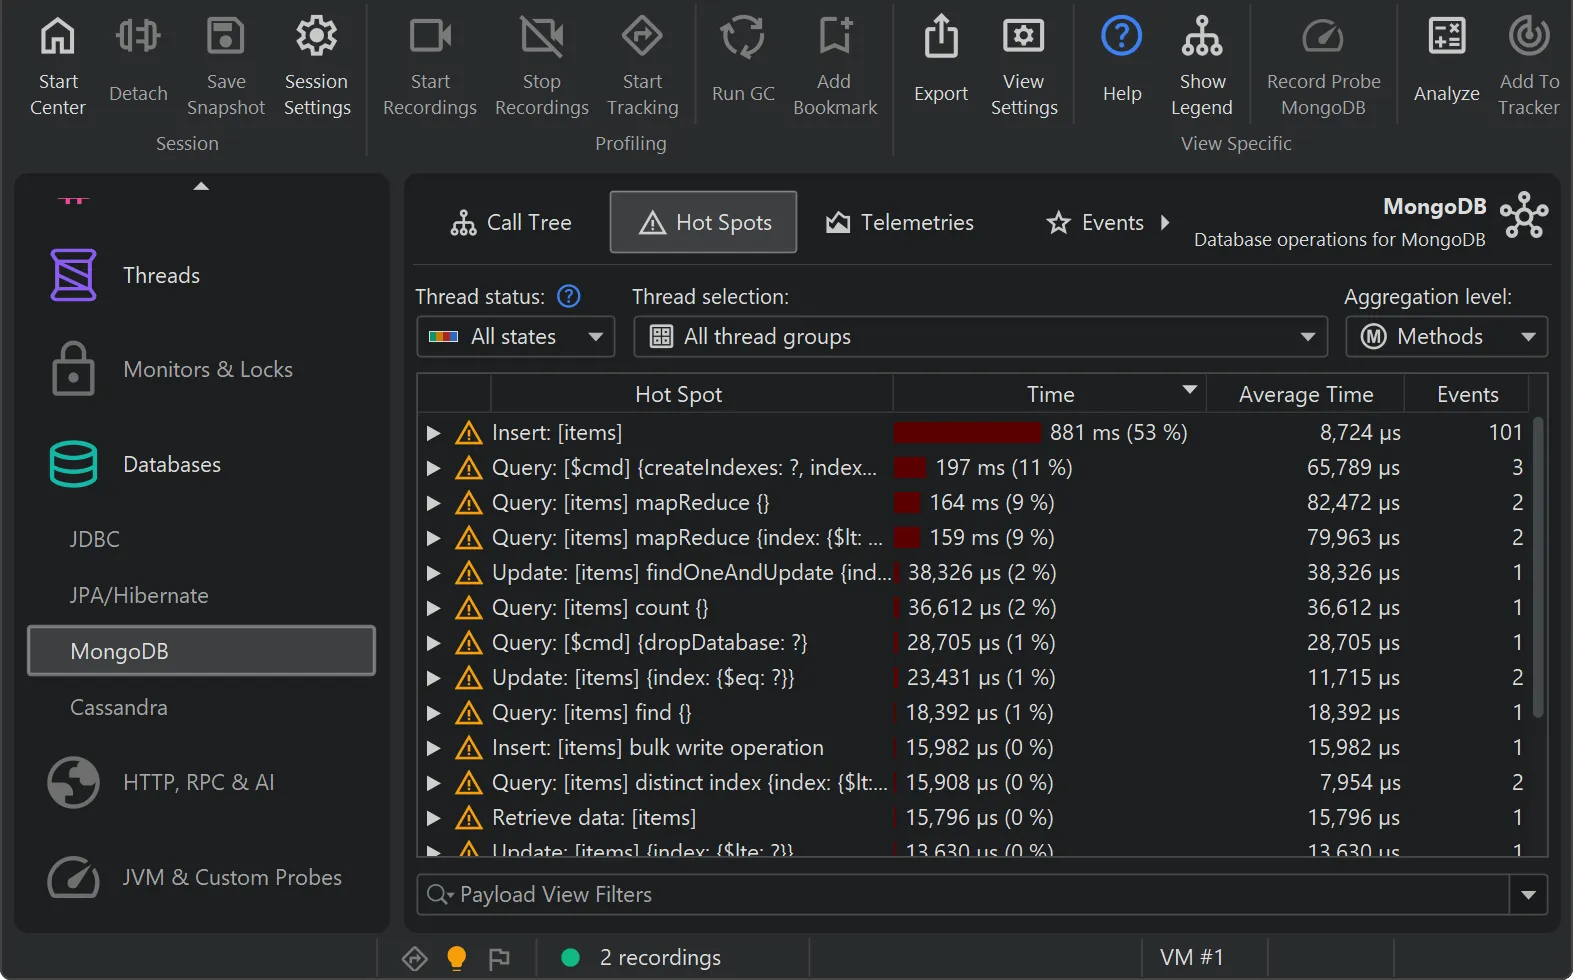
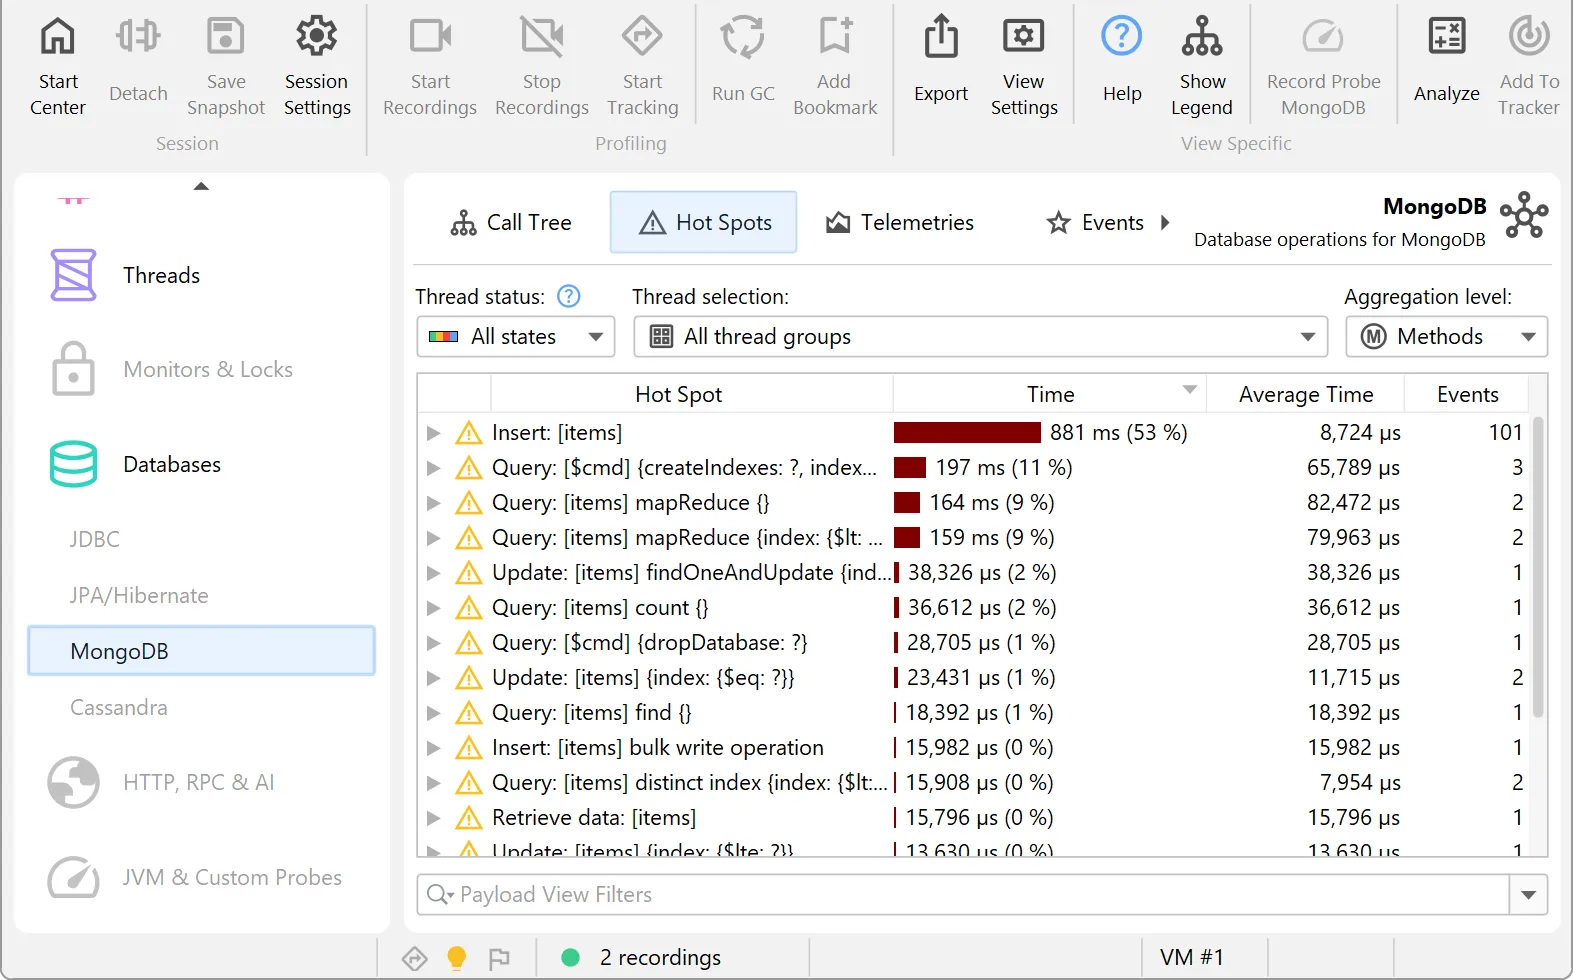
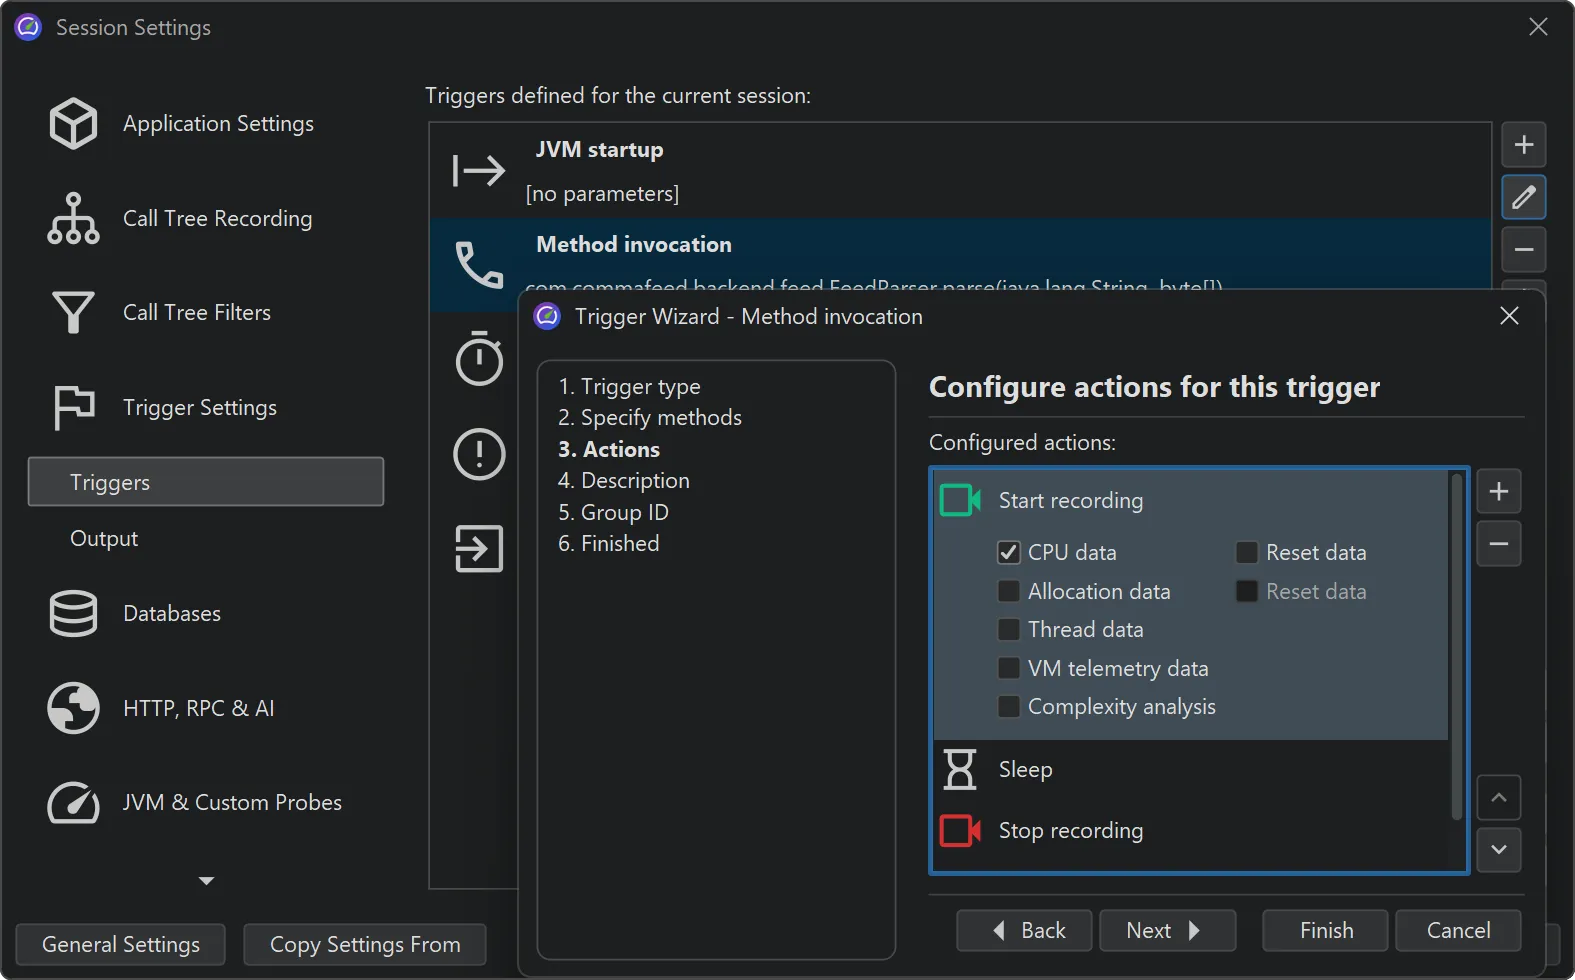
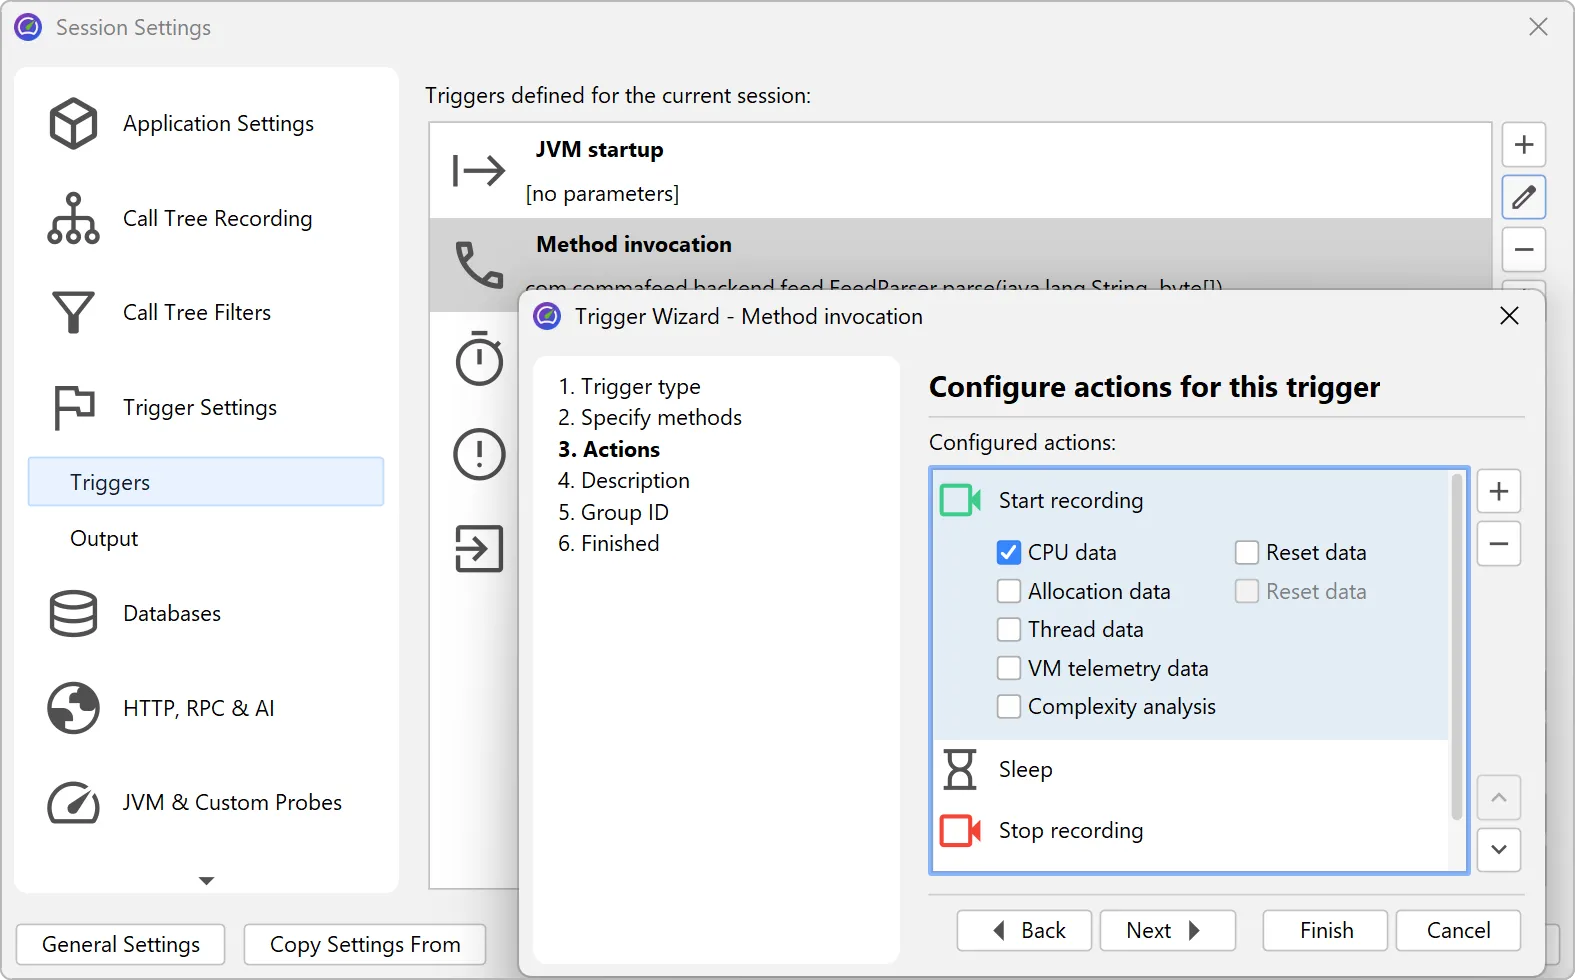
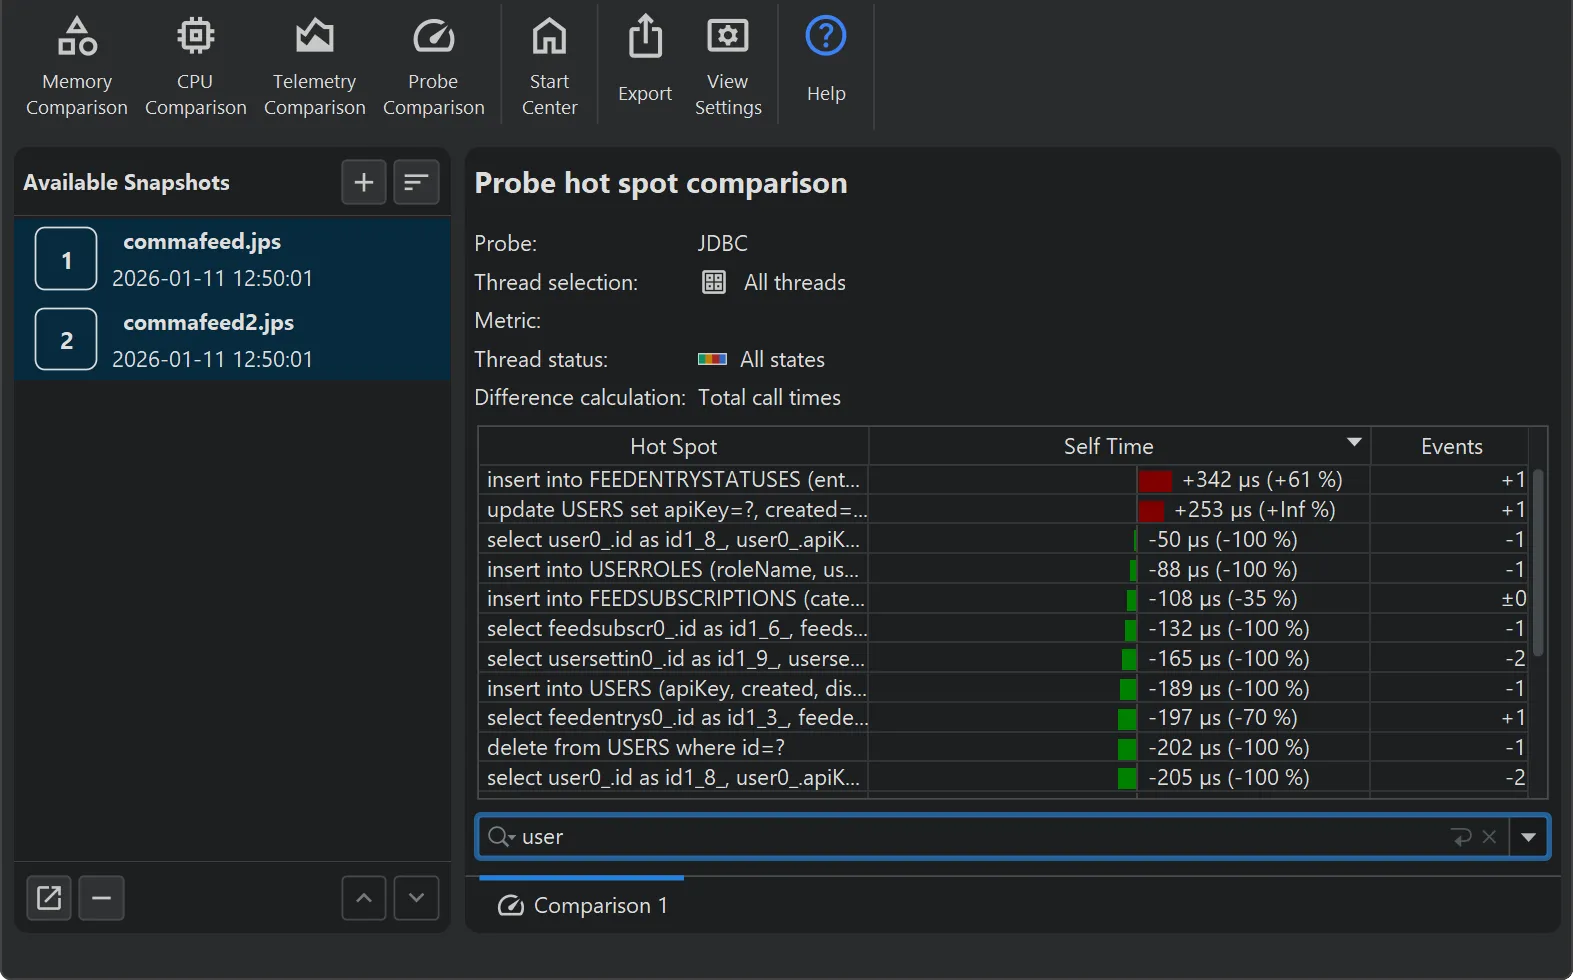
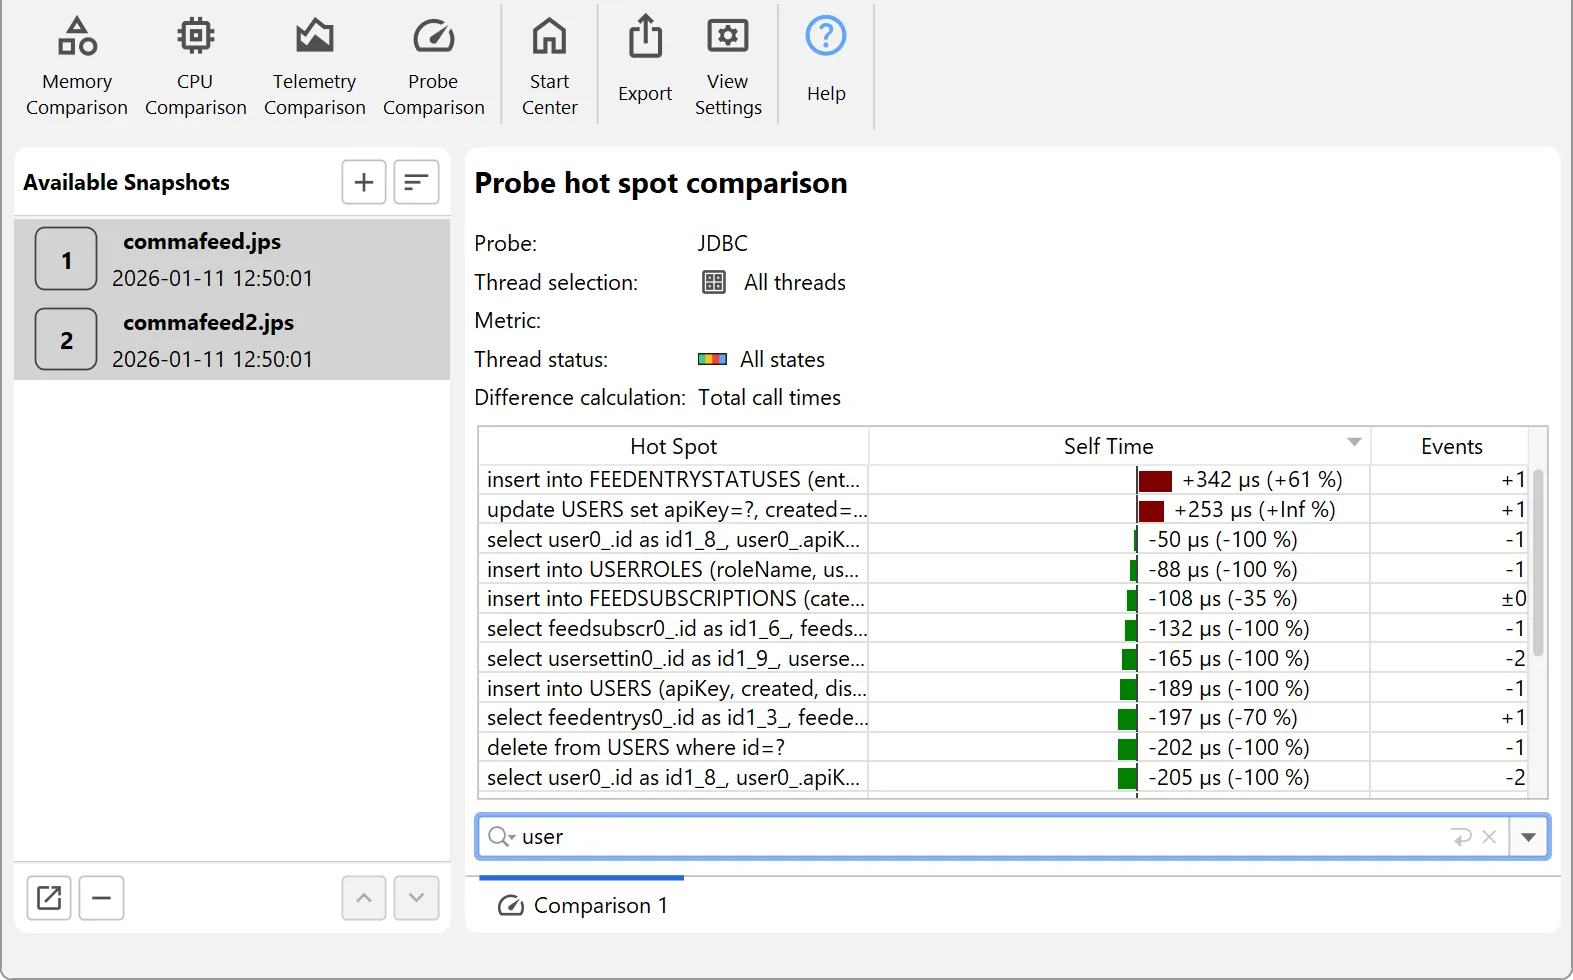
Deep insight into JDBC and JPA
Database calls are a primary source of performance issues. JProfiler helps you find and fix them in record time.
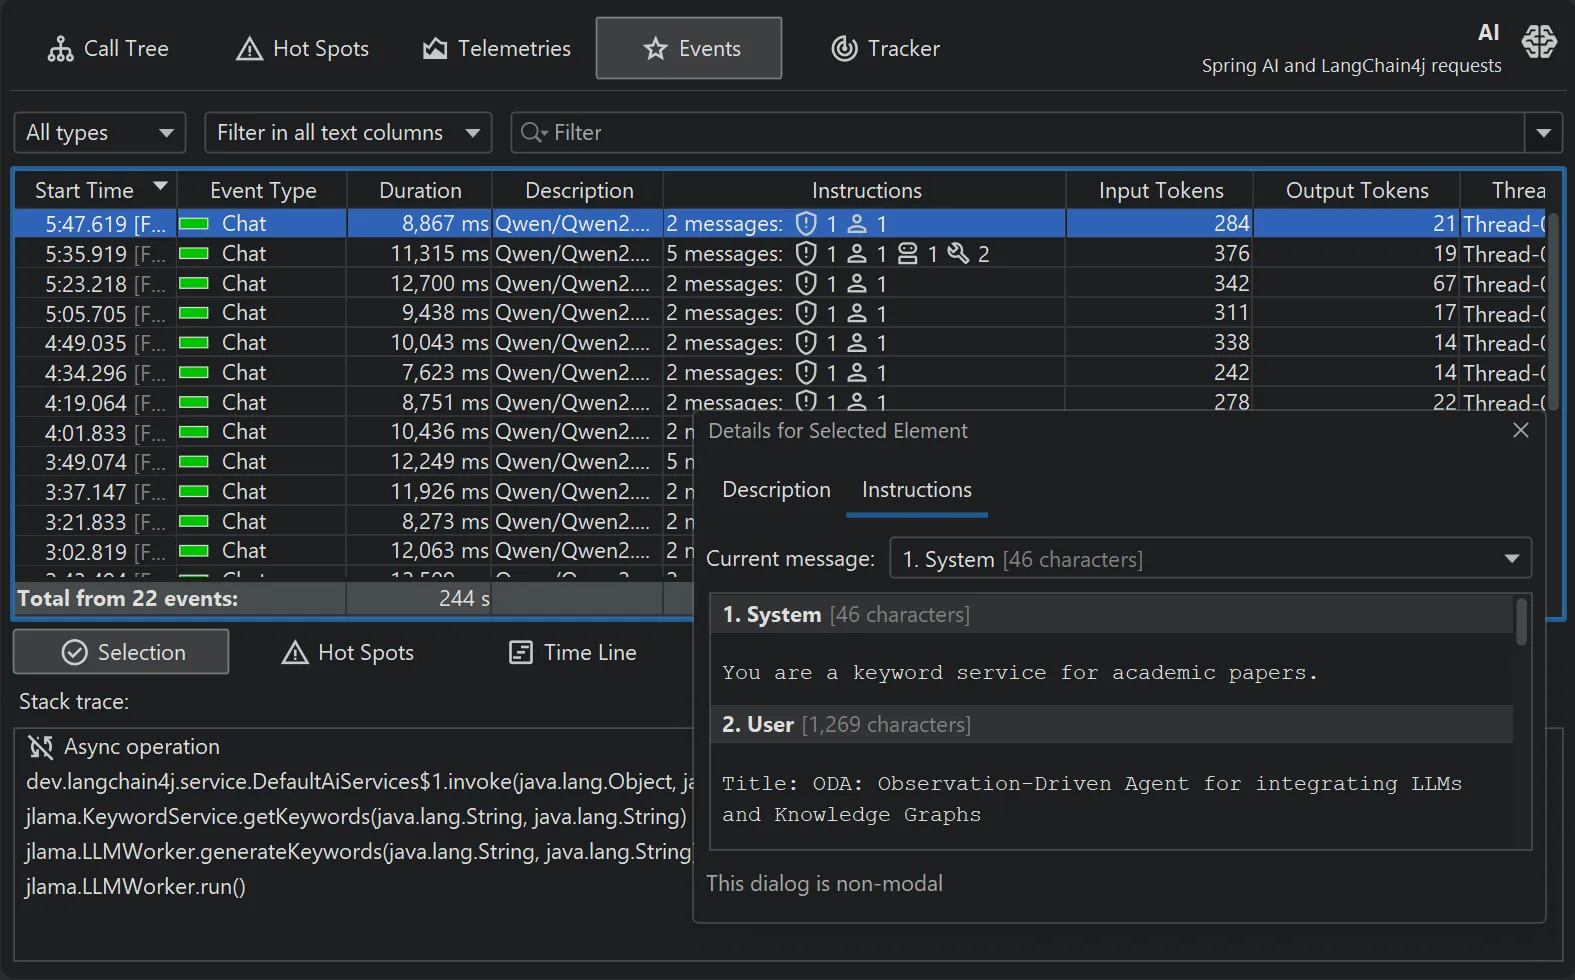
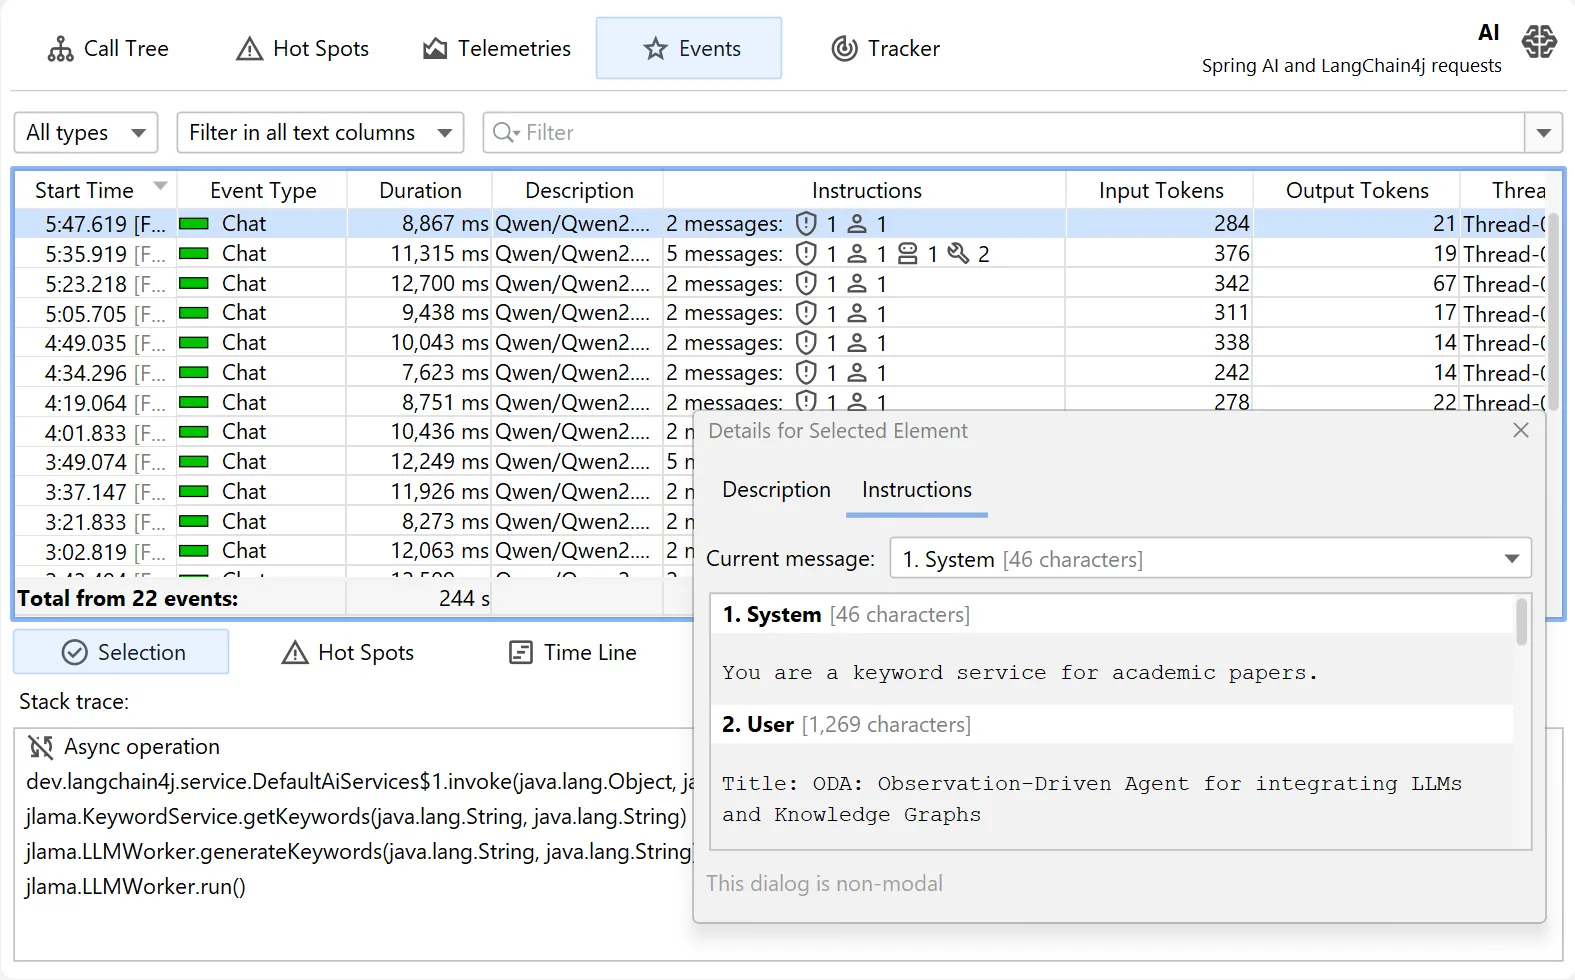
Top-notch AI observability
Analyze context-aware metrics for agentic applications. JProfiler helps you minimize costs and optimize LLM performance.
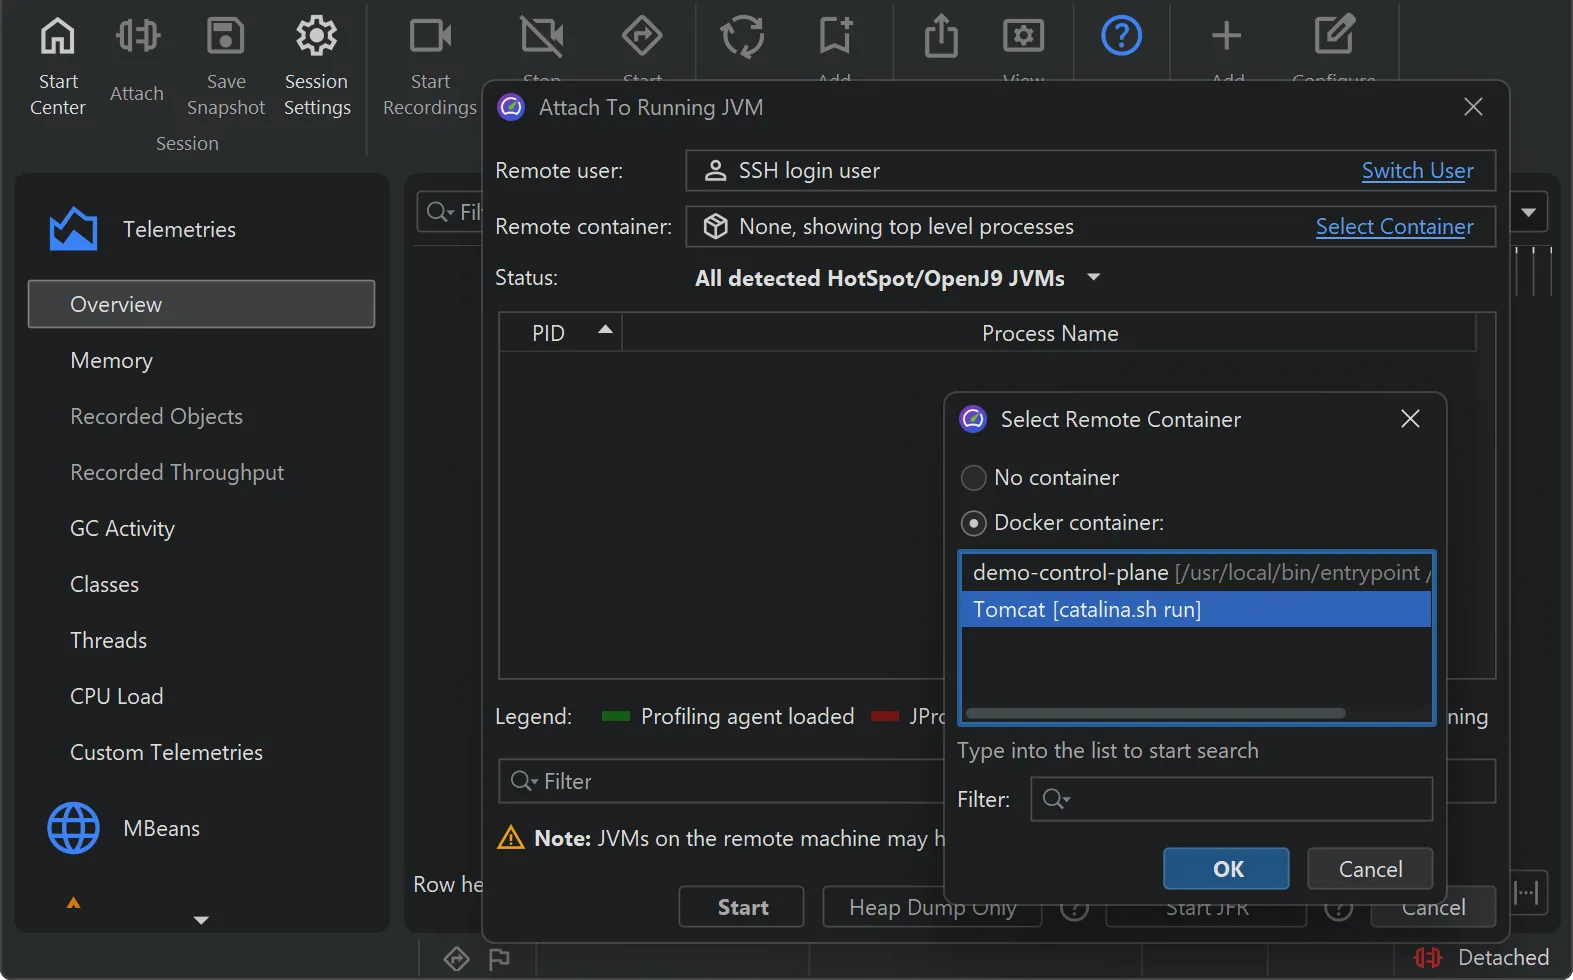
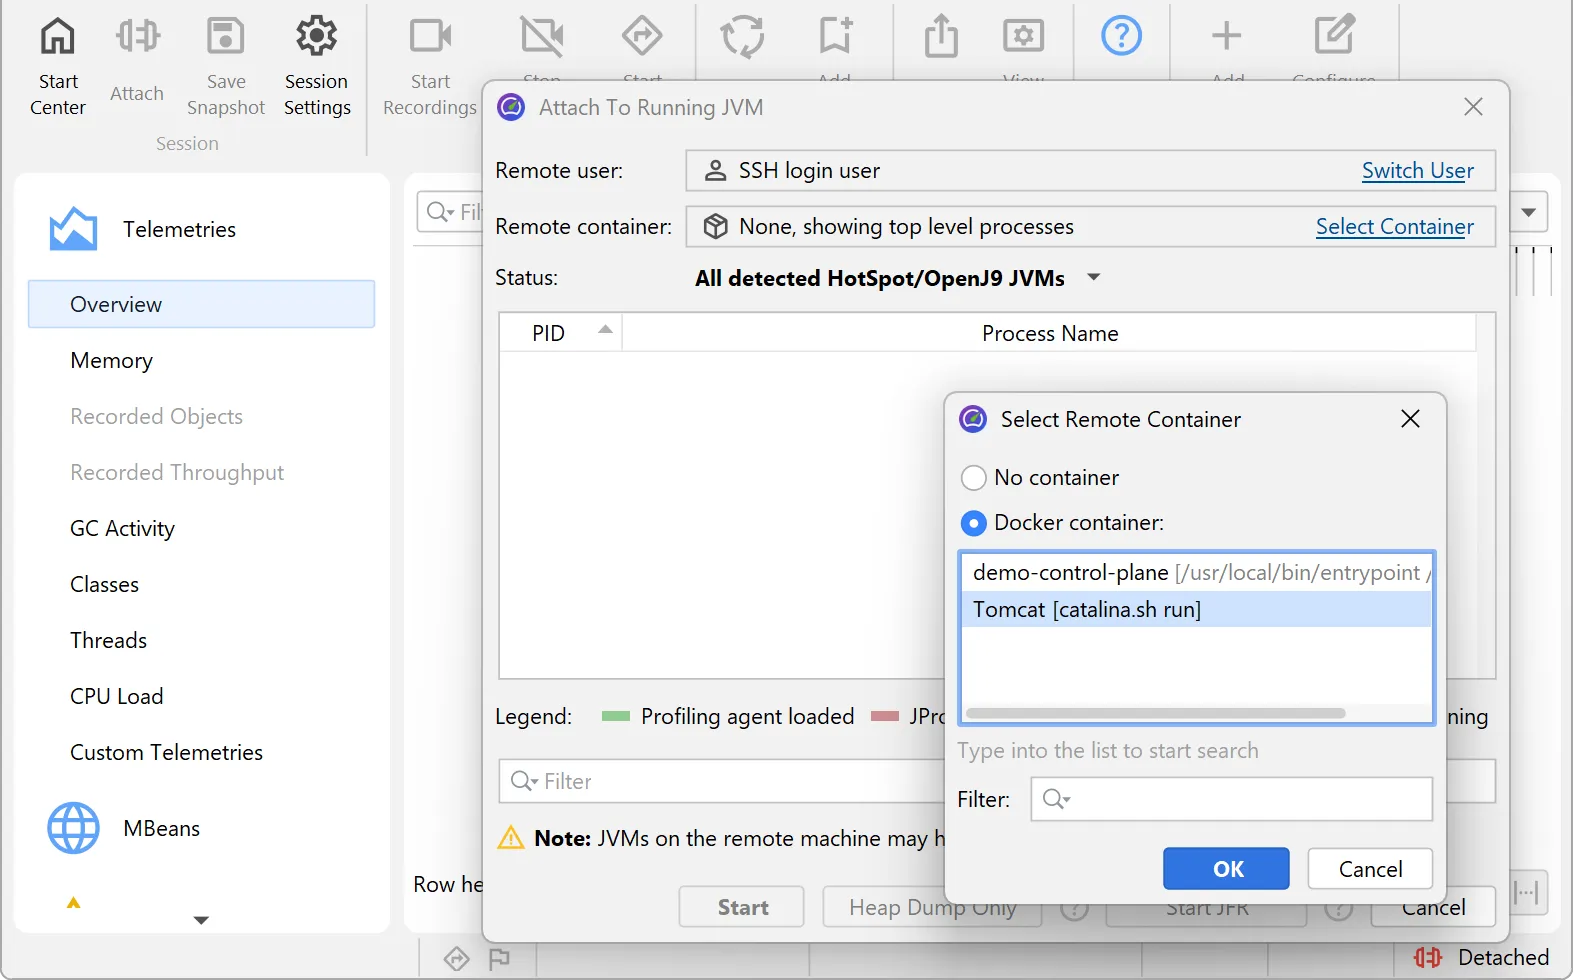
Built-in support for Kubernetes and Docker
Profiling JVMs in containers shouldn't be hard. Select them directly in the UI without any setup headaches.
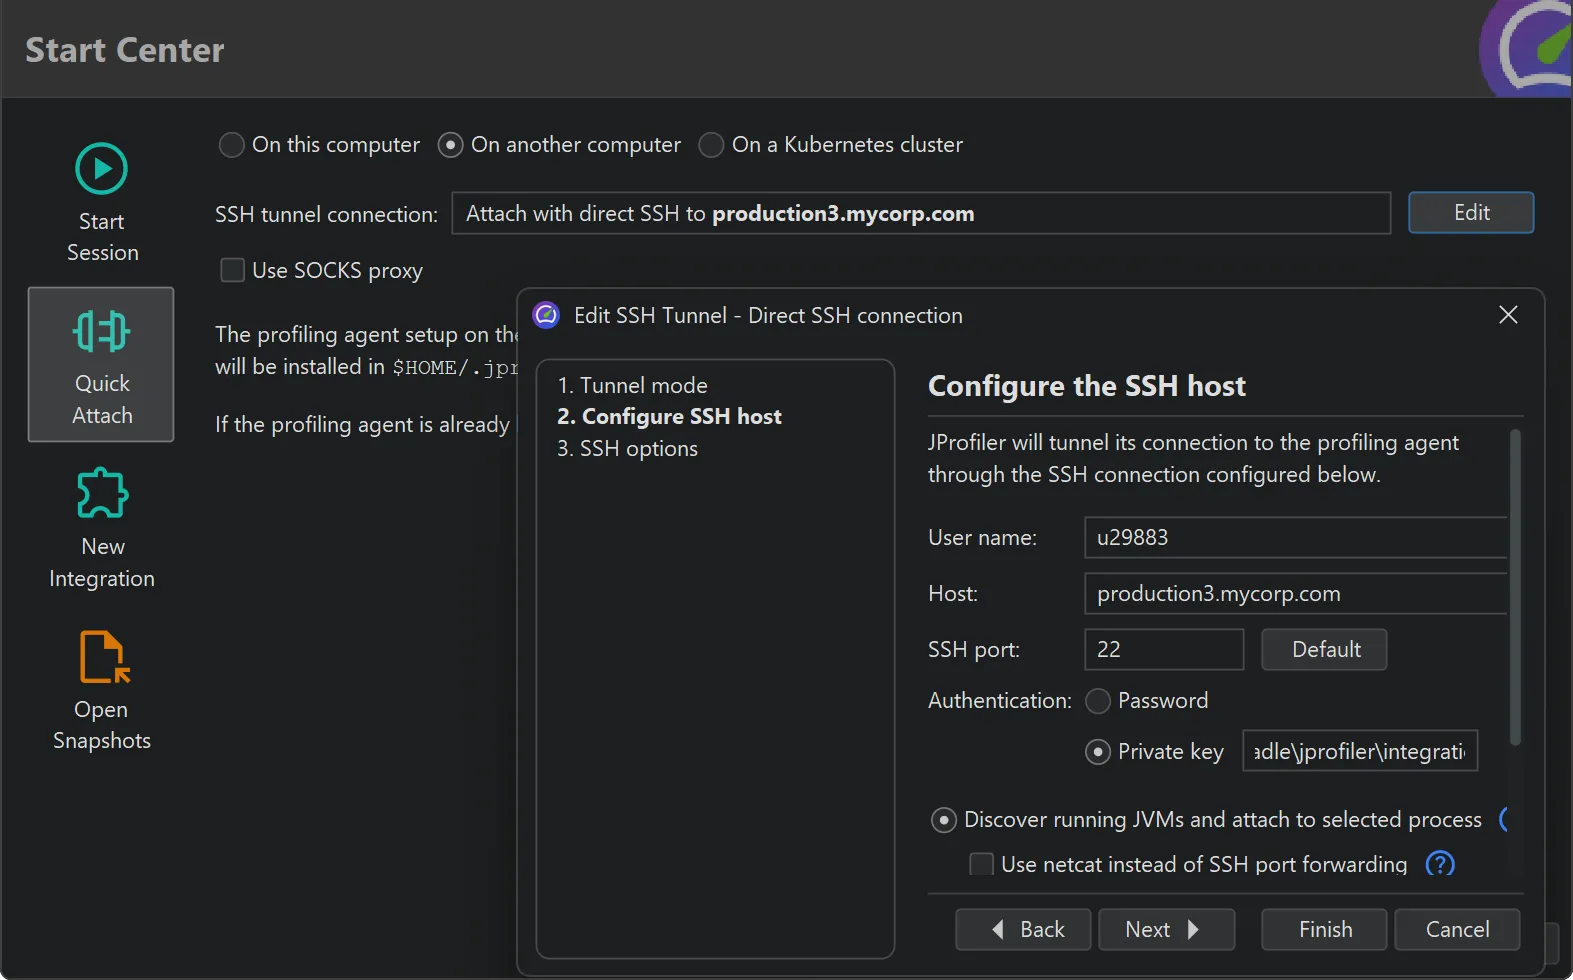
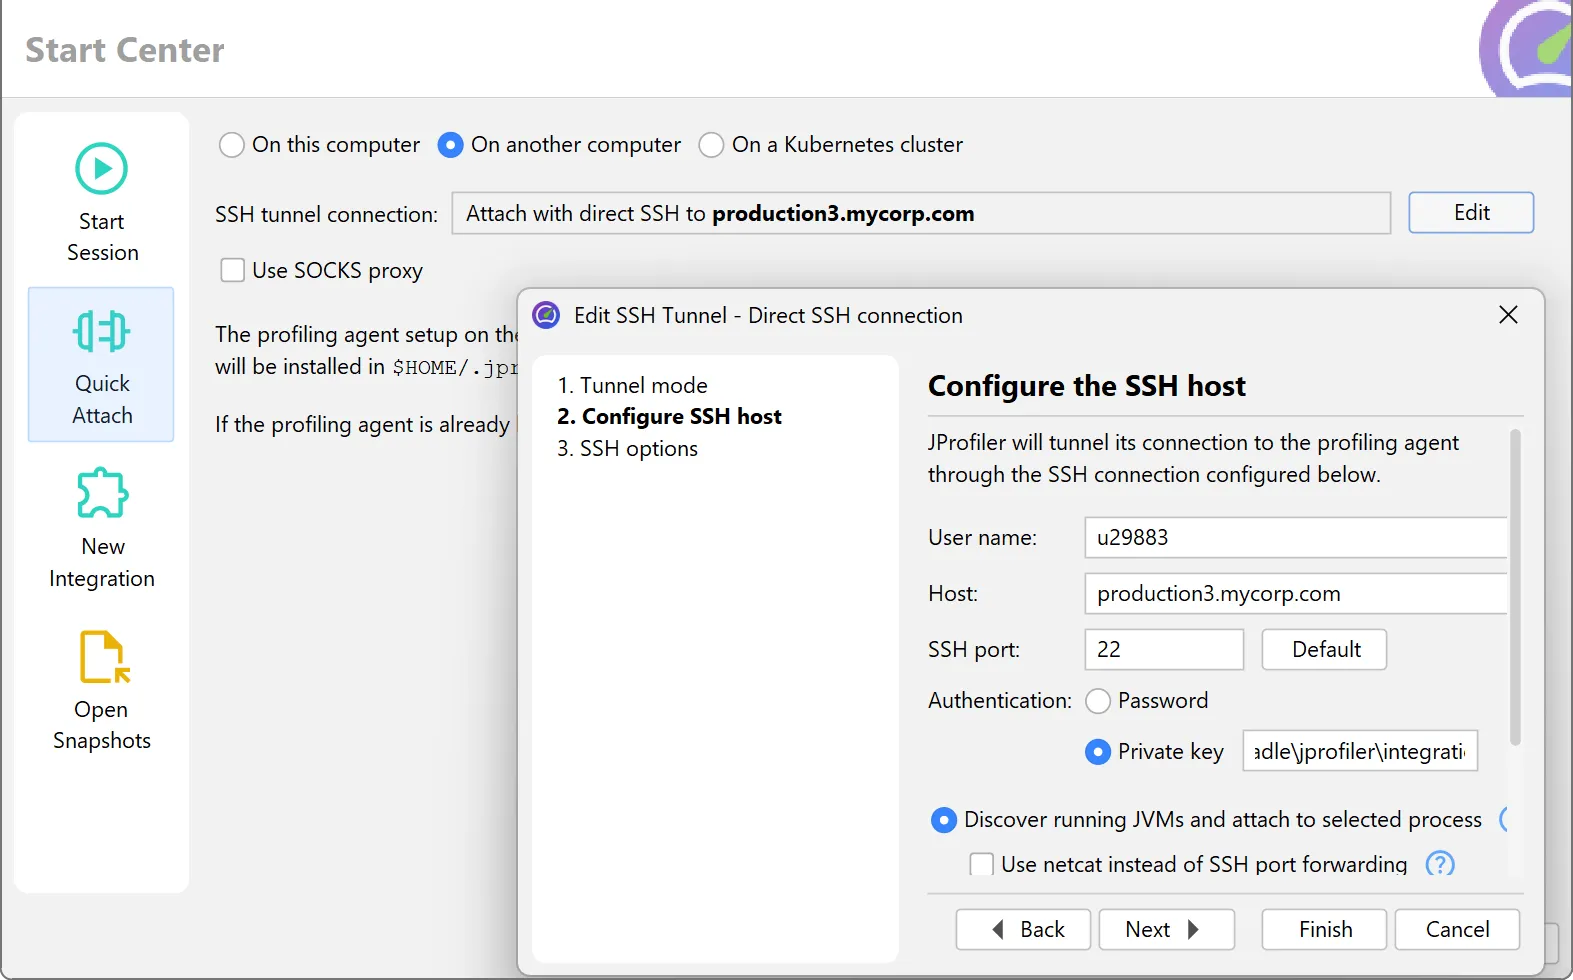
Zero-configuration remote profiling
Use SSH credentials to profile remote JVMs instantly. No remote installation or agent deployment required.
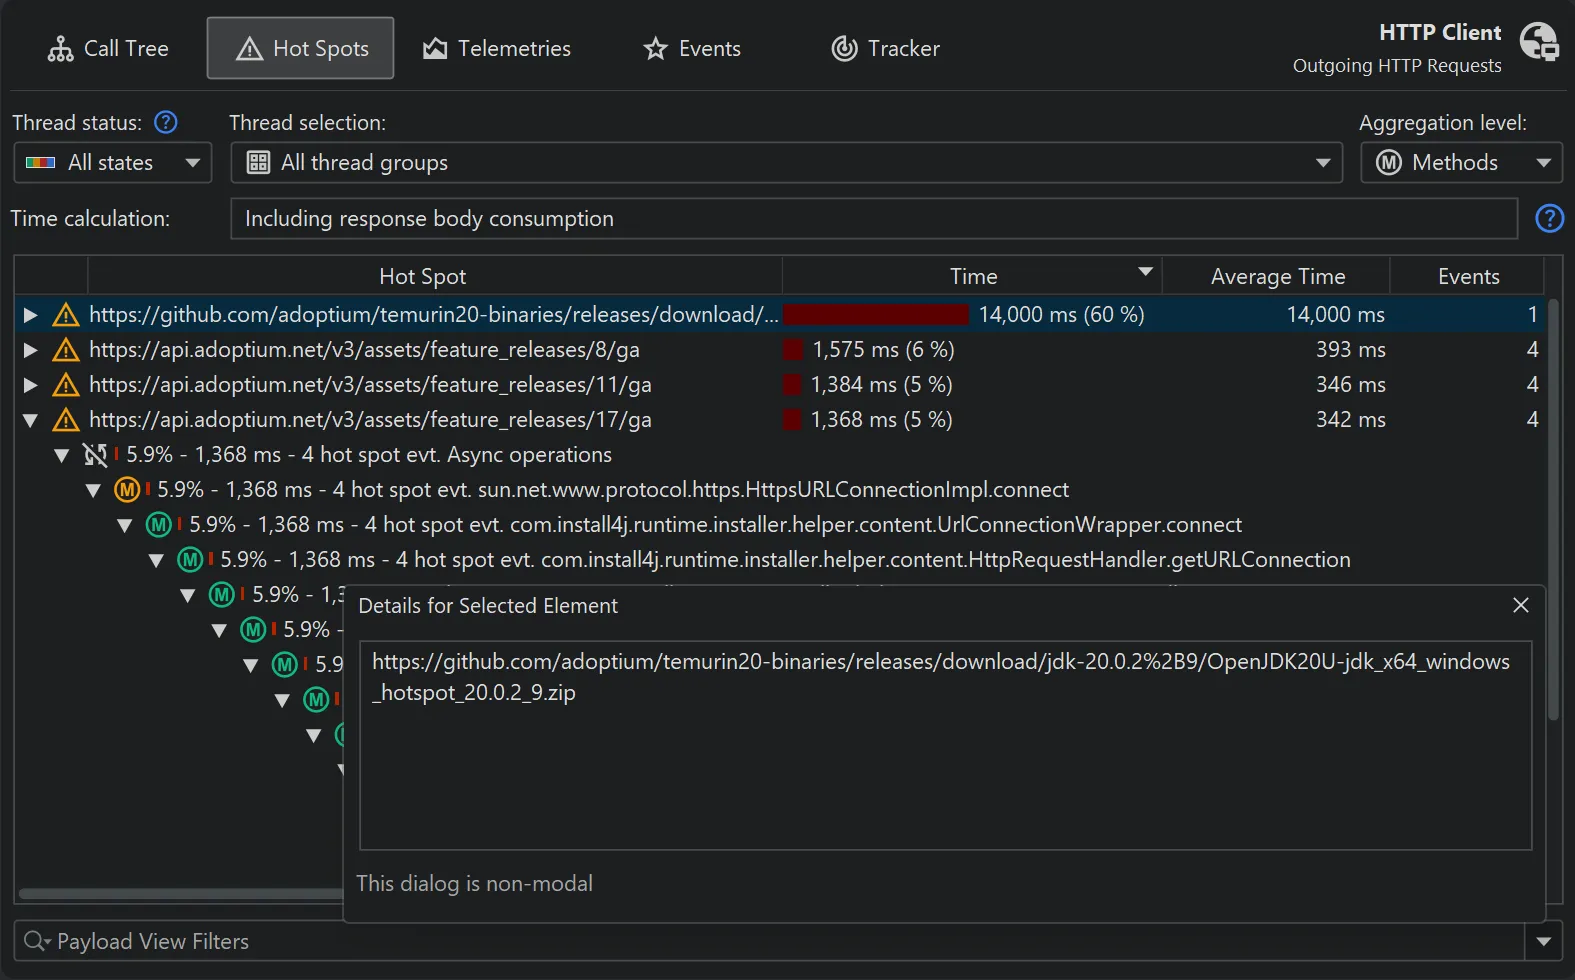
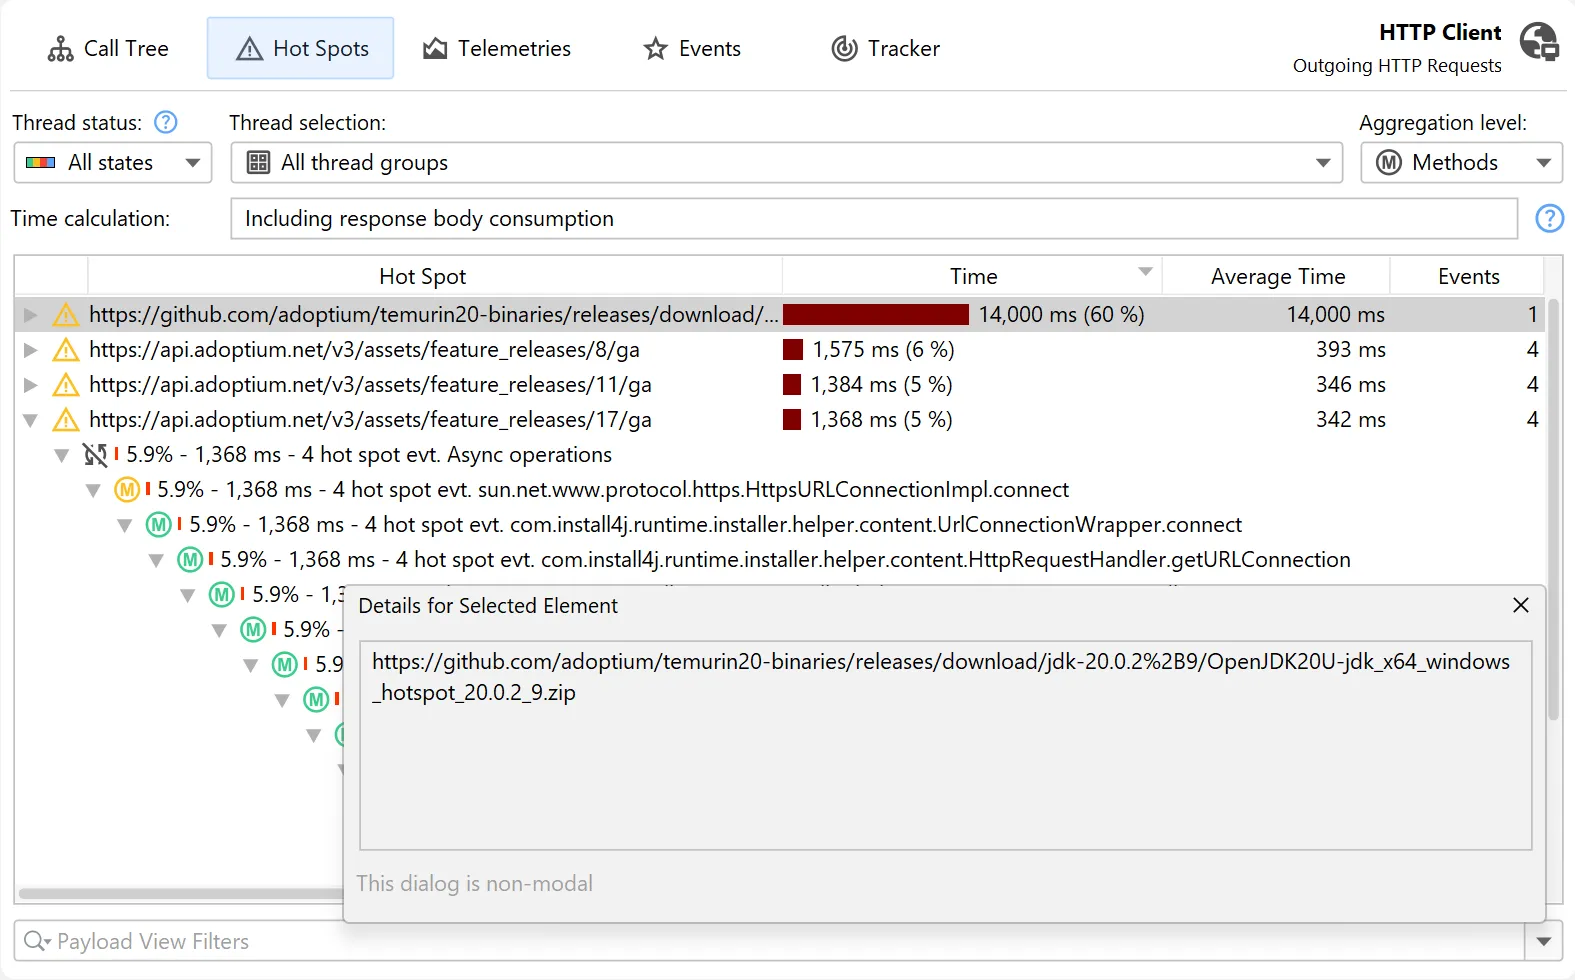
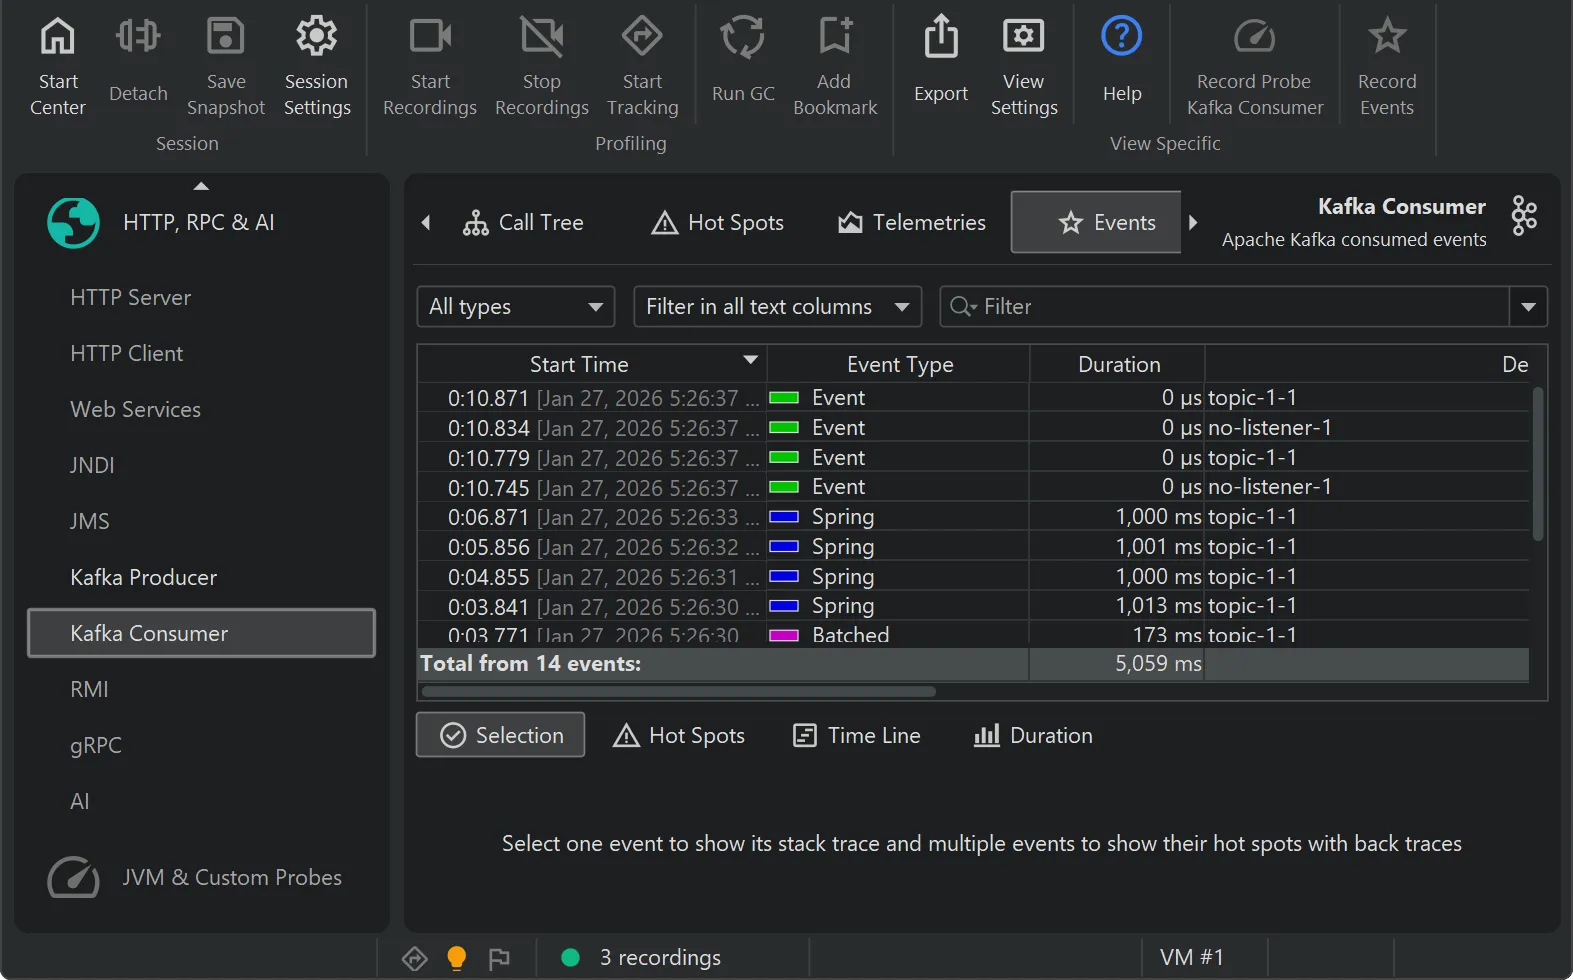
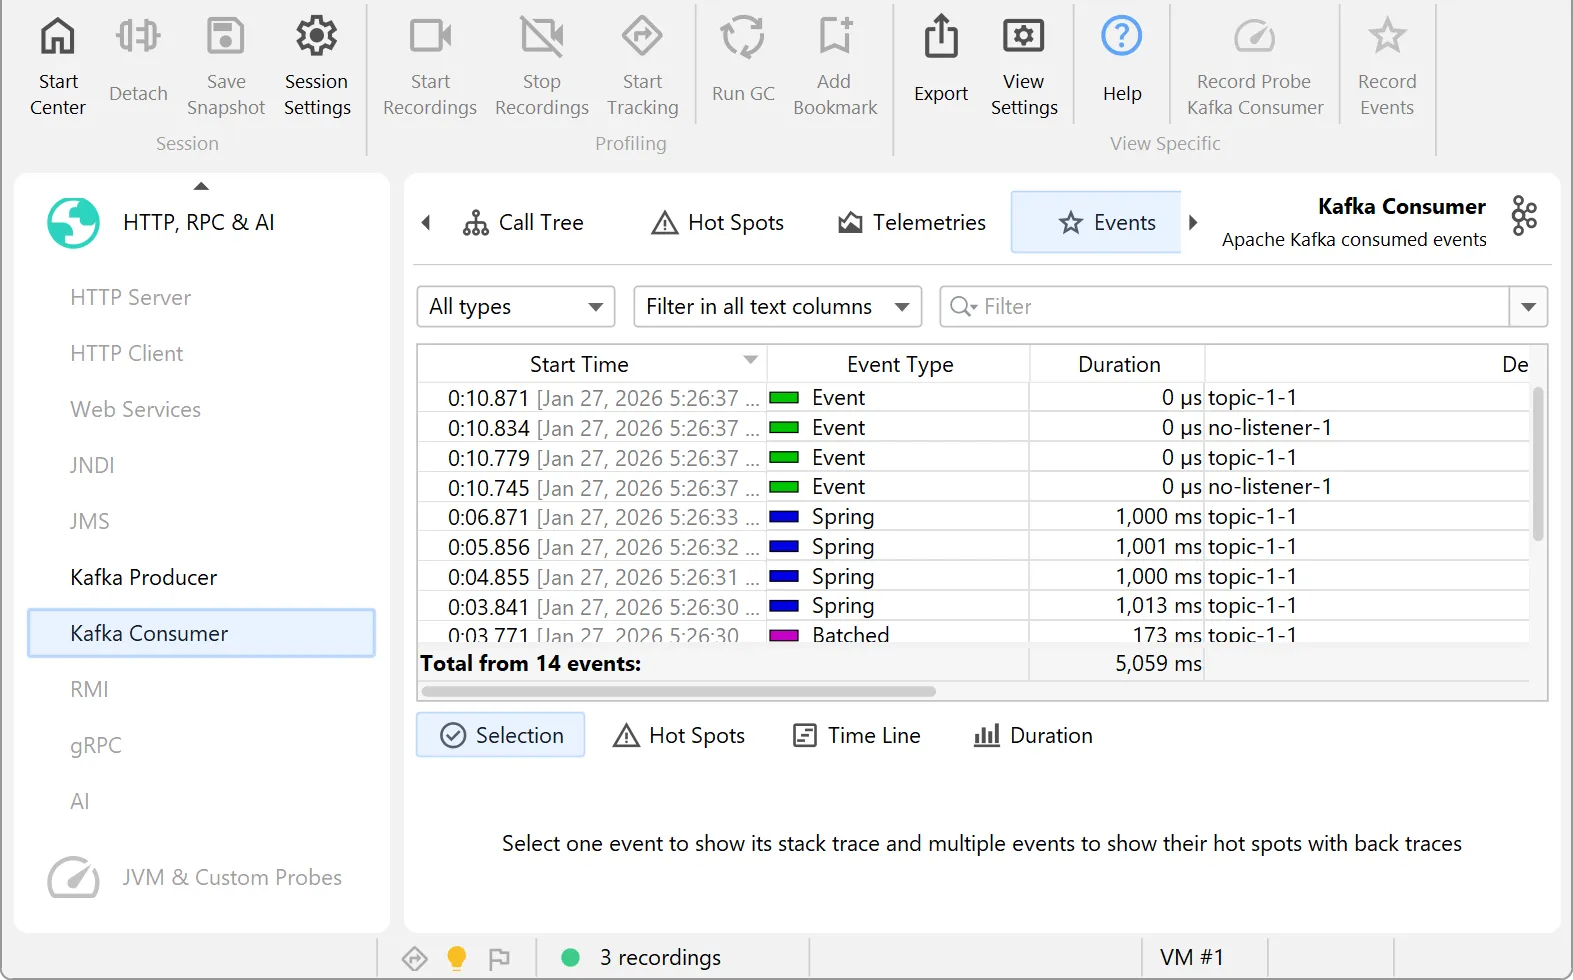
Advanced profiling of HTTP calls
JProfiler is the premier tool for analyzing HTTP performance, covering incoming and outgoing calls across JVM boundaries.
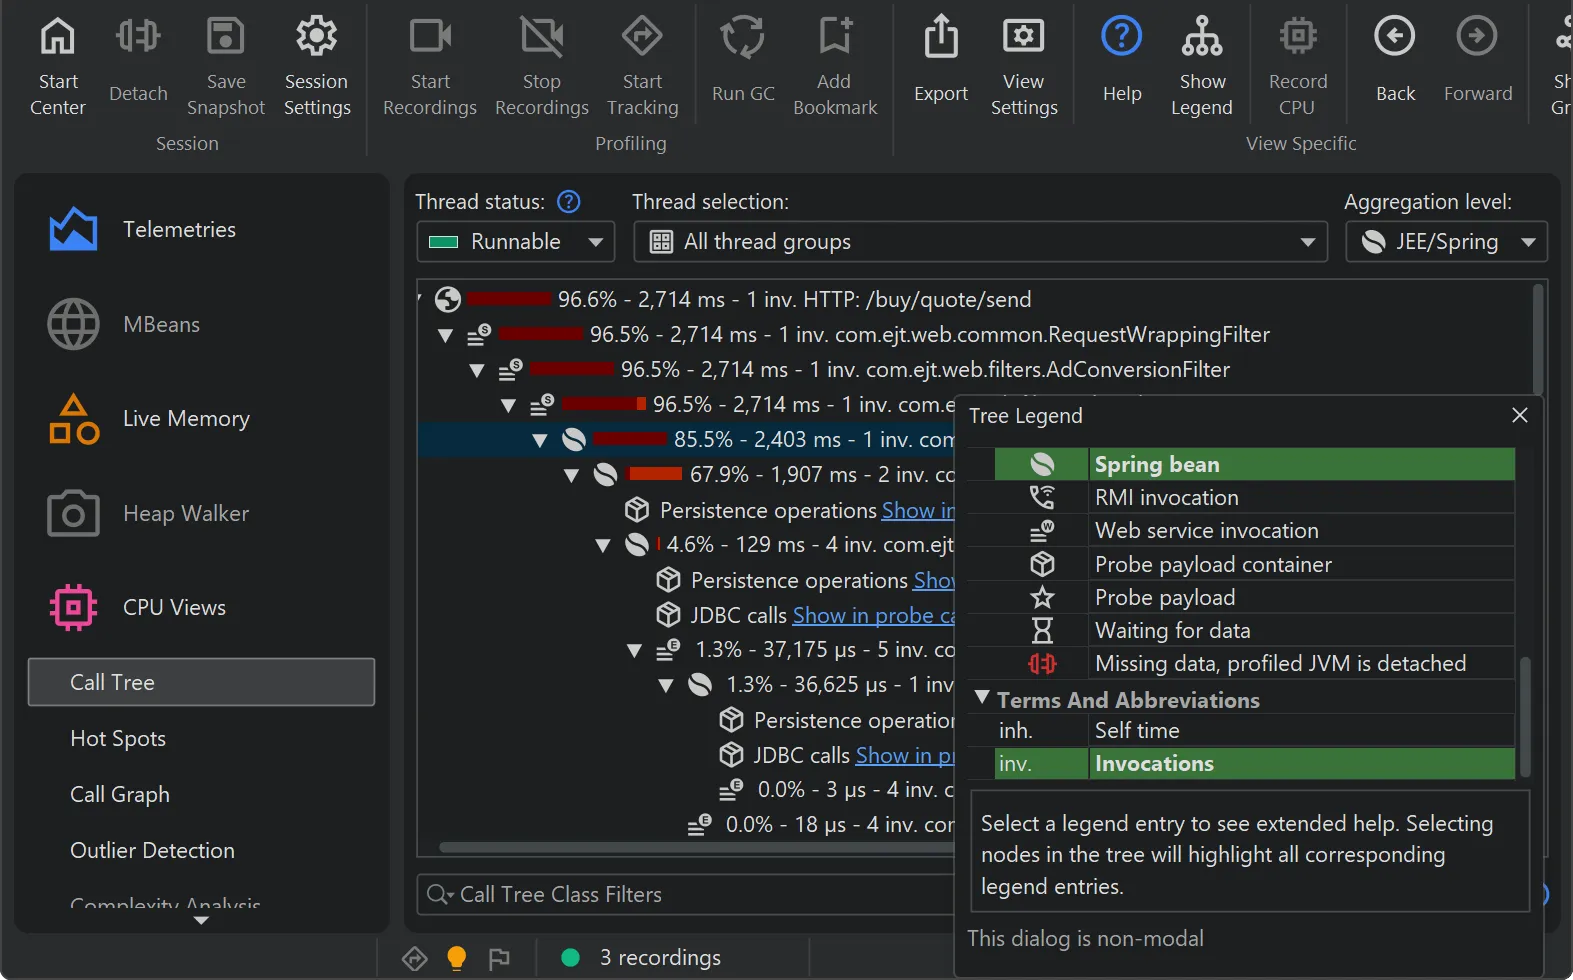
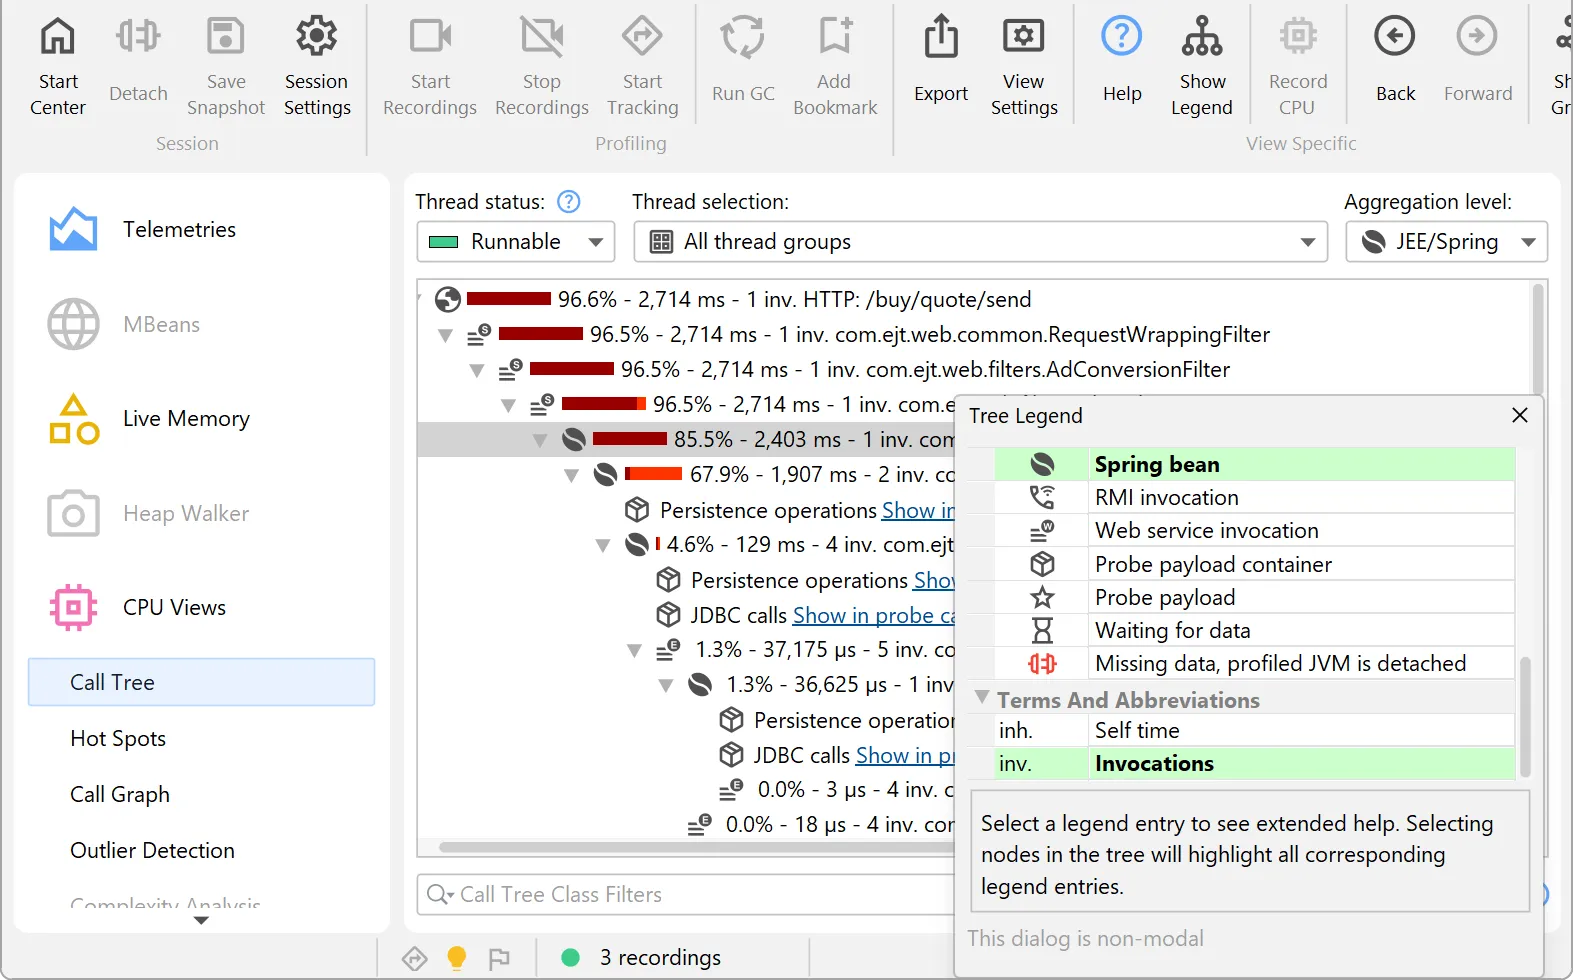
Excellent support for Spring and JEE
JProfiler understands Spring and JEE components, combining high-level context with low-level method call data.
... and much more
Save time and money with JProfiler
The cost of JProfiler is amortized incredibly quickly

Boost your productivity with the best profiling tool on the market. With JProfiler, you’ll be able to
- Focus your time on business logic
- Fix performance and memory issues where it actually matters
- "Do things that don't scale first, and improve later" — Paul Graham

Many of our customers have cut their cloud costs in half. With JProfiler, you’ll be able to
- Optimize resource usage
- Reduce data transfer rates
- Minimize CPU and memory requirements

When production goes down, every second counts. With JProfiler, you’ll be able to
- Profile live systems using powerful remote attach functionality
- Debug isolated cases in real time with advanced probes
- Analyze post-mortem snapshots like JFR and HPROF with the full power of JProfiler
What our users are saying
30000+ customers around the globe and 75%+ of all Fortune 500 companies use JProfiler.
“I recently evaluated JProfiler to identify some performance issues in an app I'm working on in my current consulting gig. I had been banging my head against the wall trying to get tools like VisualVM working against the IBM JVMs that the client uses and then I tried JProfiler. With the IDE plugin support it provides, it just worked and in the last day or so, I've been able to easily identify sources for all our major performance problems.”
“What started out as a search for a memory leak and a trial of JProfiler turned out to be the find of a year. Not only did we find our memory leak, we got started in only minutes of setup work, found slow background processes, reduced server costs and tuned our software to make it faster and more responsive. All this in just a week and a free trial. Given the results it seemed obvious we should add JProfiler to our tool chain!”
“I have evaluated lots of Java profilers. Yours is simply FAN-TA-STIC!. I love the 'live' views and auto-updated profiling information. JProfiler is also the only profiling tool to reliably report time spent in JNI calls, which is very valuable in our Java applications which are JNI intensive.”
Real profiling, right in your AI agent
The agents love it - their words, not ours.
“JProfiler's JDBC and persistence probes revealed a pattern that timing alone would never surface: redundant per-entry database checks firing on every refresh cycle, even when nothing had changed. Without that probe data, I would have optimized the wrong thing entirely.”
“The JProfiler MCP server gave me a direct path from a concrete Gradle test to actionable hotspot data inside the code I was changing. I could trace real method-level costs through the call tree, separate parser work from benchmark overhead, and choose an optimization based on evidence instead of intuition.”
“Using the JProfiler MCP server was a game-changer for our Solr performance analysis. It allowed us to effortlessly profile a JVM running inside a Docker container without any complex setup. With instant heap dumps and targeted views, we quickly identified a 151 MB cache issue that would have otherwise taken hours to diagnose.”
Watch screencasts
We're publishing screencasts for JProfiler in our blog for important use cases and for new features.