perfino 4.0 introduces the following notable new features:
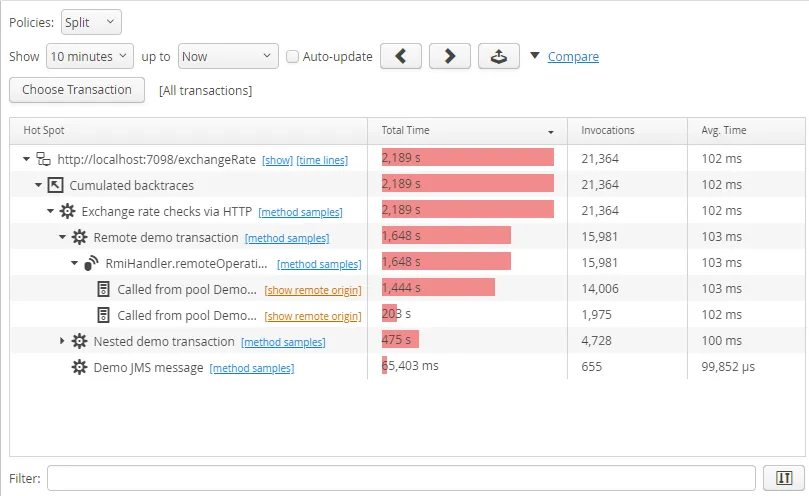
An HTTP probe has been added that measures all outgoing HTTP calls and shows them as a probe hot spots view
Both synchronous and asynchronous calls are measured. The supported HTTP clients are:
- java.net.URLConnection
- Java HTTP Client (Java 11+)
- Apache HttpClient 4.x and 5.x
- OkHttp 3.9+ and 4.x
- Jersey (JAX-RS) Async Client 2.x
- RestEasy Async Client 3.x and 4.x
- CXF Async Client 3.1.1+
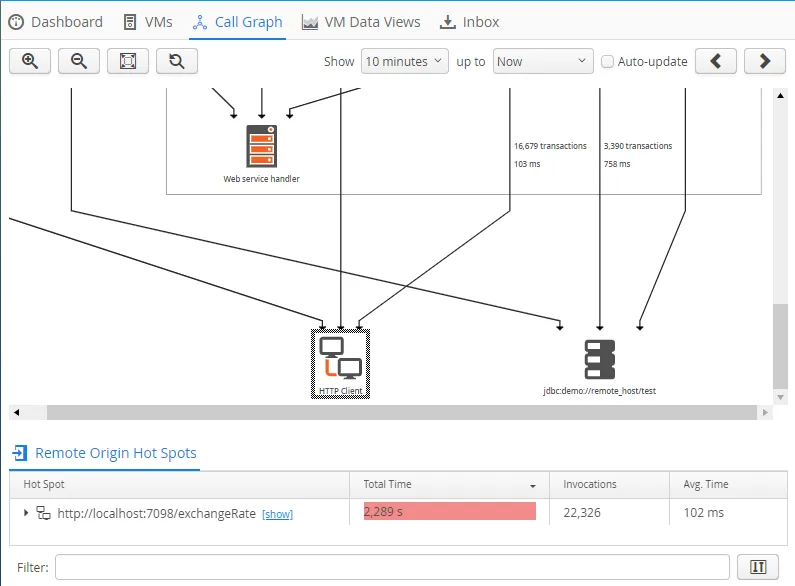
In the call graph, outgoing HTTP calls are shown with their own node, just like other probes.
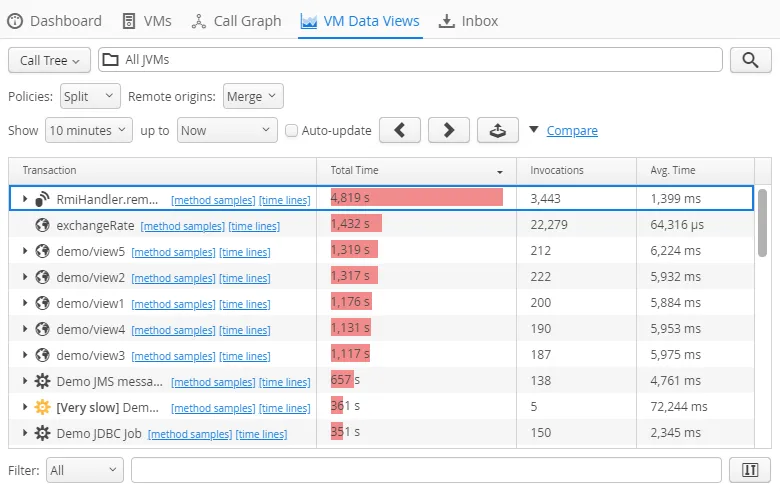
All HTTP calls are tracked between VMs that are monitored by perfino, so the call tree view and the
call graph will show links between those VMs. In the call graph, you can inspect the involved transactions
on both sides by selecting the appropriate edge.
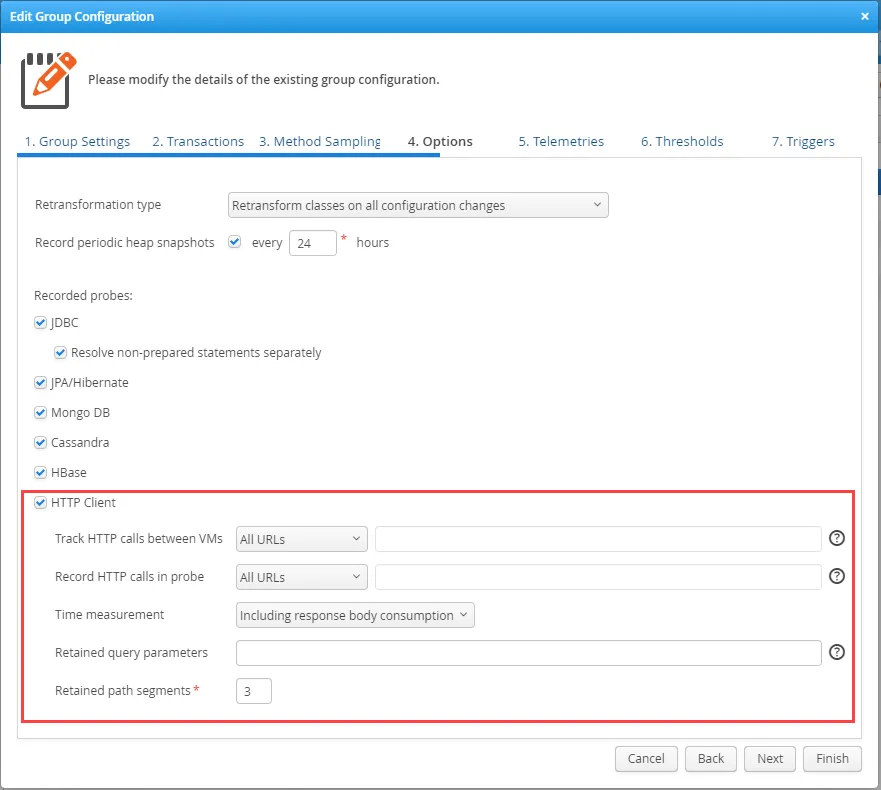
The probe configuration allows you to select which URLs are tracked and which are recorded for the probe.
For example, you may want to prevent perfino to add the tracking HTTP header to calls that go to external
services and you may not want to record tracked HTTP calls for the probe.
By default, only a limited number of URL path segments are retained by the probe and query parameters are
discarded. This strategy reduces the load on the database and provides better hot spots. To tune the
recording, you can decide to retain more path segments or to retain selected query parameters.
Finally, the time measurement of HTTP calls may include the entire time while the response body is being
consumed or stop after the initial response is received.
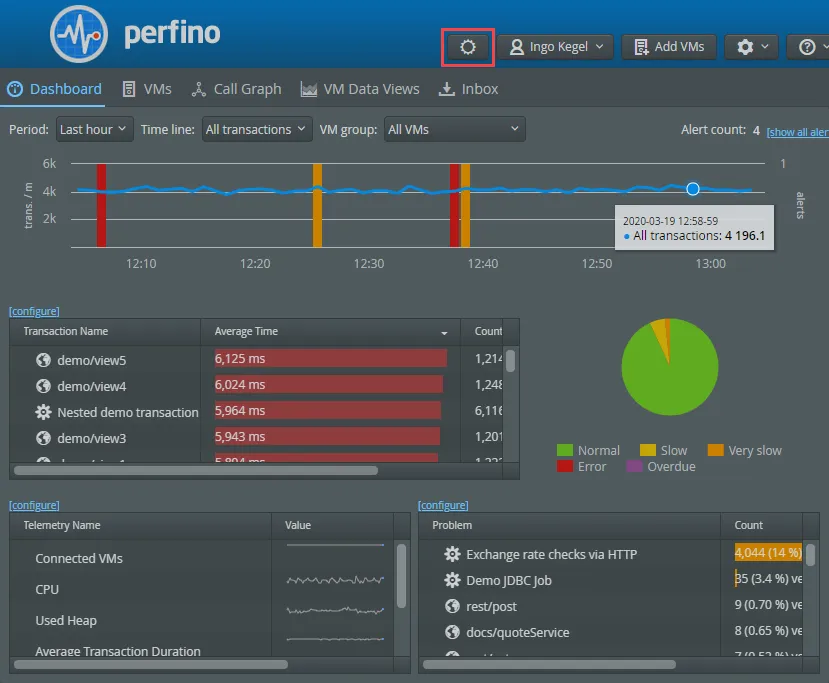
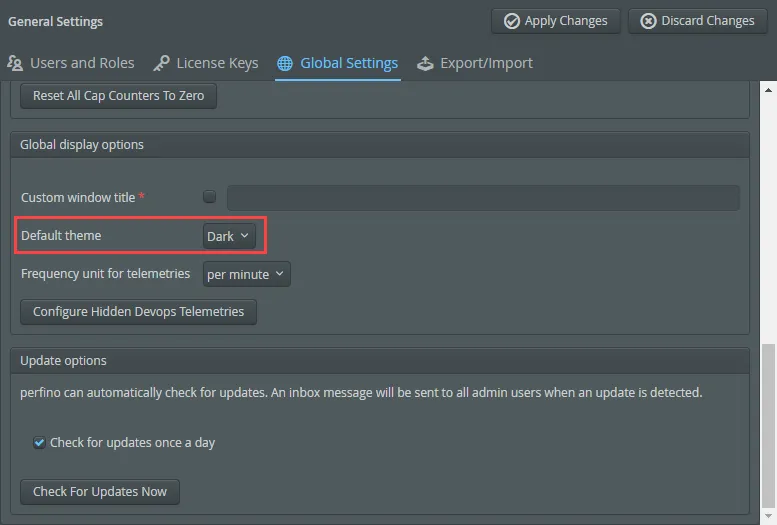
A dark mode has been added. You can switch the theme with the theme selector button in the header at
any time. The selection is persistent for your browser across sessions.
The default theme is the light theme, but this can be changed in the general settings.
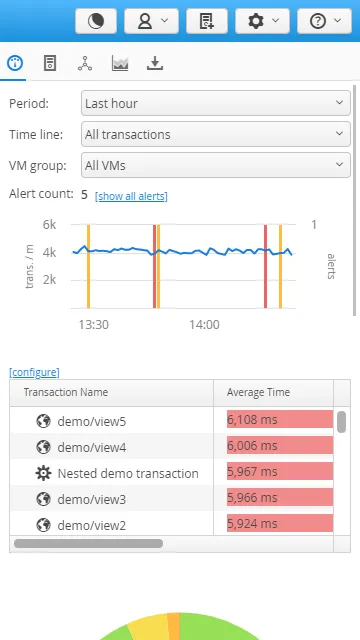
The perfino UI is now responsive and works on mobile devices down to a viewport width of 320px.
Not only the dashboard, but all views and configuration screens adapt to the screen width of the device.
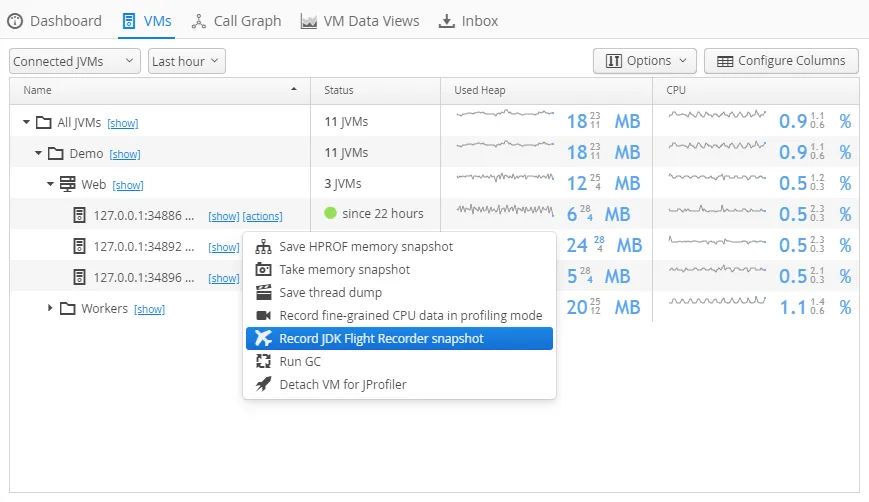
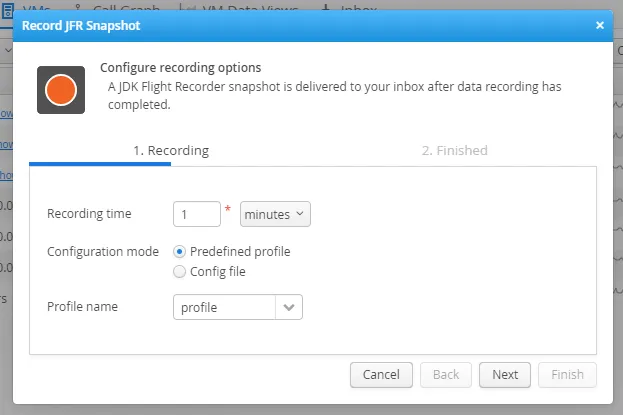
JDK Flight Recorder (JFR) snapshots can be recorded from the VMs view. This is a non-intrusive way
to collect more low-level profiling data for a selected JVM. A corresponding trigger action is also
available.
In addition to the recording duration you can choose one of the predefined settings or upload a settings
file that was exported from the "Flight recording template manager" in JMC.
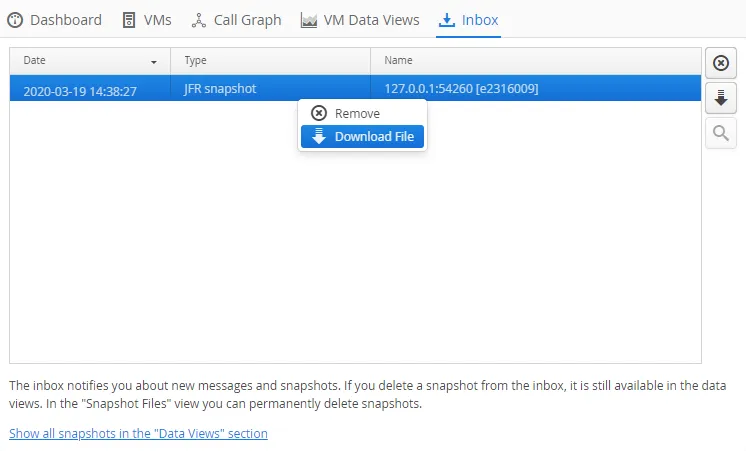
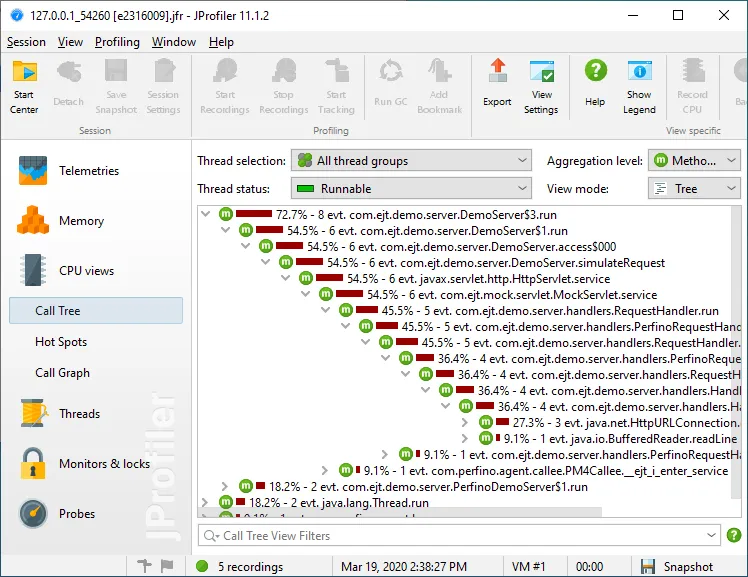
When the snapshot is ready, you can download it from the perfino UI and open it in JProfiler or in JMC.
In perfino's sister product JProfiler, both CPU and memory analysis as well as probes are available to
deep-dive into the method-level details of the profiled JVM.
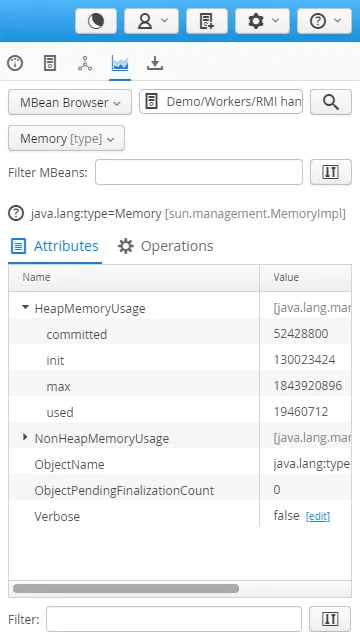
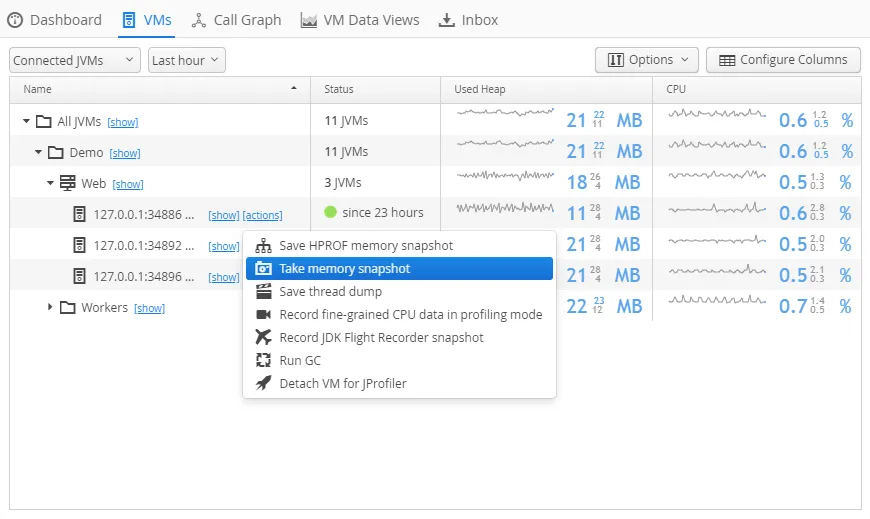
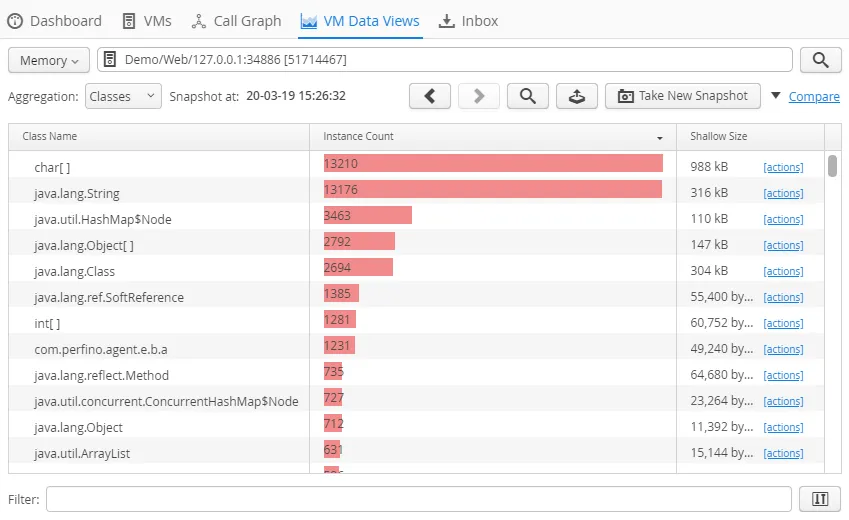
Another new snapshot that can be taken from the VMs view as well as with a trigger action is the
shallow memory snapshot that could previously only be recorded in the "Memory" data view.
This is a low-overhead memory snapshot that gives you an overview on how many objects are on the heap.
x
The action in the VMs data view switches to the "Memory" view to display the data, the trigger action simply
adds the snapshot to the database, just like for the periodic snapshots.
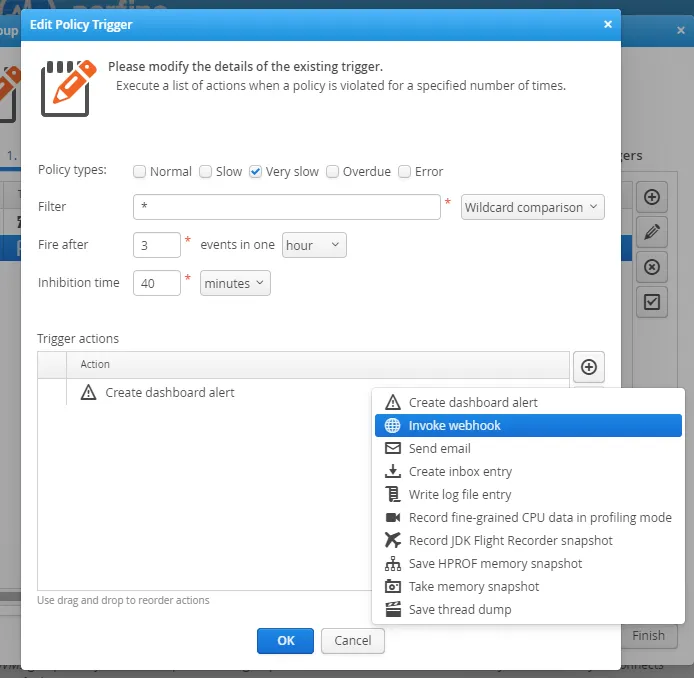
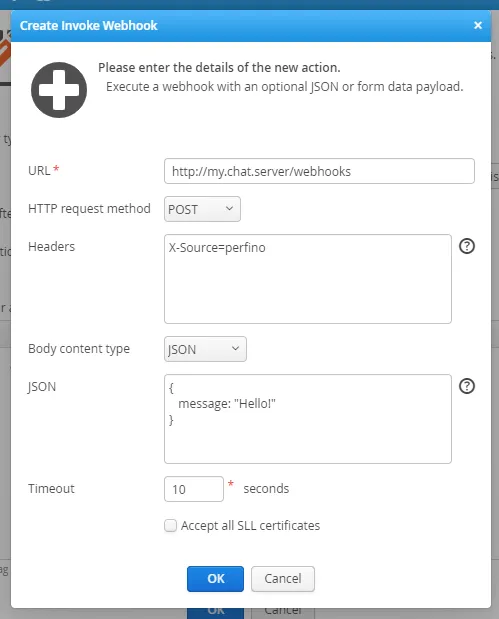
With the new Webhook trigger action, you can invoke URLs when a trigger fires. Integration with
chat servers, workflow tools or other monitoring solutions can often be implemented in this way.
Besides the URL, you can choose the HTTP request method, define headers and pass additional data
as JSON or form data.
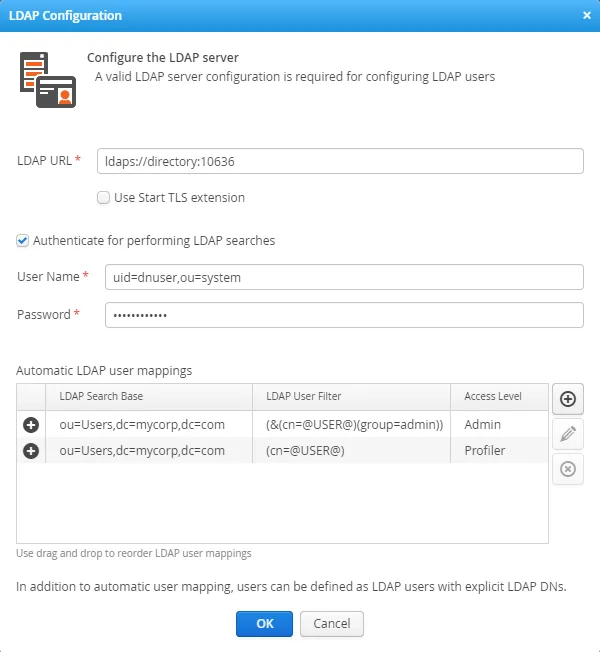
With LDAP authentication you can delegate user authentication to an external LDAP server, such as
Microsoft Active Directory. An LDAP server can be defined in the general settings. The protocols LDAP,
LDAPS and StartTLS are supported, in addition, you can specify a user for performing searches.
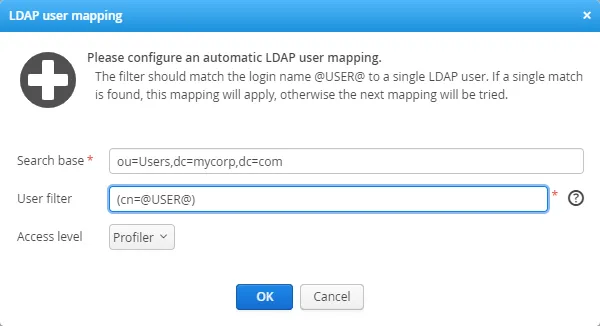
LDAP users can be mapped automatically, by defining a search base and a user filter. When a user logs in,
the specified user name will be tested against all mappings and the first matching mapping will be used.
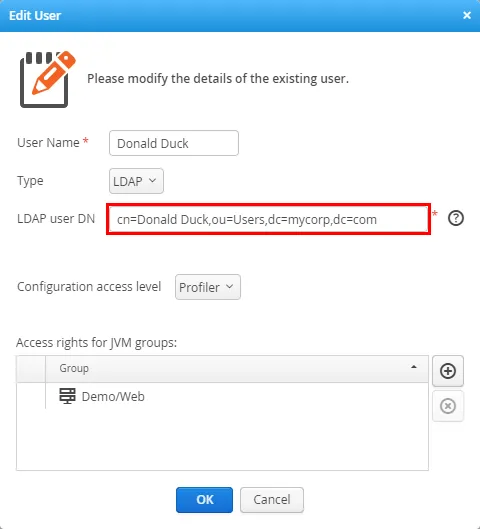
After a user is authenticated by an LDAP server, a local user is created in perfino with an "LDAP" user type
and an LDAP DN. Instead of mapping users automatically, you can also create such users manually and only defer
the password authentication to the LDAP server.
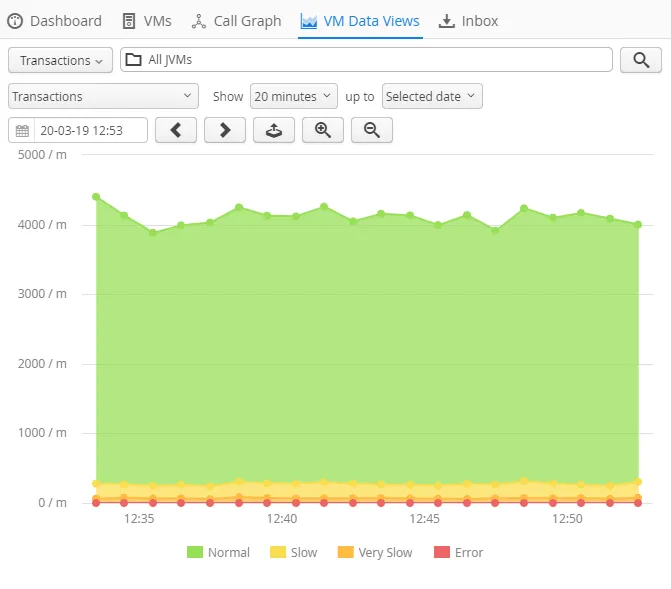
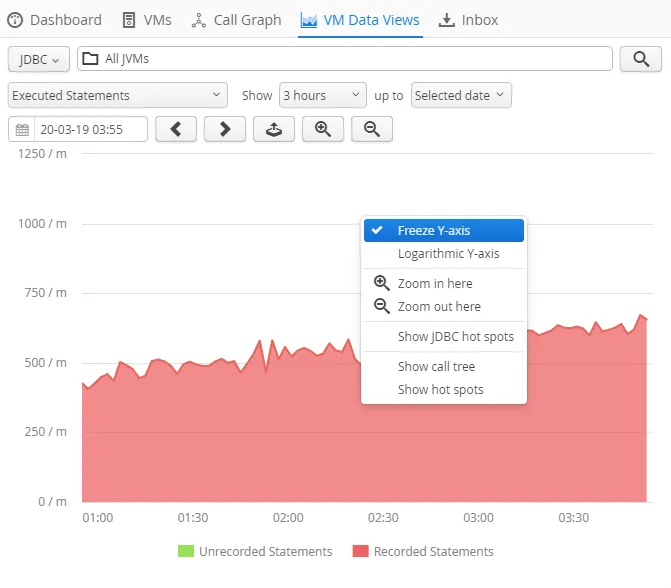
Telemetries now offer options for displaying the y-axis in the context menu. One problem with telemetries
is that expected outliers cause an excessive scale of y-axis for analyzing the regular data. Similarly, in
stacked telemetries not all data lines have comparable magnitudes.
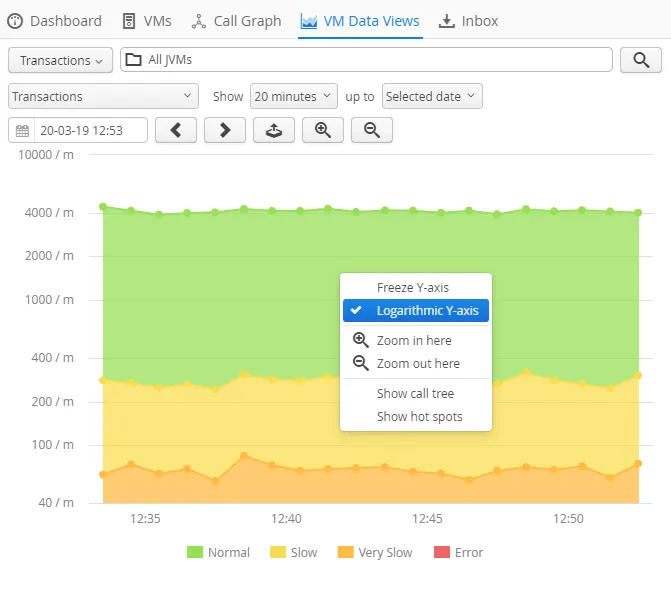
Switching to a logarithmic scale for the y-axis solves this problem.
Another problem is that the automatic adjustment of the y-axis while moving between time ranges can make it
difficult to compare the absolute values. Now you can freeze the y-axis in the context menu.
The perfino UI is now much more keyboard friendly. Tables can be navigated with the keyboard, and there is
a focus indicator for selected rows. Actions in table rows can be invoked with the enter key.
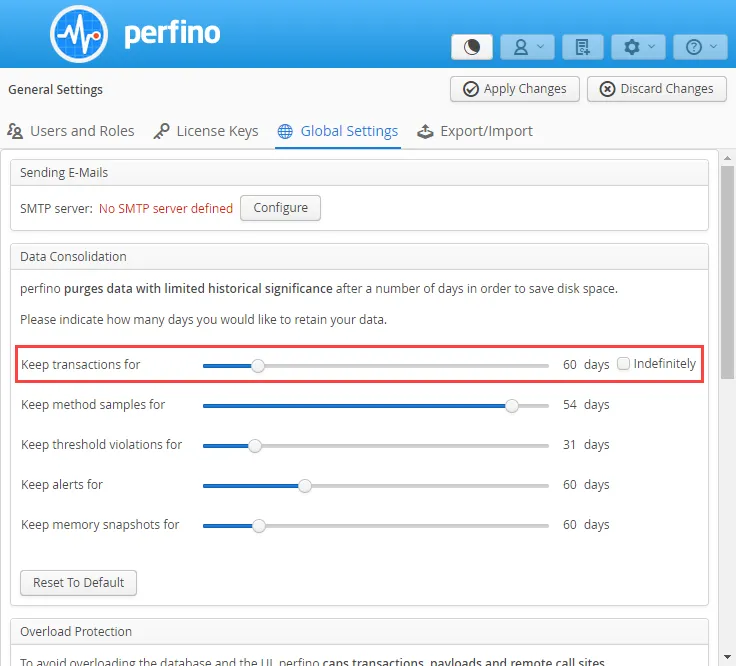
A maximum retention time for transactions is now configurable. The default for new installations is
60 days. When upgrading from 3.x or earlier, the "Indefinitely" setting is activated, which was the only
available behavior in previous versions.
This limited retention reduces the size of database, especially in situations where a lot of different
transaction names or payloads have been recorded that are otherwise never removed from storage.