What's New in perfino 3.0

Change release:

Please see the change log for a detailed list of changes.

perfino 3.0 introduces the following notable new features:

perfino's licensing model has been changed to a micro service-friendly licensing scheme: Only the perfino installation requires a license, the number of monitored VMs is not important anymore.

There is also no restriction on the number of machines on which the monitored VMs are running.

Each separate perfino installation requires its own license.

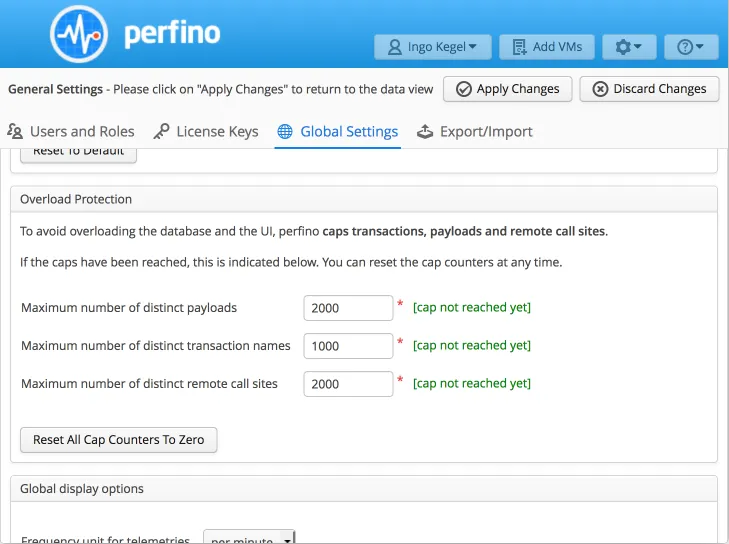
perfino is now has a comprehensive overload protection mechanism. When too much data is being collected, perfino consolidates data under "capped description" nodes.

In the general settings, you can configure separate caps for payload data (for example SQL strings), transaction names and remote call sites.

If any cap is hit, perfino sends you an inbox message. After fixing the configuration, you can reset the cap counters.

You can now perform hot backups of the database with the REST API. By calling the /triggerBackup URL, a directory named "backup" is created in the data directory that can be renamed to "db" when you need to restore the backup.

If the REST API is impractical to use, or if you have not activated it for your perfino installation, you can also create a file named trigger_backup in the perfino data directory. After a few seconds, the file will be deleted and the backup will be performed.

Also, the perfino database has been split into two parts, a database for the configuration and a database for the recorded data. You can discard the database with the recorded data if you want to start with a clean slate, but keep all your settings.

The database size has been reduced considerably through various optimizations and shorter retention times.
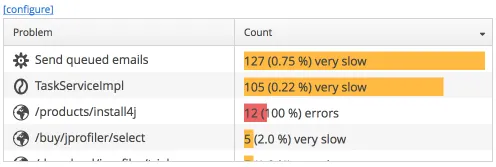
A problems view has been added to the dashboard. If policy violations are detected for a business transactions ("slow", "very slow", "overdue" or "error") a row is added to the problems view, showing how many such issues have occurred in the selected time range.

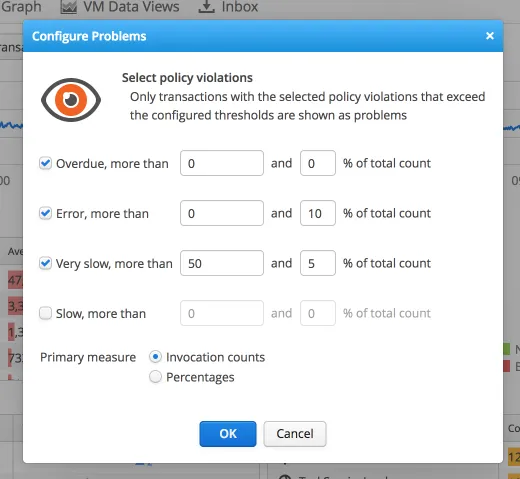
You can configure absolute and relative limits for each policy violation type to limit the minimum severity for which a business transaction shows up in the problems view. Also, you can decide if the histogram should be drawn for the invocation counts or the percentages.

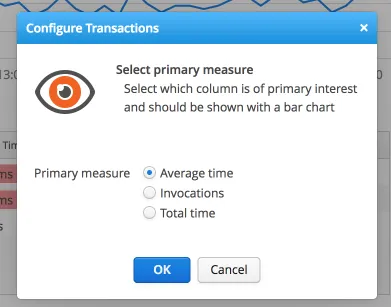
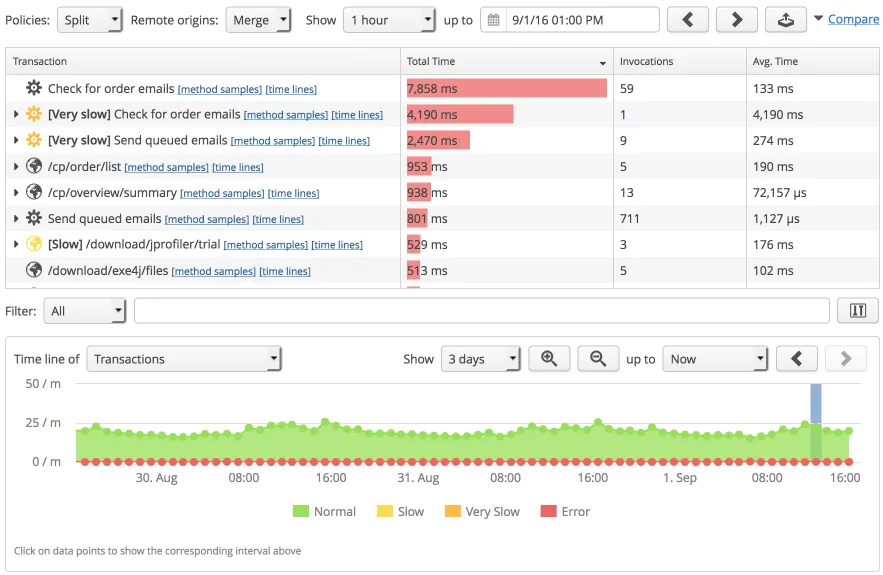
The transaction table in the dashboard has been redesigned. It now shows count, average time and total time for your most important business transactions.

Depending on your perspective, each of theses numbers can be the most important one. It's called the "primary measure" and it determines for which column an inline histogram is shown in the table.

All elements in the dashboard now link to the VM data views. When you click on rows in any dashboard table or a pie slice in the policy violation chart, the corresponding VM data view is shown with the appropriate view parameters, so you can start your drill down directly in the dashboard.

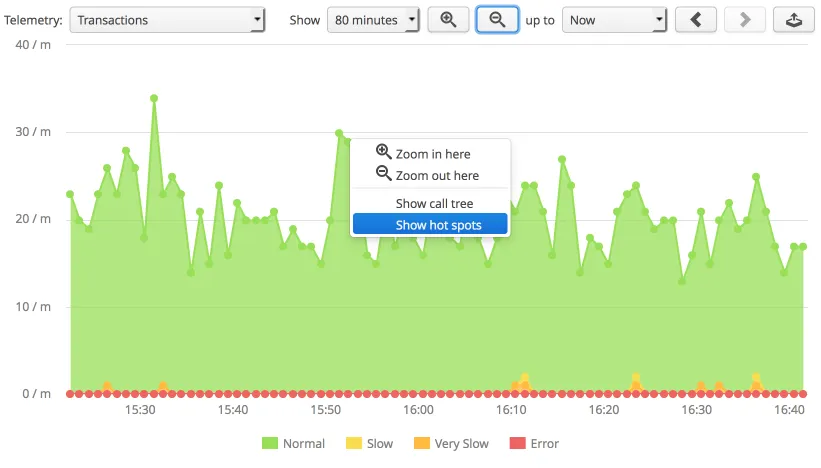
In the transaction timeline, you can now right-click any data point and jump to the call tree or hot spots view.

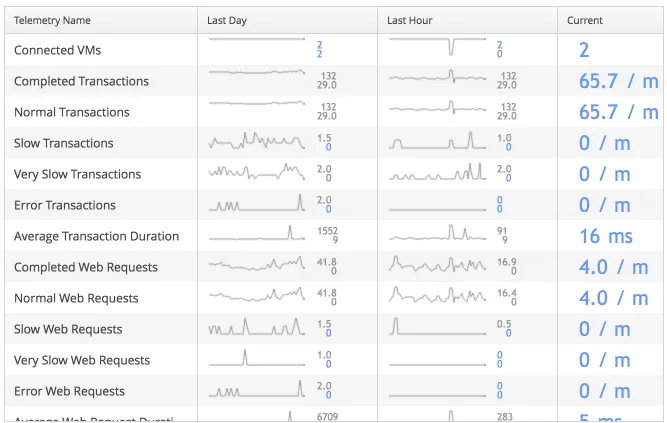
Generally, all sparklines now link to their full telemetry views with similar time ranges, also in the columns of the "VMs" view.

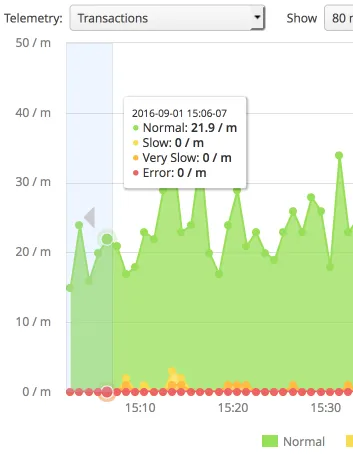
Telemetries have been enhanced. In perfino 3, there are a lot more time ranges, and the new zoom buttons allow you to quickly see more or less data. Double-clicking on the timeline zooms in at that location, if possible.

The context menu now contains actions for jumping to other relevant views at the selected point in time. Beside call tree and hot spot views, this can include probe hot spot views for probe telemetries.

When you zoom or navigate the time range to earlier or later times, vertical scale changes are animated, this makes it a lot easier to interpret data. Navigating is now more convenient with the additional inline navigation buttons that appear when you hover at the edges of the telemetry.

Moving to earlier or later times now shifts the starting point of the displayed interval by 1/3 of the total display range. To skip full intervals, press the CTRL key while navigating.

When you select the "Telemetries" or the "Custom telemetries" node in the view selector, you now see an overview for all contained telemetries with sparklines for the last hour and the last day. Clicking on any sparkline will show the full telemetry view with a similar time range.

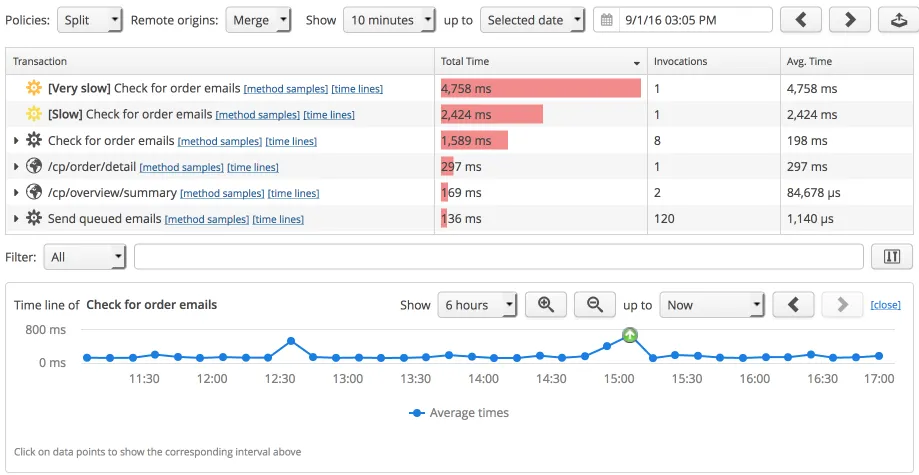
Transaction timeline for call tree and hot spot views. The new transaction telemetry at the bottom gives you a better context for the main view by showing the displayed time range with a different background. Also, it allows you to navigate to a particular interval by clicking on a data point.

The timelines for single transactions are still available and hide the default transaction time line. With the "close" button, you can restore the default transaction timeline.