JProfiler 9.2 introduces the following notable new features:
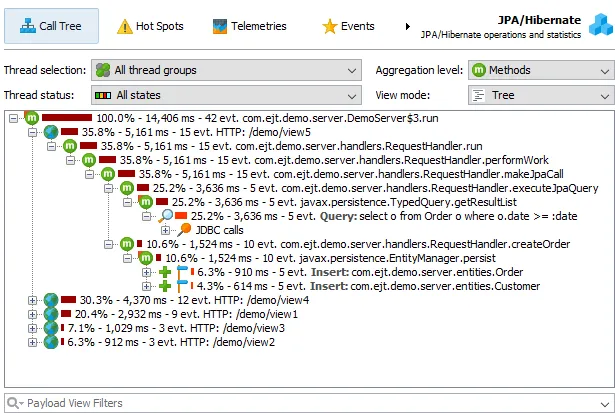
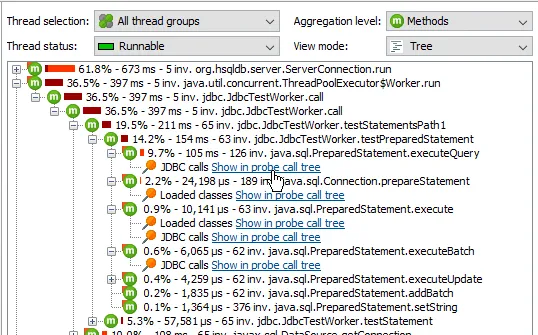
Probe call tree view. In addition to the probe hot spots, probes now have a probe call tree view.
It is similar to the CPU call tree and shows cumulated call stacks, but the numbers on the nodes refer to
the probe payloads - the leafs in the probe call tree.
With this view, you can check execution paths that generate most JDBC activity, file I/O, class loading or
whatever is measured by your probe of interest.
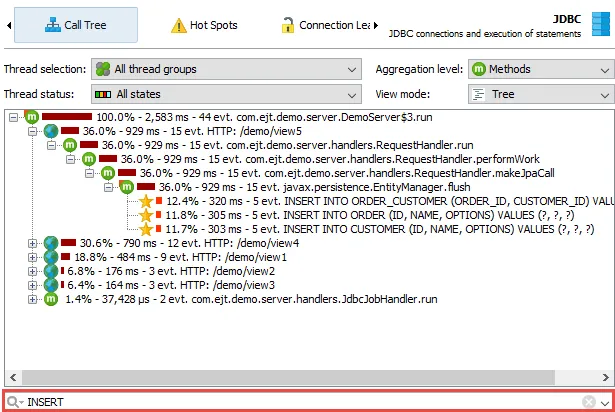
By default, the view filter of the probe call tree view does not filter methods, but payloads, like in the probe
hot spots view. This is useful for locating particular payloads or to analyze the probe call tree
for selected classes of payloads, for example, only for SQL "INSERT" statements.
The class-based view filter is also available and can be activated in the view filter options.
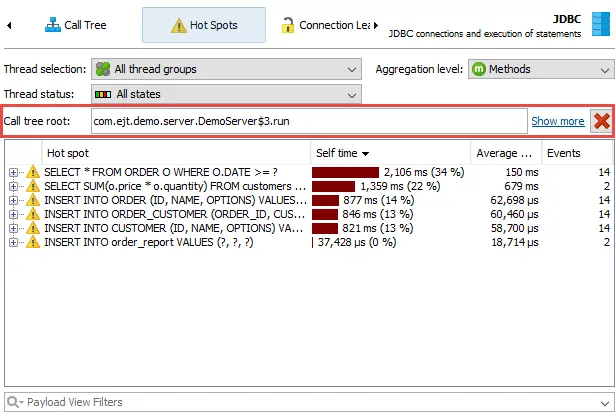
Just like the CPU call tree view, the probe call tree supports "set as root" functionality that limits the
displayed data in the probe hot spots as well. In that way you can select a particular call stack and analyze
the probe hot spots exclusively below that call stack.
Call tree analyses like the ones in the CPU call tree view are available in the probe call tree as well.
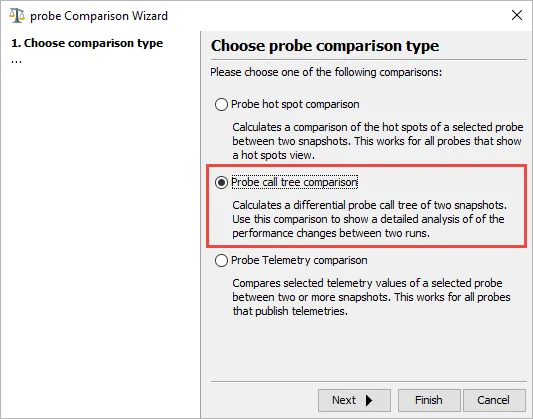
Finally, the probe call tree comes with a probe call tree comparison to compare the probe call trees
of two different snapshots.
Hyperlinks are now added in the CPU call tree if probe data has been recorded at a particular call stack.
Clicking on that hyperlink takes you to the same call stack in the corresponding probe call tree view.
This also works in the CPU call tree analyses where a hyperlink will take you to the same analysis of the
probe call tree view.
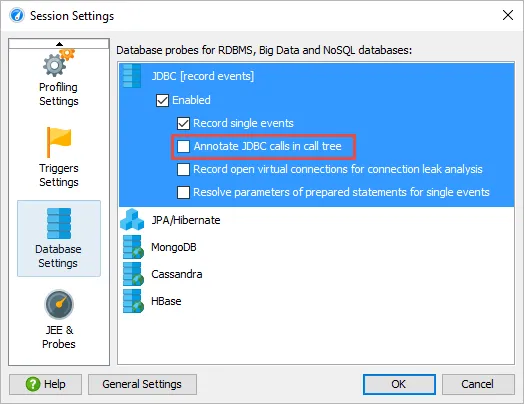
These links will only be shown for probes whose "Annotate in call tree" option is deselected. This is now
the default for all probes in new sessions, previously that setting was enabled for JDBC, JMS, JNDI and the
JPA/Hibernate probes.
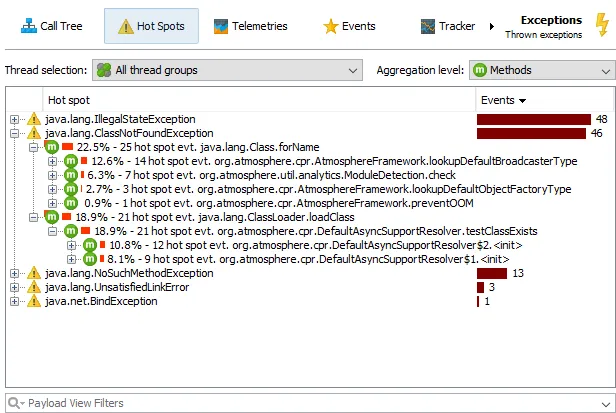
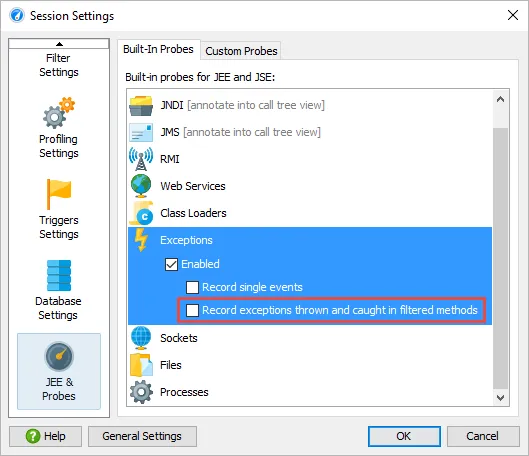
An exceptions probe was added. It shows exception class names as payloads. No times are measured in
this probe, so the primary information is the number of exceptions that is thrown. Both probe call tree and
hot spots show percentage bars based on the exception count. The events view additionally shows the exception messages.
By default, only exceptions that are thrown or caught in profiled classes are measured.
In the probe settings, you can enable the measurement of all exceptions.
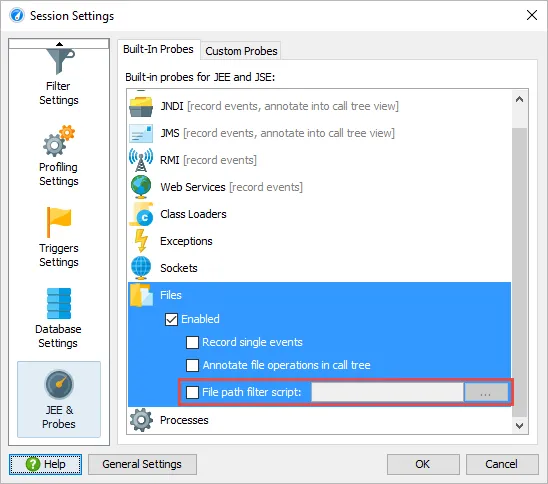
The file probe can now limit the recorded payloads based on the involved file paths.
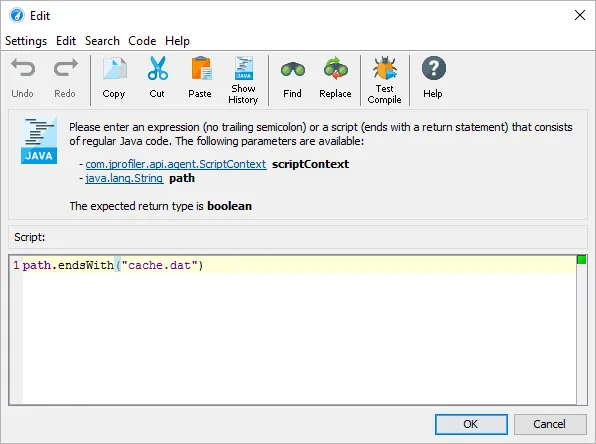
In the probe configuration of the file probe, a filter script can be specified that receives the file path
as a string and returns a boolean value to decide whether the file I/O should be measured or not.
Because file I/O can produce huge amounts of profiling data, this option allows you to focus on particular
parts of your application and remove clutter such as I/O from class or resource loading.
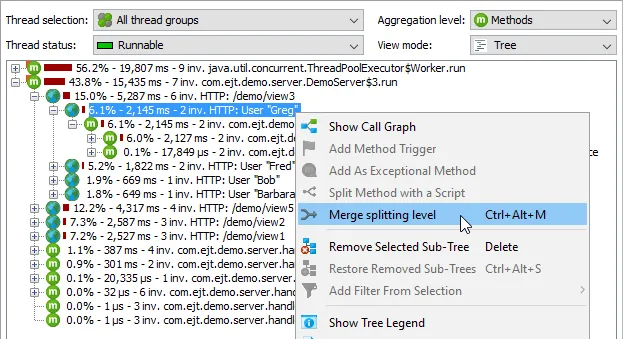
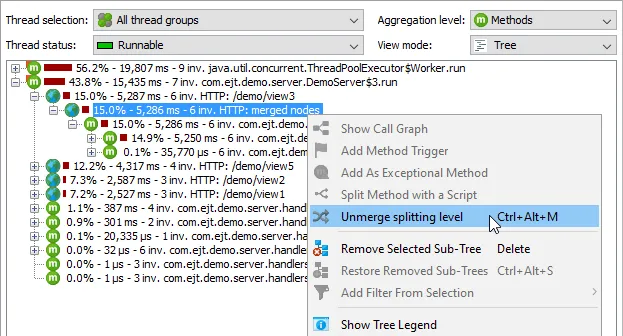
You can now merge and unmerge call tree splittings on the fly. While call tree splitting is a powerful
feature, you often want to switch back and forth between seeing the separate subtrees and the entire
cumulated tree.
To merge call tree splits, select a call tree splitting node and choose "Merge splitting level".
All call tree splittings of the selected type are then merged, and their cumulated call trees are placed below
nodes that are labeled as "[Splitting type]: merged nodes". Splits that can be merged include method splitting
from the "Split method with a script" action, exceptional method run splitting as well as RMI and HTTP request
splitting. In a multi-level HTTP-split, only the selected level is merged.
The same action allows you to unmerge a merged splitting level after selecting any of the "merged nodes" entries.
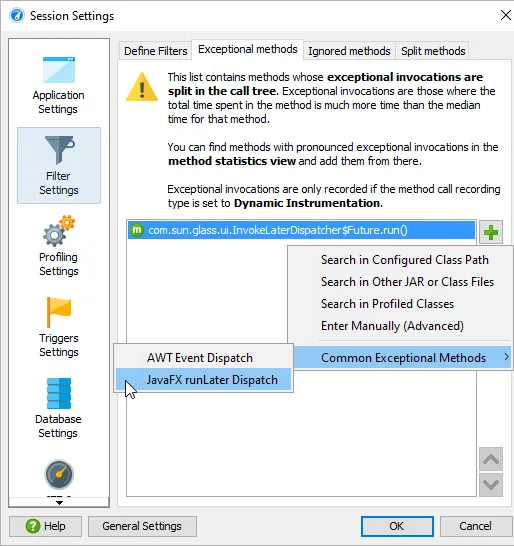
In related news, the implementation of exceptional method run splitting has been improved to reduce overhead
and allow splitting on methods in unprofiled classes. For example, you can now split operations on the AWT or
JavaFX event dispatch threads to see the longest-running operations separately in the call tree.
The session settings dialog offers a shortcut for adding the methods that will perform the appropriate splits.
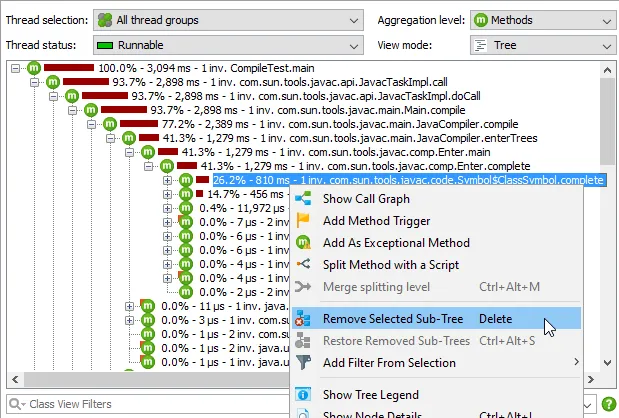
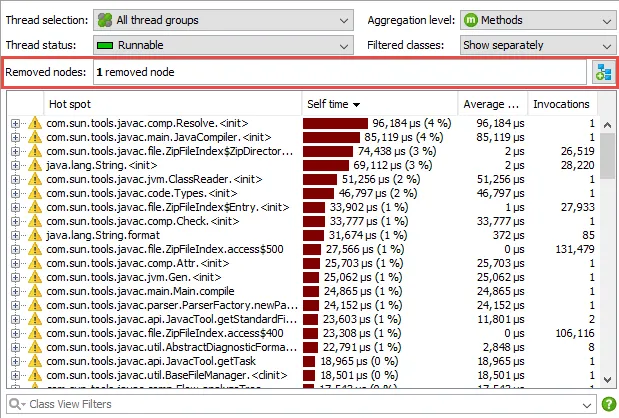
The removal of sub-trees in the call tree allows you to play "what if scenarios" and analyze
secondary hot spots if a selected method is assumed to be optimized. Select the desired call stack in the
call tree and choose the "Remove Selected Sub-Tree" action from the context menu.
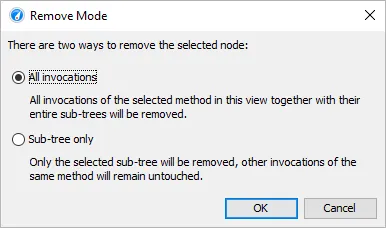
You can remove all invocations of the selected node together with all the corresponding sub-trees, or limit
the removal to the selected subtree only.
The call tree, the hot spots view, as well as the call graph are now shown without the removed subtrees.
A special line in the view header shows that nodes have been removed manually. The button on the right side
brings up a dialog for re-adding removed methods.
The allocation tree view, the probe call tree as well as call tree analyses views showing forward
traces also support removing selected subtrees.
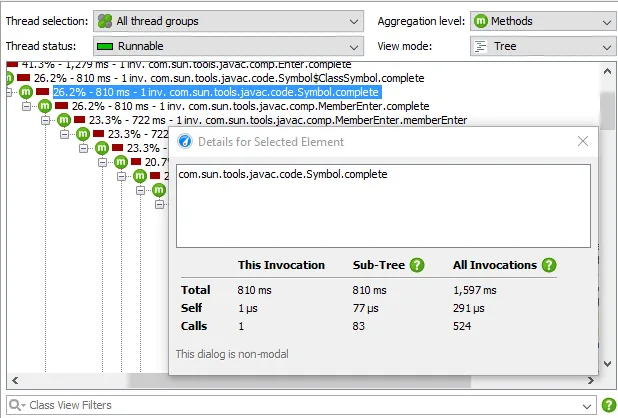
Quick info for call tree nodes shows you statistics for the selected call tree nodes in 3 columns:
"This invocation", "Sub-Tree" and "All invocations". In the "Sub-Tree" columns, recursive invocations are
summed up while the "All Invocations" column shows totals for all occurrences of the selected node in the
entire tree.
The node detail dialog is non-modal, so you can quickly inspect statistics from different nodes just by
selecting them while the node detail dialog is open. Some of the statistics would otherwise require performing
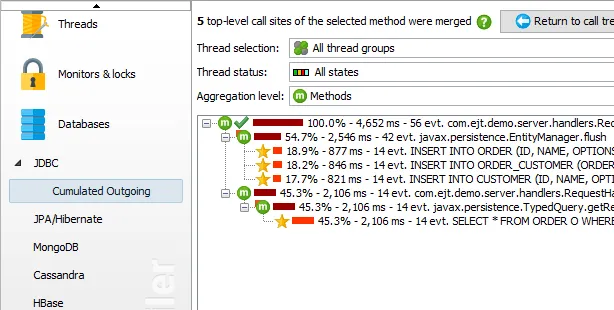
a call tree analysis, for example "Sub-tree/Self" is shown in the top-level node of the "Collapse recursions"
analysis and "All Invocations/Total" is shown in the top-level node of the "Calculate cumulated outgoing calls"
analysis.
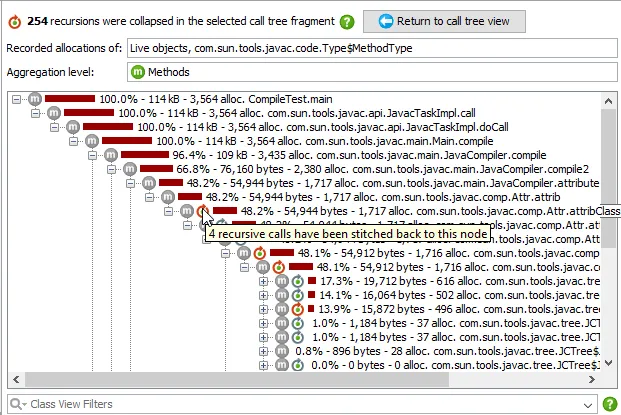
Call tree analyses like in the CPU view have been implemented in the allocation views.
"View->Analyze" gives access to several call tree analyses such as collapsing recursive invocations.
The result of the analysis is shown in a nested view.
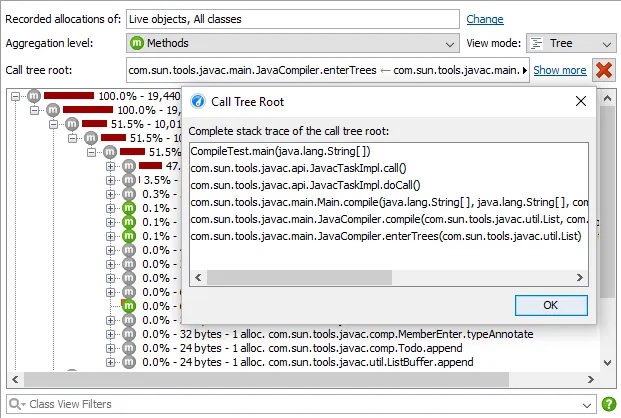
Also, the set as root functionality has been implemented in the allocation views.
By selecting a call stack in the allocation tree and invoking "Set As Root" from the context menu,
you can limit the allocation tree as well as the hot spots analysis to the selected subtree.
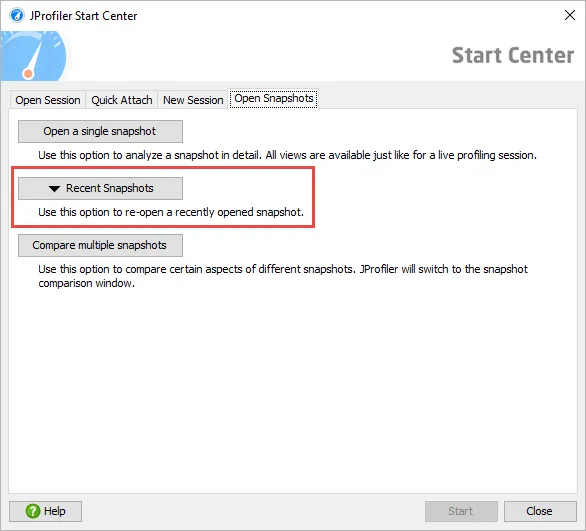
Snapshot loading has been improved. Snapshots now load faster than before, and a list of recent snapshots
is available in the menu and in the start center.
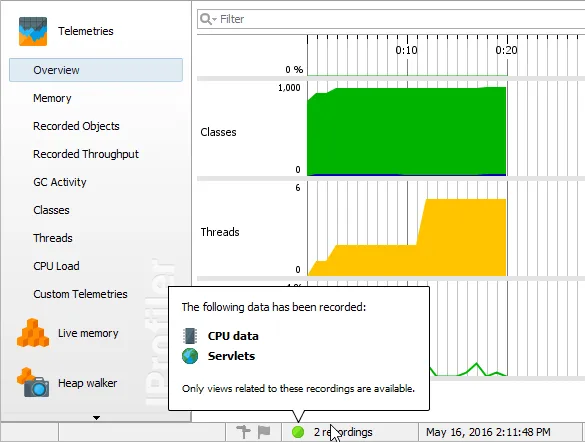
Views in snapshots where no data has been recorded are now disabled. The recording status indicator in the status
bar shows you which recordings were active at one point in the profiled JVM.
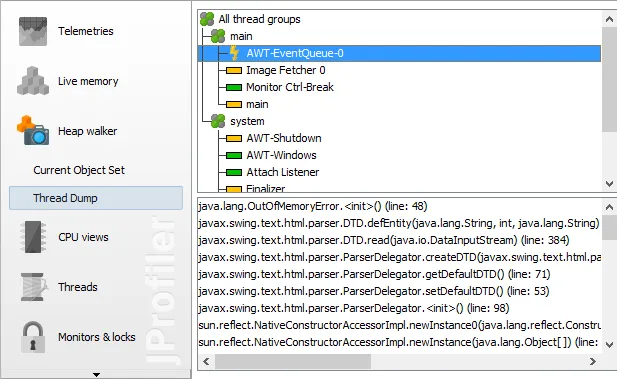
This release adds support for thread dumps in HPROF snapshots. When an HPROF snapshot is saved,
a thread dump is written to the snapshot as well. That thread dump is now shown in a special
thread dump view below the heap walker view.
Many HPROF snapshots are saved on OutOfMemoryErrors with the VM parameter -XX:+HeapDumpOnOutOfMemoryError.
In that case, the thread that caused the OutOfMemoryError is shown with a special icon.
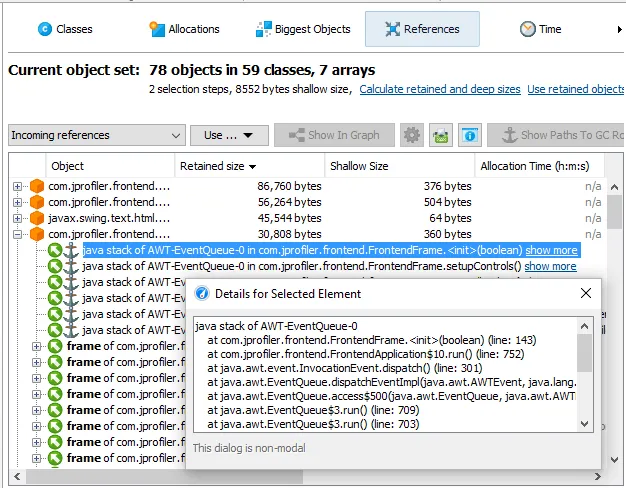
For references from the Java stack, HPROF dumps include the full stack traces. These stack traces are now shown
in the node detail dialog for the incoming references view and in node tool tips in the heap walker graph.
Other notable improvements in the heap walker include:
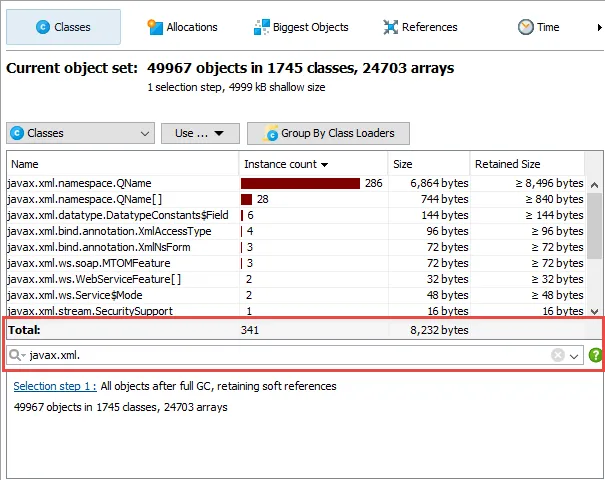
The classes view now has a view filter and a "total" line. Just like
in the dynamic memory views, you can now filter for packages or regular expressions and quickly check the
total memory consumption of the displayed classes.
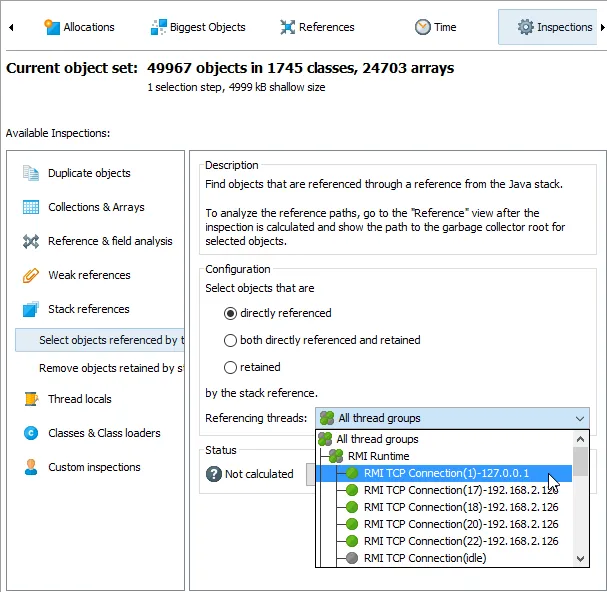
The stack reference inspections now allow you to select a specific thread or thread group.
Previously, references from all threads were processed.
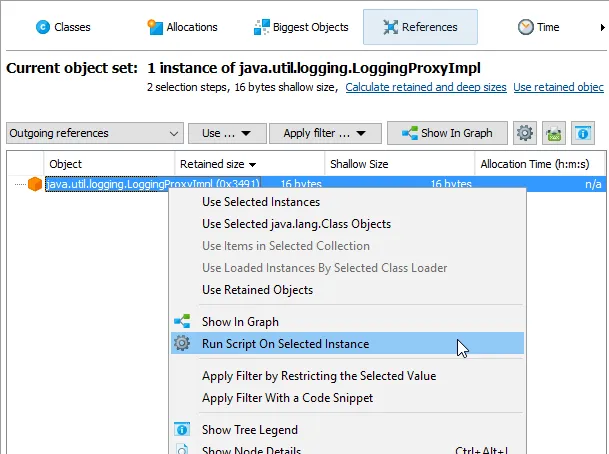
The reference views now have a "Run script on selected instance" action. In live profiling
sessions, you can use it to run any public operation on the instance and display a string value with the
results of the operation.
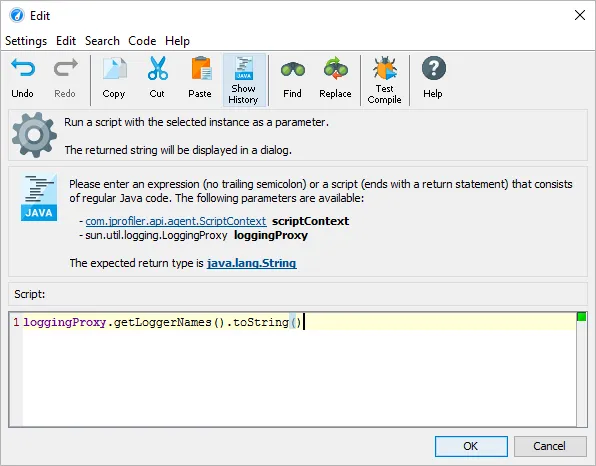
In the code editor, the nearest public type is provided as a parameter and code completion gives you quick
access to the public methods and fields. The script must return a string.
If the script completes successfully, the returned string value is displayed in a dialog.
Extended web service tracking support. JProfiler can now also track web service calls between JVMs
for the following technologies:
- Axis2 custom web service stubs
- Apache HTTP client version 4.x
- Async web service calls for Java 7 and 8, Axis2 and CXF
Java 6 support for command line attach tools. Command line tools that attach to running applications
now work with Java 6 - and we intend to keep this minimum requirement as long as profiling Java 6 is supported.
The affected command line tools are
jpenablejpdumpjpcontroller
While JProfiler 9.2 supports profiling Java 5 as well, Java 5 has no attach API. For Java 5, specifying
the -agentpath VM parameter remains the only option.