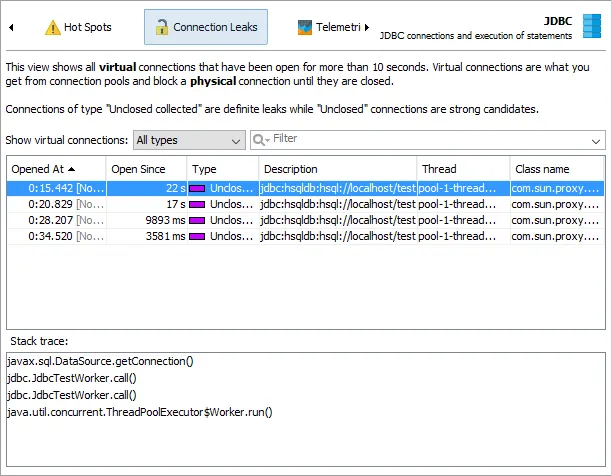
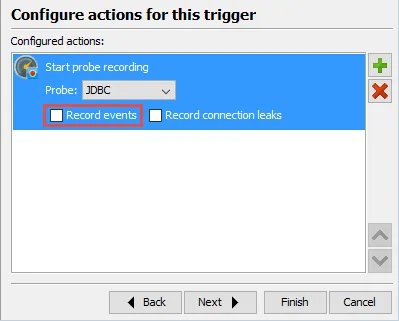
Connection leak detection. The JDBC probe now has a "Connection leak" view that looks for virtual connections that were obtained from a JDBC connection pool without being properly closed afterward.
What's new in JProfiler 9.1
Change release:
Please see the change log for a detailed list of changes.
JProfiler 9.1 introduces the following notable new features:
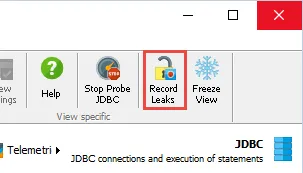
Connection leak detection has a separate recording action. It is off by default but remembers its state so that can be automatically toggled together with JDBC probe recording.
Two types of leak candidates are shown, "unclosed" for connections that have been open for a long time, and "unclosed collected" for connections that were garbage collected without being closed. JDBC connection string, thread name, implementation class of the connection, as well as the stack trace where the connection was opened are displayed for each leak candidate.
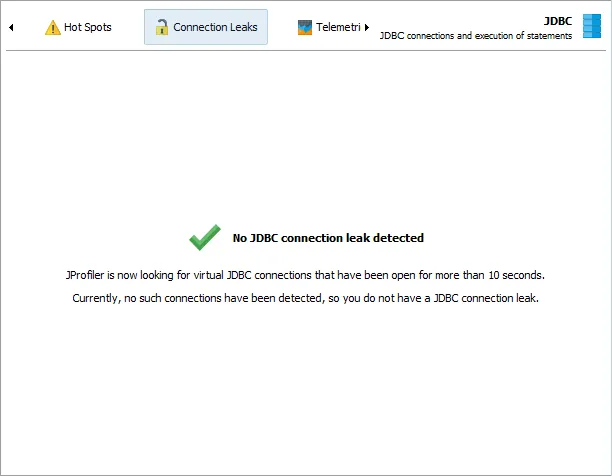
Connections that have been open for less than 10 seconds are not shown as leaks. To confirm that no leaks are detected, a special banner is shown in the connection leaks view:
As an added benefit of the work on this feature, JProfiler is now aware of the internals of a large number of database drivers and JDBC connection pools. Because of this, JProfiler has become much better at distinguishing between physical and virtual connections , so the time line and control objects view now display more relevant information.
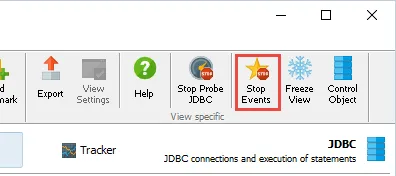
Probe event recording can now be switched on and off with a tool bar button, so you can record events for specific scenarios.
Previously you had to toggle event recording in the profiling settings, so that all profiling data was lost.
This change propagates into the configuration of trigger actions, the controller API and the JProfiler MBean.
SSH tunneling for remote profiling. If the profiled JVM is running on a different machine, you can run the JProfiler GUI locally and connect with a remote session. However, often you cannot make a direct network connection and SSH is the only option. While it was always possible to set up an SSH tunnel, this could be cumbersome and difficult to trouble-shoot.
This release adds built-in SSH tunneling for direct SSH connections and multi-hop SSH connections. Both the remote session configuration as well as the quick attach configuration allow you to switch to this connection mode.
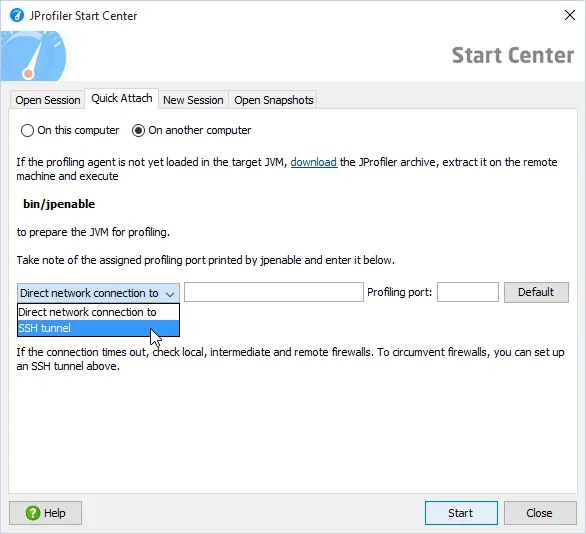
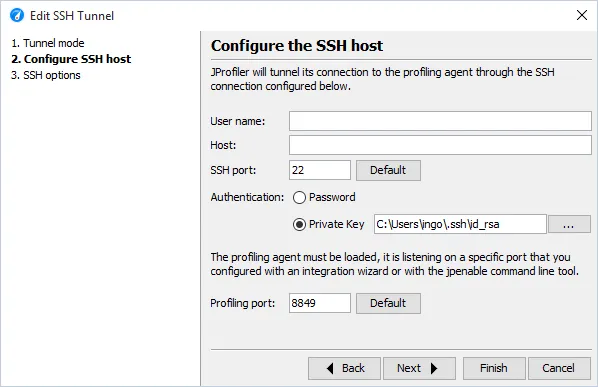
The SSH tunnel wizard offers two different modes. The first is for a direct SSH connection where you simply configure the SSH host and your authentication.
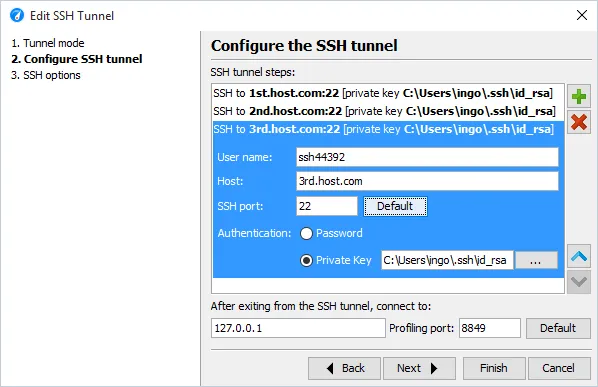
The second mode is for a multi-hop SSH tunnel where each SSH connection has its own authentication. Upon exiting from the SSH tunnel, you can make a direct network connection to the profiled JVM.
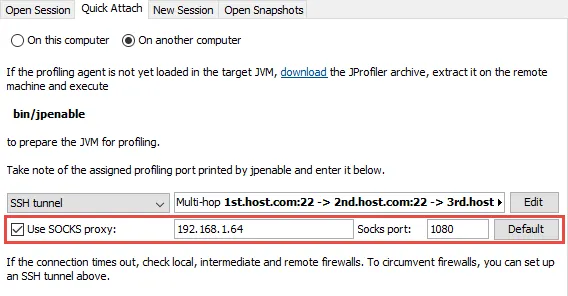
To complete the connectivity enhancements in this release, socks proxies are now supported,
both for direct network connections as well as for SSH connections.
A telemetry overview has been added that is shown as the first view in the telemetry section. It shows all system and custom telemetries as rows with an adjustable height.
Clicking on a telemetry name will take you to the full telemetry view. The filter text box at the top allows you to limit the displayed telemetries.
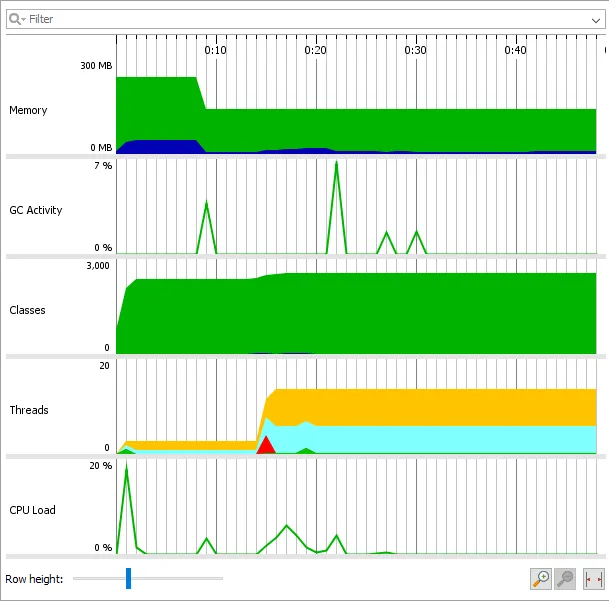
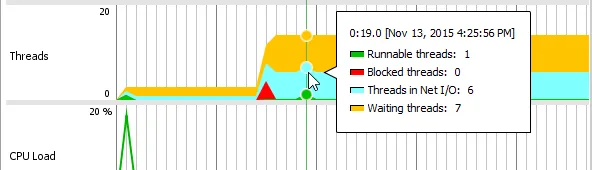
Tool tips have been added to all telemetry views and graphs. The tool tip snaps to the measured data points and shows measured values for all data lines.
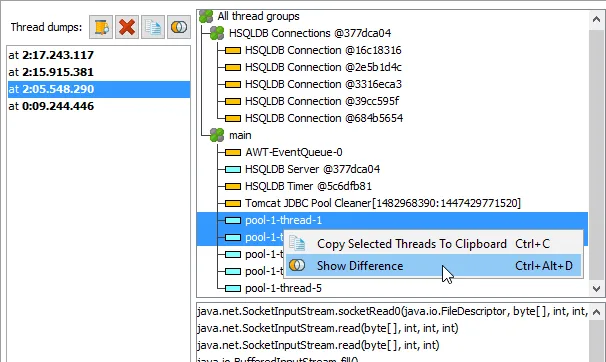
Thread diff functionality has been added to the thread dumps view. You can select two thread dumps and click on the "Show difference" button at the top of the thread dump list to show a diff view.
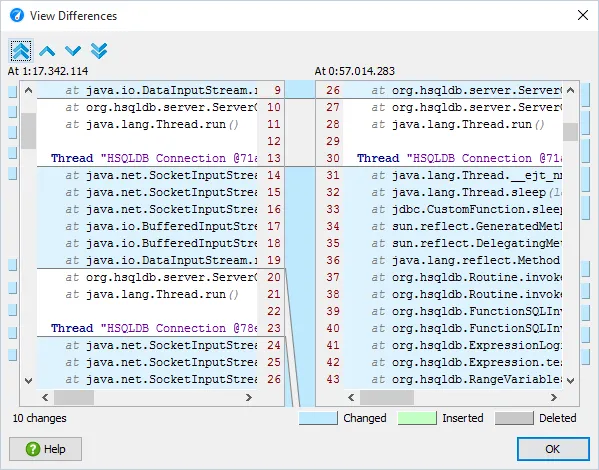
It's also possible to select two threads from the same thread dump and choose "Show difference" from the context menu.
A thread locals inspection has been added to the heap walker. It shows you all objects in the current object set that are referenced or retained by a thread local - a common cause for memory leaks.
The inspection can either find the objects that are directly referenced in the thread local, or objects that are retained by the thread local.
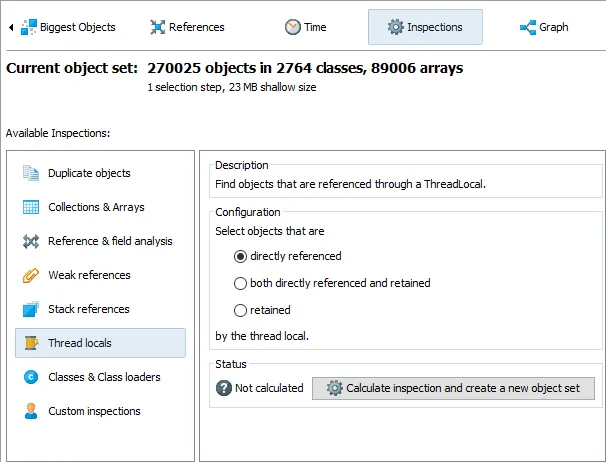
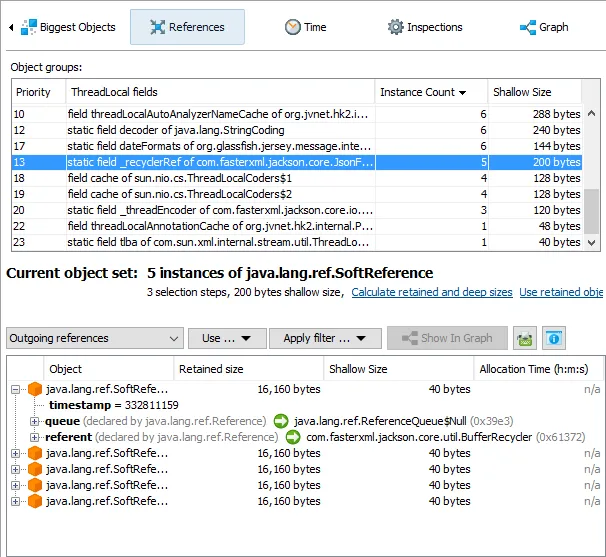
The inspection will create object groups for each different type of thread local. If you activate the reference view in the heap walker, you can then quickly look at the single objects that are referenced by a particular type of thread local.
In this release, the inspections view was redesigned and inspections were grouped into different categories. In particular, the weak reference and the stack reference inspections were split into multiple inspections and their configuration is now much easier to understand.
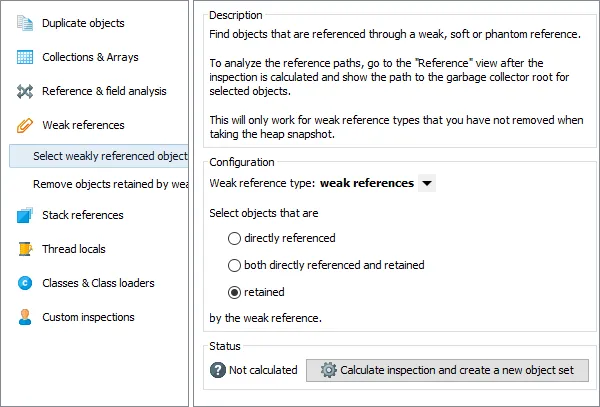
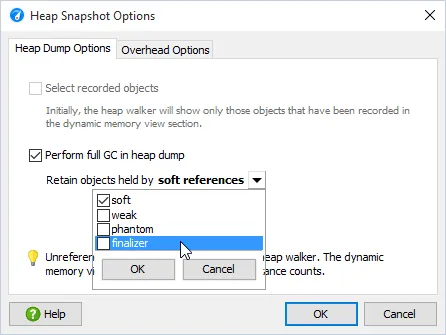
Finally, the heap walker can now retain finalizer references - previously they were always discarded if full GC was selected in the heap walker options. All inspections that deal with weak references also have an option for working with finalizer references.
Graphs have been improved. To increase the information density, package names are now shortened, with tool tips showing the full package names. You can disable this feature in the view settings.
The mouse wheel now scrolls. If both scrolling directions are available, then you can scroll horizontally with by pressing shift. With Ctrl/Cmd, the scroll wheel zooms to the location of the mouse pointer. On Mac OS X, the "pinch to zoom" gesture is now supported.
When the target or origin node of an edge is not visible, a tool tip will be displayed, and clicking the edge shows the target node while Ctrl/Cmd clicking the edge shows the origin node.
In the call graph, there can be a lot of outgoing calls from a method. Usually, you are only interested in those calls that take the most time. Starting with this release, the first click on the expander icon for outgoing calls only shows nodes above the threshold that is configured in the view settings.
If more outgoing calls are available, the arrow icon turns grey.
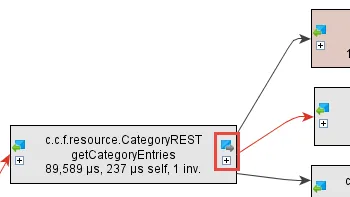
After the second time you click the expander icon for outgoing calls, all nodes are shown and the expander icon is removed.
Previously, to revert a bloated call graph, you had to delete nodes or start from scratch. Now, there are undo and redo actions, so you can quickly revert undesirable changes.
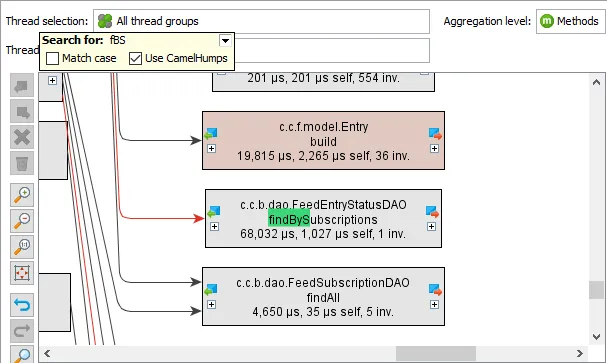
Graphs now support quick search, so finding nodes in a large graph is no longer problematic. Also, quick search in all component now has options for case sensitivity and camel hump search. Searches are now case-insensitive by default.
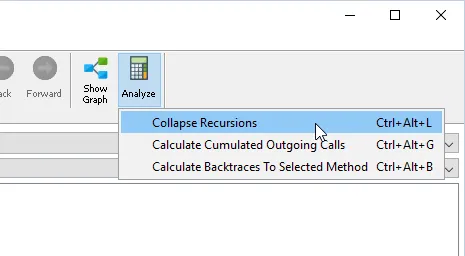
With the new call tree analyses, you can gain further insight into the call tree. When you select a node in the call tree, the "Analyze" actions are available from the tool bar or the context menu.
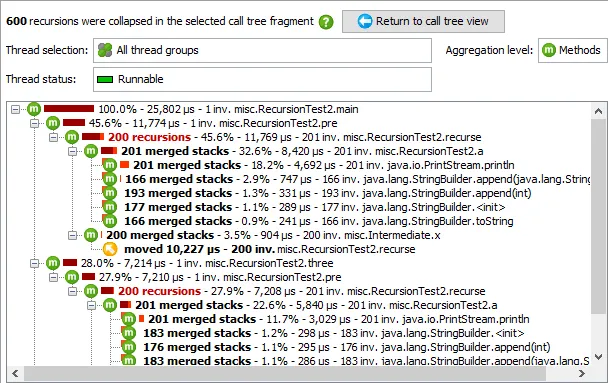
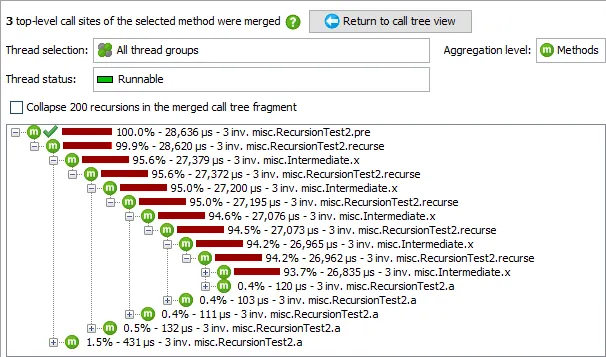
The "Collapse recursions" analysis looks for recursive invocations of the same method and folds them together. Recursive calls and recursion entry points are specially marked. All overlapping parts of stitched call trees are marked with labels of type "n merged stacks".
The "Calculate cumulated outgoing calls" analysis collects other invocations of the selected method from the entire call tree and cumulates them into a single tree. The analysis can also collapse recursions in the result tree.
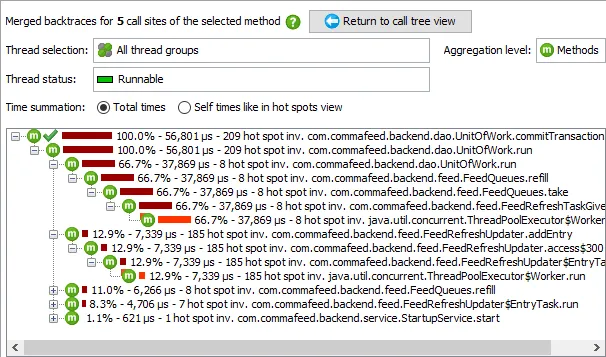
The "Calculate backtraces to selected method" produces results similar to the "Hot spots" view. However, the selected method does not have to be a hot spot, the displayed times can also be total times and recursions in the back traces can optionally be collapsed.
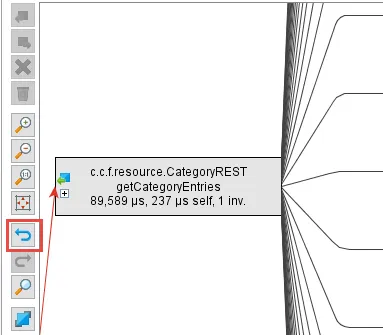
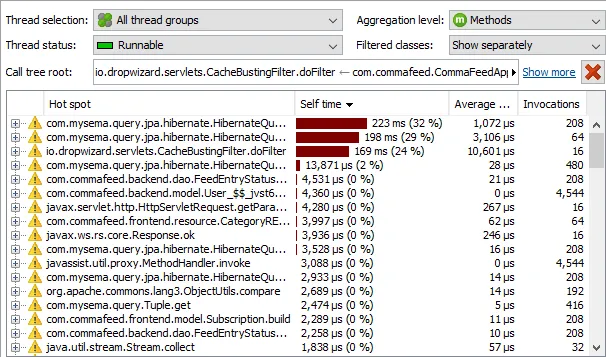
The set root functionality in the call tree has been improved. Like before, call tree roots are set in the call tree by selecting a method and choosing "Set root" from the context menu.
However, the call tree root now also limits the displayed data of the hot spots and call graph views as well. This makes it much easier to analyze a certain part of the call tree in isolation.
In all affected views, the current root is now shown at the top of the view.
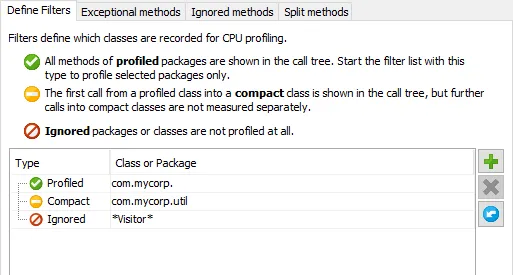
Call tree filters have been improved. Instead of "inclusive" and "exclusive", they are now called "profiled" and "compact" and an "ignored" filter type has been added.
Compact filters only measure the first call from a profiled class while hiding the internal call structure. "Ignored" filters can be used to remove classes from the call tree completely. You can also use wildcards to match certain types of classes across packages.
Support for profiling modularized applications on Java 9. Applications that are launched with a module path and not with a class path can now be profiled by JProfiler. The implementation of the module system in the JRE is not final, future bug fix releases will track any changes in upcoming JRE builds.
Support for profiling on Linux ARMv8. Linux ARMv8 has been added as a new platform.