JProfiler 9.0 introduces the following notable new features:
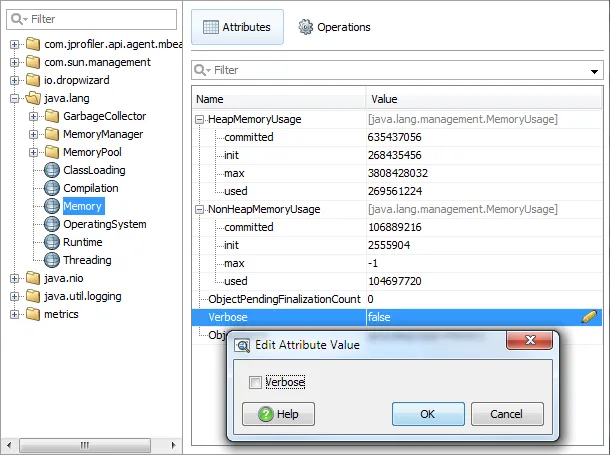
MBean browser. JProfiler 9 adds a facility for inspecting MBeans, modifying their attributes and
executing their operations.
Many server products and third-party libraries publish MBeans to publish metrics and enable programmatic
configuration by tools. JProfiler's MBean browser lists beans from all registered MBean servers without
the need for starting a JMX connector and opening a port in the profiled JVM.
Editable MBean attributes of all simple types and their arrays can be edited.
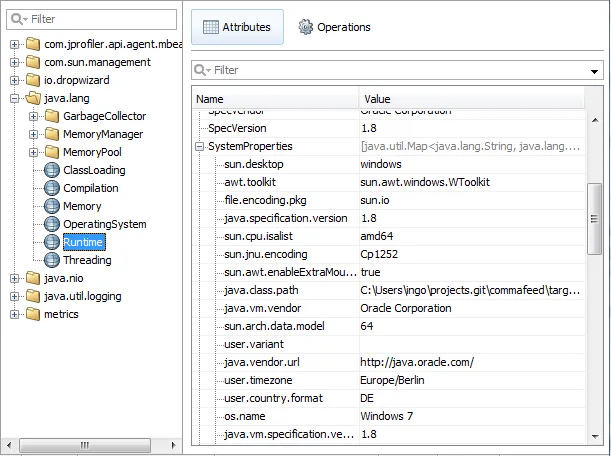
Composite and tabular MBean data is shown inline in a tree table structure. Also, tabular data with one index and
one value column is shown transposed. This makes it easy to inspect the frequently occurring attributes of type java.util.Map
in MXBeans. Below, you can see the system properties in the java.lang/Runtime MXBean.
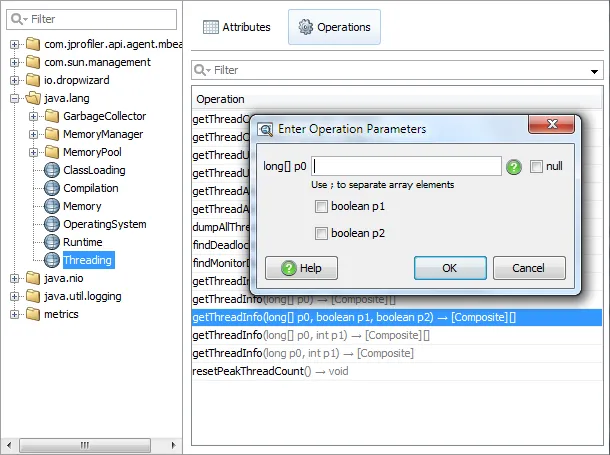
All operations that have parameters of simple types or their arrays can be invoked from JProfiler.
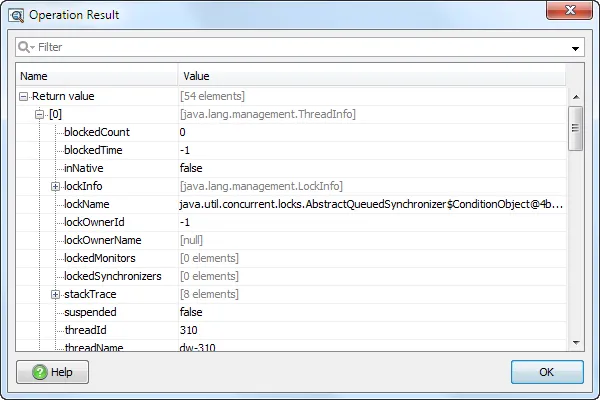
The returned result of the MBean operation can have a composite or tabular data type and is shown in the same structured format as
the MBean attributes.
For single string return values, a text area is shown which is convenient for many operations.
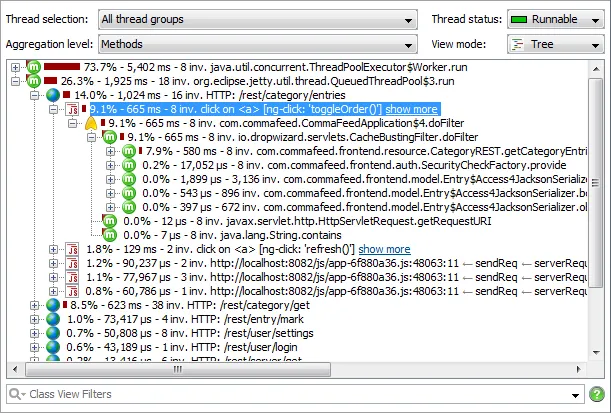
Tracking of Javascript XHR calls from the browser to a profiled JVM. If you install and activate the
JProfiler Origin Tracker extension
in Google Chrome, JProfiler will split the call tree for each distinct JavaScript XHR stack trace.
The JavaScript splitting node shows event name and element name with important attributes that help you pin down
the source of the event. If no event is in progress, like in a call to setTimeout(), the last few stack frames are
displayed inline.
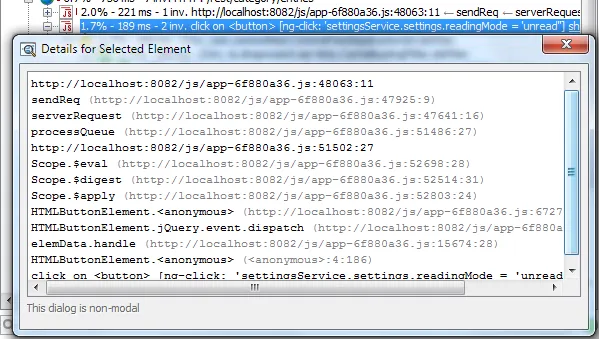
The "Show more" hyperlink opens the node detail dialog. Here, you can inspect the entire stack trace at the time
that the XHR call was made.
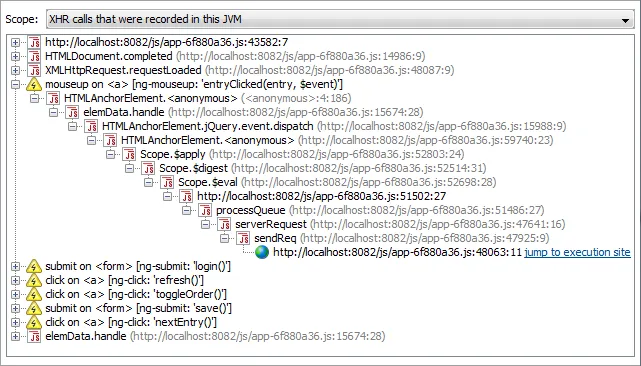
In addition, a dedicated JavaScript XHR view in the CPU section shows you the call tree of all XHR calls
that were handled by the profiled JVM with event nodes at the top of the tree.
The leafs are the functions where the XHR call is made, and the "Jump to execution site" hyperlinks take you to
the appropriate JavaScript splitting node in the JVM call tree view.
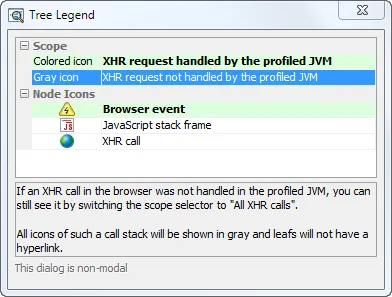
As for all tree views, consult the interactive tree legend to learn more about the different types of
nodes in the tree.
The JProfiler Chrome extension communicates with a JProfiler instance that is running on the same machine.
The profiled backend can run on a remote machine. No configuration is required and the association with the
profiled JVM is made automatically.
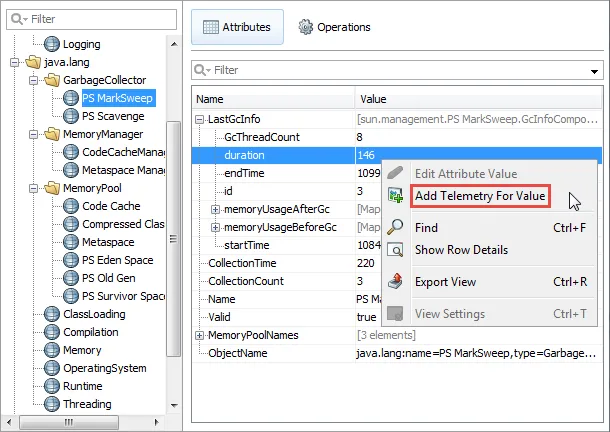
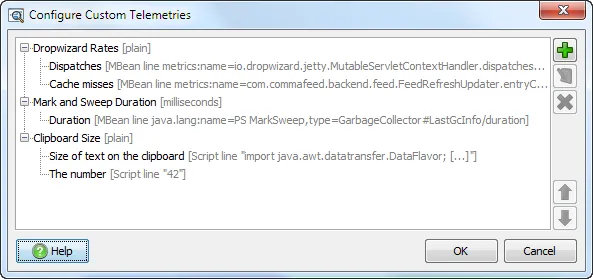
Custom telemetries. In addition to the pre-defined system telemetries, you can now define your own
telemetries. There are two types of data sources: Numeric MBean attribute values and scripts.
For MBean telemetries, you can select the desired attribute in the telemetry section or directly in the
MBean browser.
This will add a new custom telemetry view to the telemetry view section with no further configuration required.
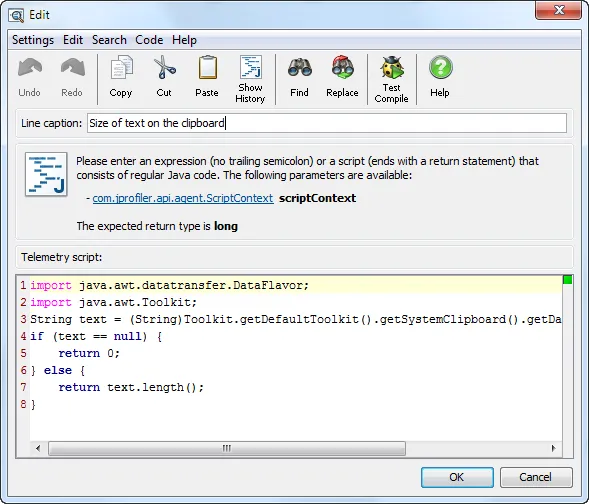
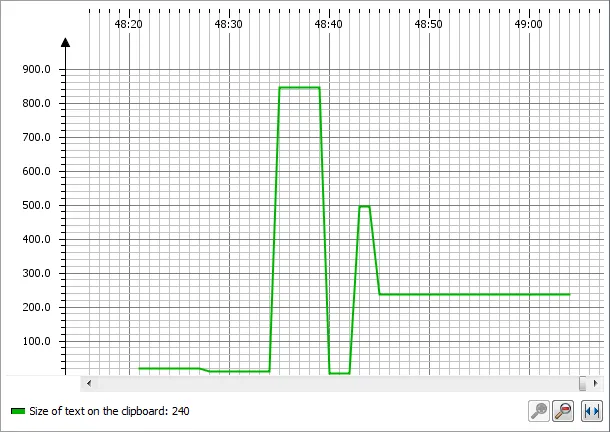
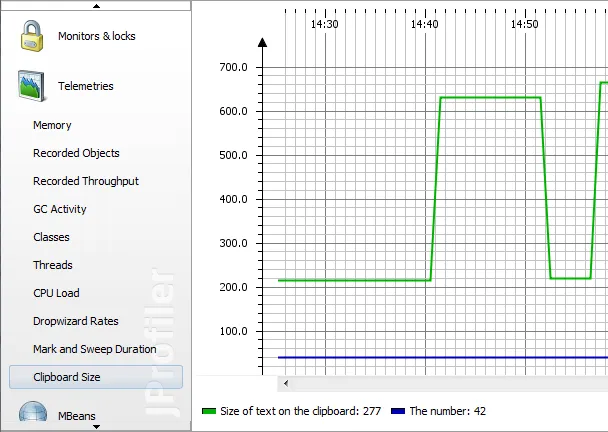
Script telemetries draw their data from a small piece of Java code that you enter in the JProfiler GUI.
Typically, you will access static methods in your code. The script is polled once per second.
Below, the length of the text in the clipboard is plotted.
For script telemetries, you have to enter a line name, but beyond that no further configuration is required.
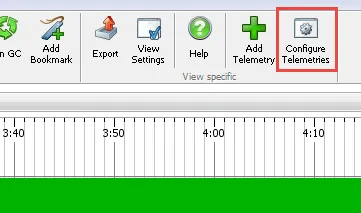
In the telemetries section, the tool bar has a button for editing the configured custom telemetries.
You can collate multiple lines into a single telemetry or edit the definition of the telemetry lines.
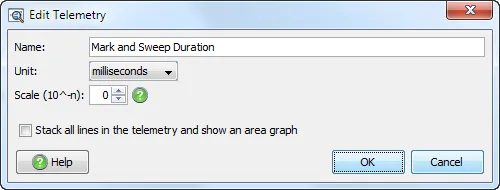
Editing the telemetry view nodes gives you options for specifying a unit, scaling all values or stacking
multiple lines.
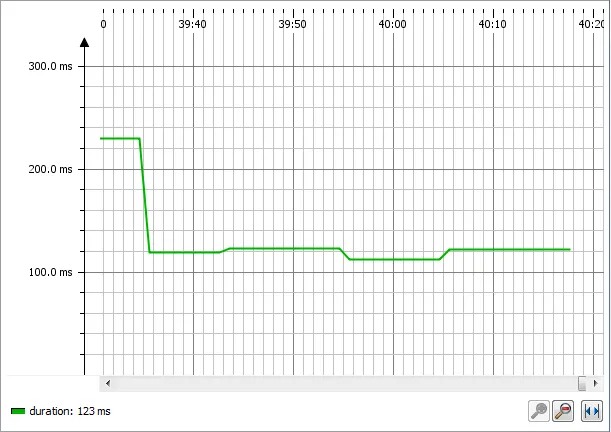
Custom telemetries appear in the sidebar in the telemetries section and have all the same functionality as
the standard telemetries, including bookmark display, zooming, automatic data consolidation and export to HTML and CSV.
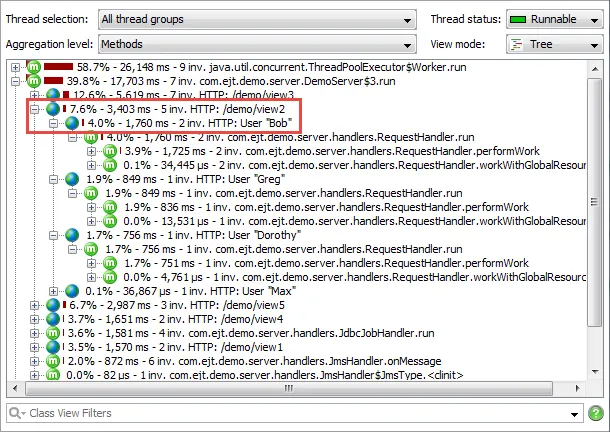
Multi-level HTTP call tree splitting. Since JProfiler 4.0, the call tree is split for each distinct
URL, with the actual definition of the URL string being configurable in the servlet probe.
JProfiler 9.0 takes URL splitting to a new level: Now you can have an arbitrary number of splitting levels
with freely configurable scripts that have access to the HttpServletRequest object.
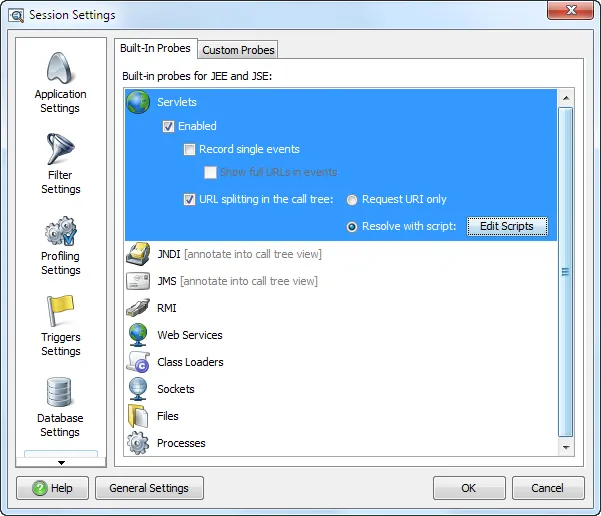
By default, JProfiler splits by the request URI only, without including parameters. The configuration of
URL splitting is available in the session settings, on the "JEE & probes" tab.
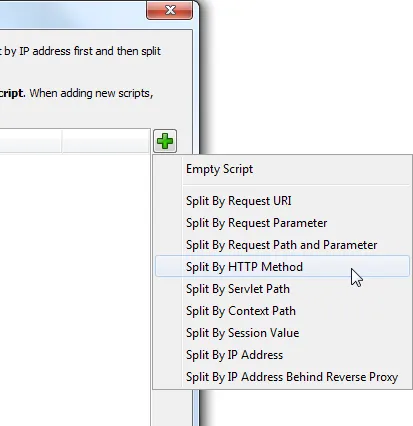
For the script splitting mode, JProfiler suggest a number of script templates for useful splittings,
for example splitting by session ID, by remote IP address or by a URL parameter.
From those starting points you can edit the scripts to match your particular use case.
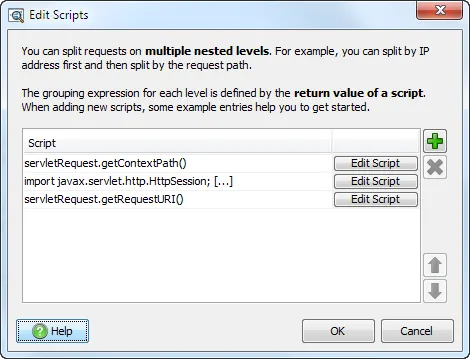
Multiple splitting levels are useful if you want to consider several dimensions separately.
For example, you might first want to split by the context path to separate deployed applications,
then by the user name saved in the HTTP session and finally by the URL.
In the call tree, splitting nodes are recognizable by their special icon and show the return value of the script
that created them.
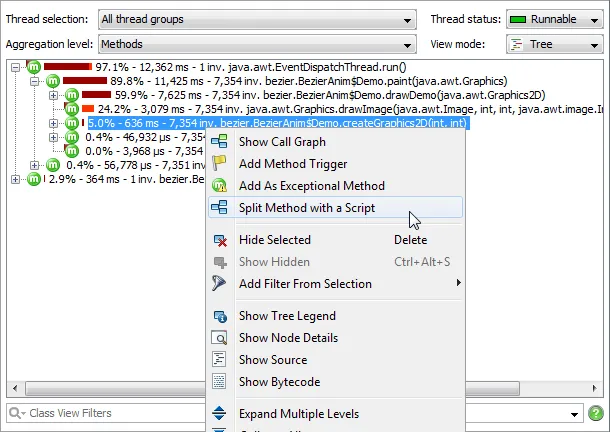
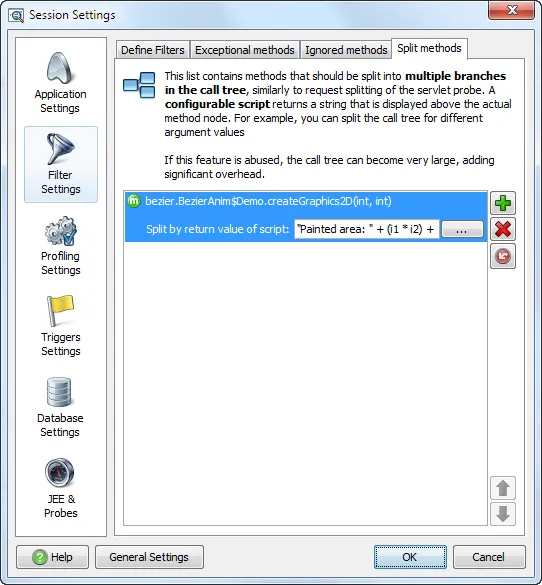
Method splitting in the call tree. Often, the performance characteristics of a method differ wildly
depending on the argument values that are passed to it.
Previously, you could only see the cumulated numbers for all invocations in the call tree. Now, you can select
any method and split it with respect to the return value of a script that can access all method parameters.
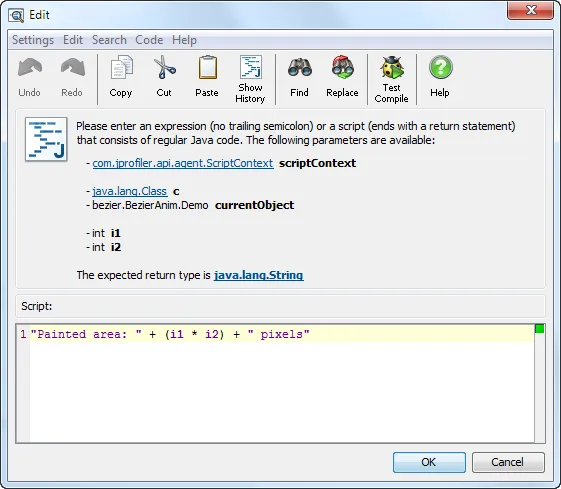
In the screen shot below, you see a script that splits the call tree by the product of the two integer arguments
Should you need to save state between subsequent invocations of the script, you could use the "scriptContext"
parameter which is new for all scripts in JProfiler 9.0.
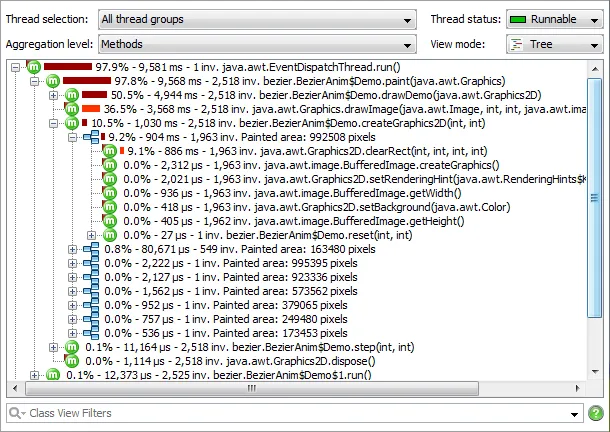
In the call tree, below the select method, splitting node are inserted that have a special icon and show the
return value of the splitting script.
The method splitting configuration is persistent and can be edited on the "Filter settings" tab of the session
settings.
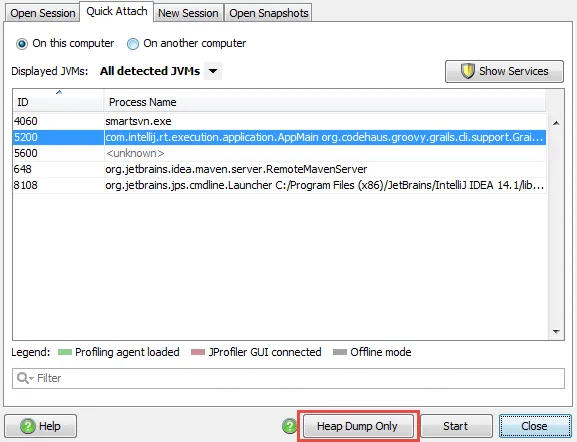
Heap dump only in quick attach. Sometimes you only want to take an HPROF heap dump of a running JVM
instead of attaching the profiling agent to it. Among other things, the HPROF heap dump can be taken quite a bit faster
than a heap dump by a JVMTI profiling agent.
Previously, you could use the jpdump command line executable for that purpose and then open the
saved snapshot in the JProfiler GUI. Now, the quick attach dialog has a new "Heap dump only" button that allows
you to directly take and load the snapshot for the selected JVM.
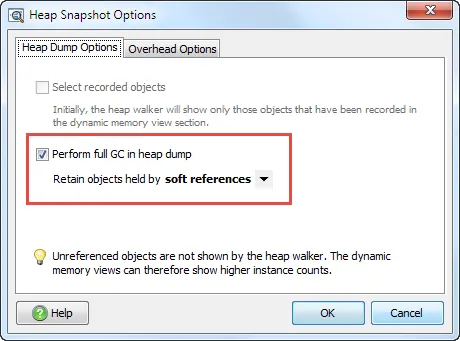
Configurable retaining reference types in the heap walker. Previously, the heap walker
had an option to keep objects retained by weak references. The term "weak references" included soft, weak and
phantom references.
In JProfiler 9.0, the retaining reference types can be configured separately in the heap walker options dialog that is
displayed each time before taking a heap snapshot. Trigger actions and API methods have received corresponding
enhancements. The default setting is now to retain objects that are held by soft references.
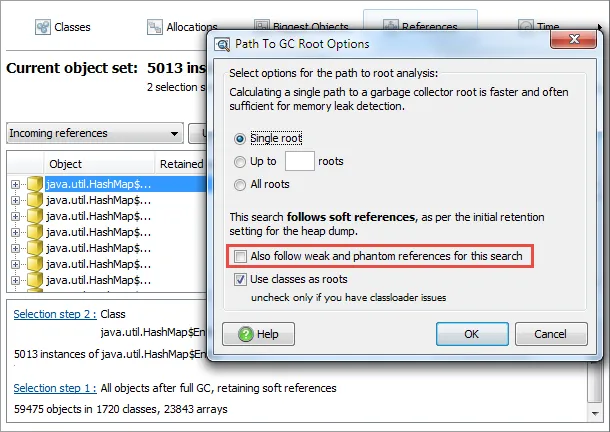
The retaining types are mentioned in the first selection step. When searching for paths to GC roots in the incoming
reference view, a new option has been added for considering the reference types that did not retain objects
during the initial analysis.
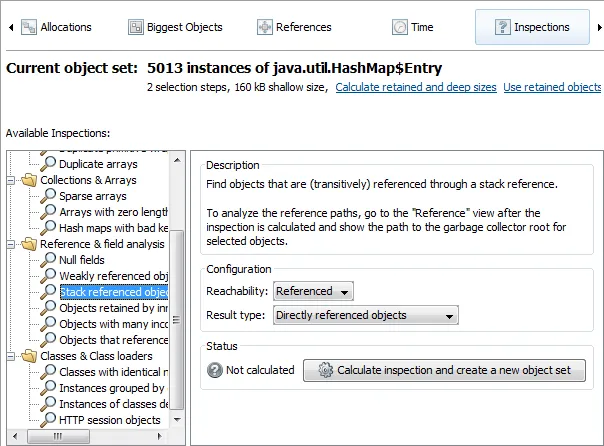
Improved reference inspections. A "Stack referenced objects" inspection has been added that allows you
to find objects that are referenced or retained by a stack reference.
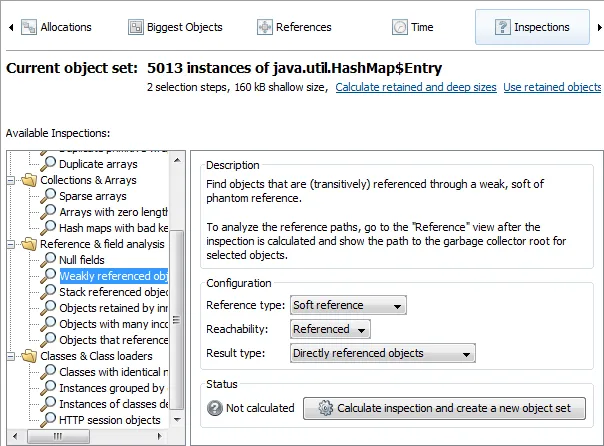
The "Weakly referenced objects" inspection has been improved with the "Reachability" and "Result type" options.
For example, it is now possible to find all objects that have been retained in the heap dump by soft references by
setting the reachability of the inspection to "Retained".
The "Result type" determines whether the weak reference must directly
reference an object in the current object set or if a transitive reference chain is considered as well.
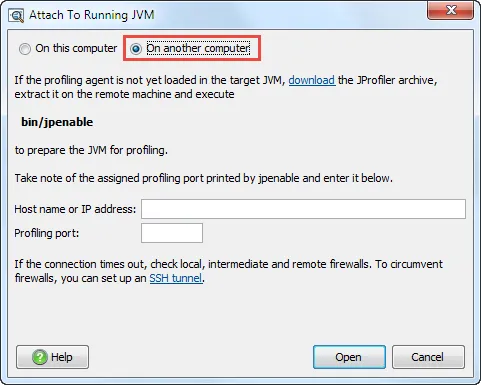
Remote attach option for IDE integrations. IDE integrations have had an "Attach to JVM" feature
for some time, but attaching to a remote JVM was not possible.
Since JProfiler 9.0, the quick attach dialog that is shown after the "Attach to JVM" action is invoked in the IDE,
offers an "On another computer" option that will help you to enable the JVM for profiling and create a remote attach
session in JProfiler.