JProfiler 8.0 introduces the following notable new features:
Tracking of RMI, web service and remote EJB calls between multiple profiled JVMs. Since JProfiler 7, there
has been support for tracking calls between threads, such as for the executor and AWT event dispatch mechanisms.
JProfiler 8 adds support for tracking remote calls between two JVMs. Besides calls via RMI, JProfiler supports
all web service calls through implementations that are supported by the web services probe as well as remote
EJB calls for JBoss 7.1+ and Weblogic 11+.
For outgoing remote calls, JProfiler adds a hyperlink into the call tree. This is called the call site
and due to the merged nature of the call tree there can be multiple call sites associated with a single method node.
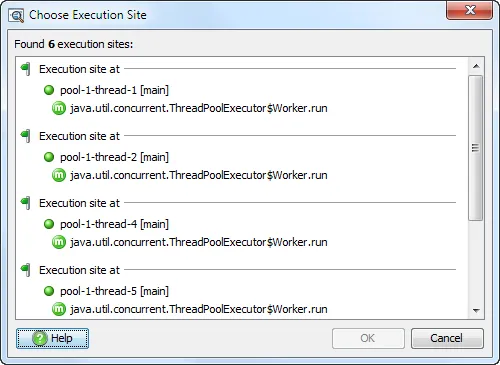
Clicking on the hyperlink in the call site takes you to the execution site. For remote calls,
the execution site is usually in a different JVM. A profiling session of that JVM must be opened in a separate
JProfiler window. This works with live profiling sessions as well as snapshots.
Execution sites are bound to a specific thread.
Multiple calls may be handled by different threads, so in that case JProfiler will ask you for the desired
execution site.
Execution sites are captured in separate container nodes in the call tree and correspond to exactly one call site.
With this splitting of the call tree you can follow a call from the client to the server and investigate it
separately.
The hyperlink on the execution site takes you back to the call site. The description of the execution site for
a remote call contains a VM ID. This ID shows you from which JVM the call originated.
Internally, VM IDs are UUIDs,
but to make it easier to work with them, JProfiler translates them to small numbers that are consistent as long the
JProfiler GUI is open. The status bar now shows the VM ID of the profiled JVM.
NoSQL and big data. JProfiler 8 adds probes for a number of databases:
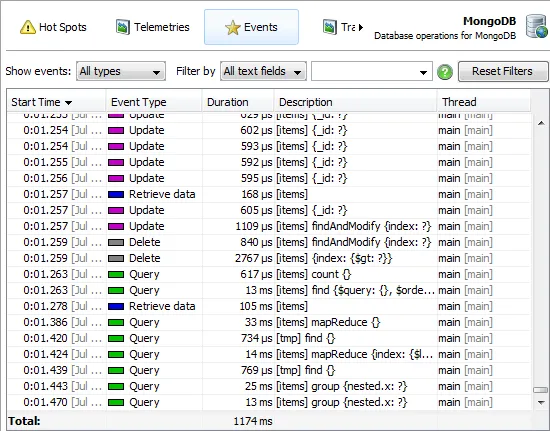
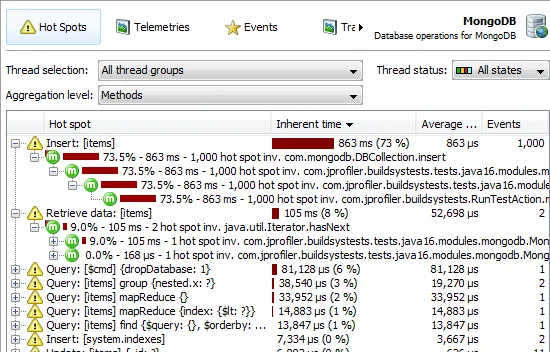
The MongoDB probe shows database operations grouped into the categories "Query", "Retrieve data", "Update",
"Insert" and "Delete". Primitive data is replaced by question marks in order to conserve memory and to provide
a basis for building a list of hot spots. For the events view, the MongoDB configuration in the session settings
has an option to keep primitive data.
In the "Hot spots" view of the probe, events with the same description are grouped and you can open the cumulated
back traces below the top-level nodes.
The MongoDB probe works with the official MongoDB driver starting with version 2.11 and higher.
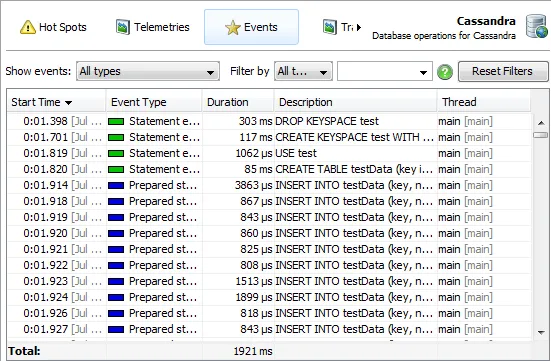
The Cassandra probes shows CQL queries. Similar to JDBC, the probe has the event types "Statements" and
"Prepared statements". Bound data for prepared statements is not recorded by JProfiler.
The Cassandra probe is supported for Cassandra 1.2 and higher.
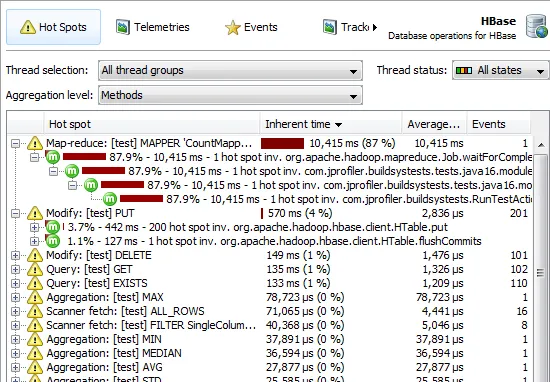
Finally, the HBase probe records a variety of operations, resulting in the event types "Scanner open",
"Scanner fetch", "Query", "Modify", "Map-reduce" and "Aggregation".
The Hbase probe is known to work with Apache HBase 0.92 and higher.
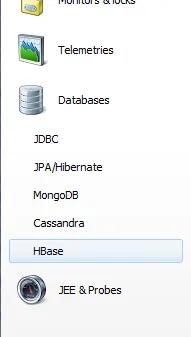
All database related probes, including the JDBC and JPA/Hibernate probes have been spun out into a separate
"Databases" section. They also have separate entries in the settings dialog and the session startup dialog.
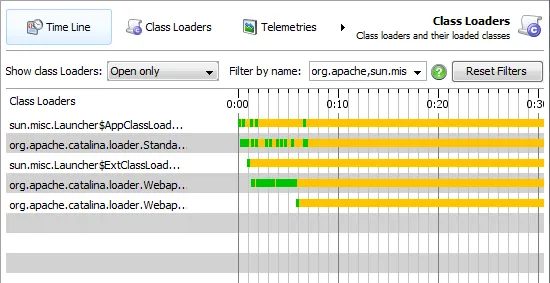
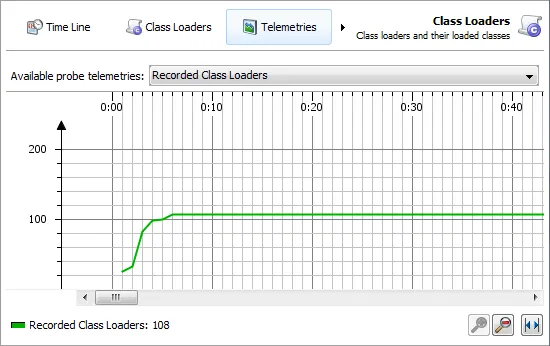
The class loader probe shows all classloaders in the VM and provides insight into their activity.
The time line view shows you the lifetime of class loaders and the points in time where classes were loaded.
You can use bookmarks to correlate times with other views that have a time axis.
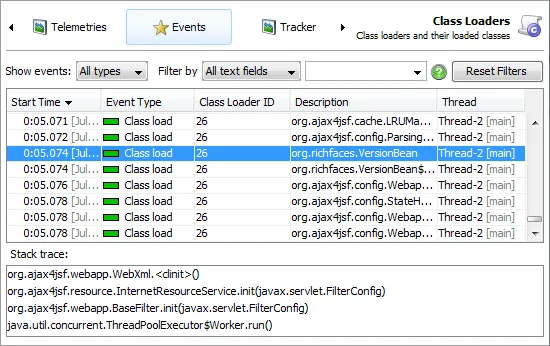
Single class load events and their call stacks can be inspected in the events view of the probe. Besides
text-based filtering you have the options to restrict events to classloader creation, class loading or class GC
events.
Just like other probes, the class loader probe also shows a number of aggregate time-resolved statistics, such as
the total number of recorded class loaders.
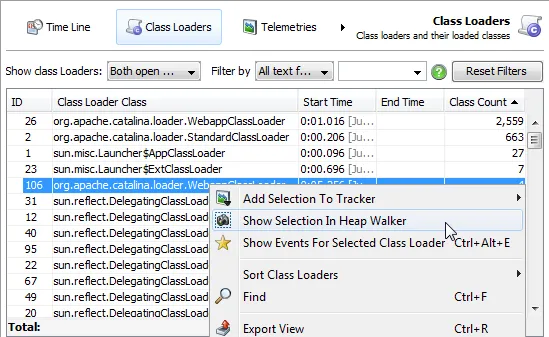
In the "class loaders" view of the probe that shows all class loaders and their statistics in tabular form,
you can choose to jump to the heap walker in order to start investigating a class loader memory leak.
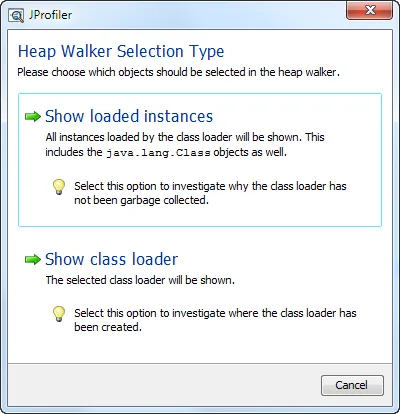
While you can also choose to show the selected class loader instance, the more common problem is to show the
loaded instances which prevent the garbage collection of a class loader.
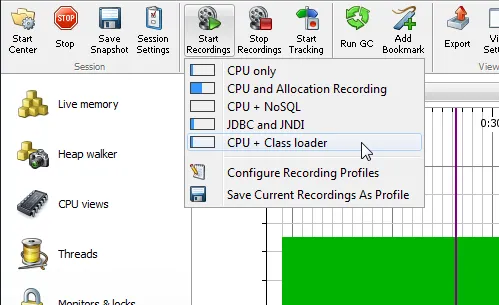
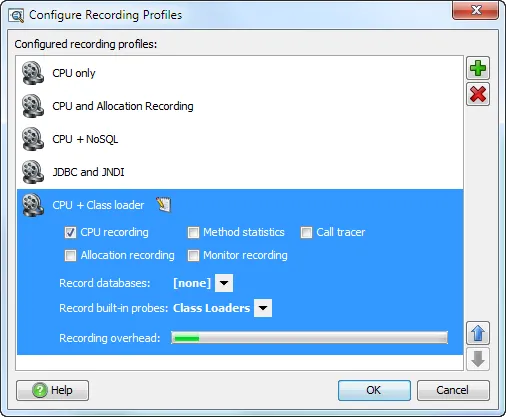
Recording profiles. To keep overhead at a minimum, it is essential to only record data that you are
interested in for your present use-case. Previously, there was no way to easily activate a pre-defined set of
recording types with a single click. Recording profiles in JProfiler 8 solve this problem.
In the tool bar, the "Start Recordings" button shows you a drop-down of configured recording profiles with an
overhead indicator. It also allows you to create a new recording profile from the presently active recording types.
When you configure the recording profiles, you can add new profiles and change the order in the drop-down.
The overhead indicator is only an estimate, the actual overhead depends on the runtime characteristics of the
profiled application.
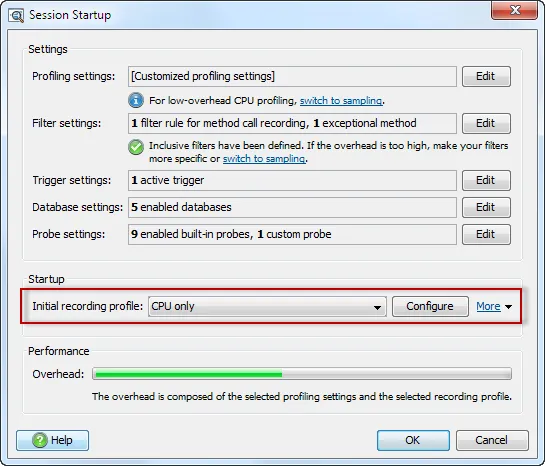
Instead of the previously available options for initial recording of CPU and allocation data, the startup dialog
now shows you a drop-down for the initial recording profile. This enables you to start any recording type at startup.
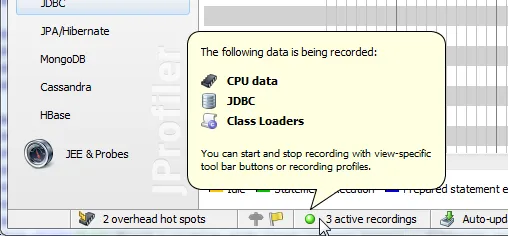
The status bar now shows the number of active recording types. To see which recording types are currently active,
you can now hover over that part of the status bar.
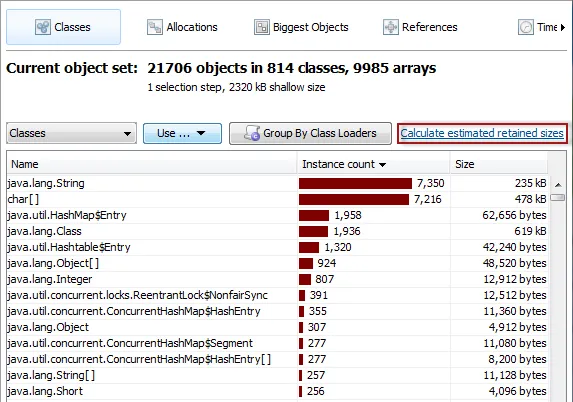
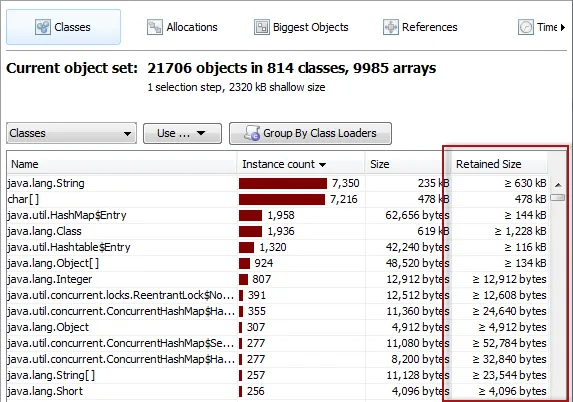
Retained size calculation enhancements in the heap walker. The classes view of the heap walker now has
a "Calculate estimated retained sizes" action to calculate a lower bound for the retained sizes of all classes.
The retained size of a class is the amount of memory that would be freed by the garbage collector if all instances
of that class were removed from the heap.
After the calculation is complete, a new column is added to the classes view.
Previously, you would have had to create a new object set for each class and calculate the retained size for the
object set.
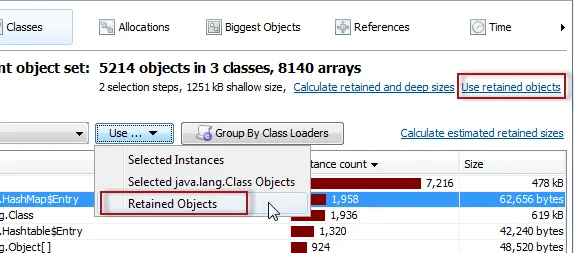
In addition, there is now an action for using the retained objects for the entire object set and the classes view
features an action to select retained objects for the selected classes.
Major performance improvements in the probe system. The backend of the probe system has been rewritten to
minimize CPU overhead, memory allocations and synchronized calls.
Support for profiling Java 8. All features in JProfiler are now supported for the current state of Java 8.
We will track the remaining changes closely as new builds become available.
At the same time we have removed support for profiling Java 1.4. Java 1.4 used an experimental
profiling interface (JVMPI) whose drawbacks prevented us from moving forward in a couple of areas,
most notably for the performance improvements in our probe system that are mentioned above.
JProfiler 7.2 continues to be available for profiling Java 1.4, free downgrades are available for new purchases.
Support for reading PHD files. If you are working with an IBM JVM, you may be in a position that the only
way to get more information about a memory leak is a PHD file (similar to an HPROF file from the Hotspot JVM).
Since JProfiler 8, JProfiler can now read this file format and display it in the heap walker.
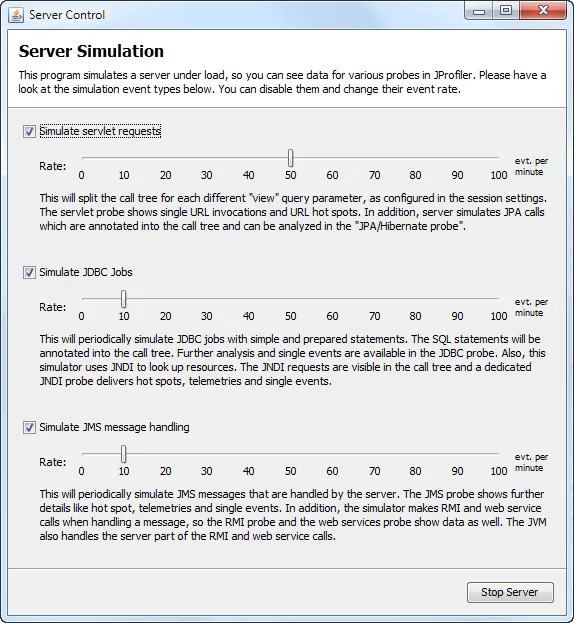
Last but not least, we have added a new demo session, called "Demo server". This is a mock server application
that generates profiling data for a lot of the probes in JProfiler so you can explore the functionality of JProfiler
with it.