JProfiler 7.2 introduces the following notable new features:
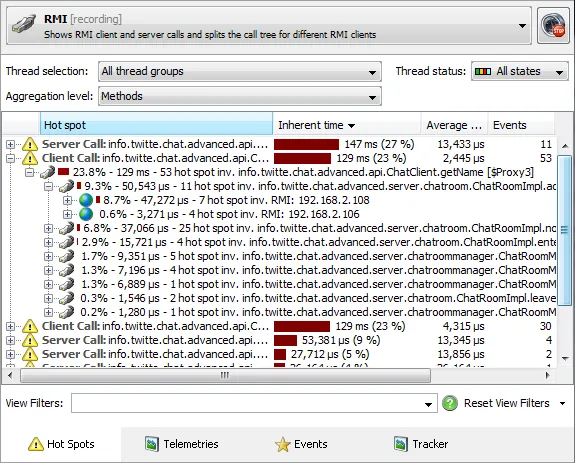
An RMI probe. The hot spots view of the RMI probe shows both RMI server calls and RMI client calls with
their back traces. The screen shot below shows an expanded RMI client call which in turn was initiated by RMI server
calls from two different IP addresses.
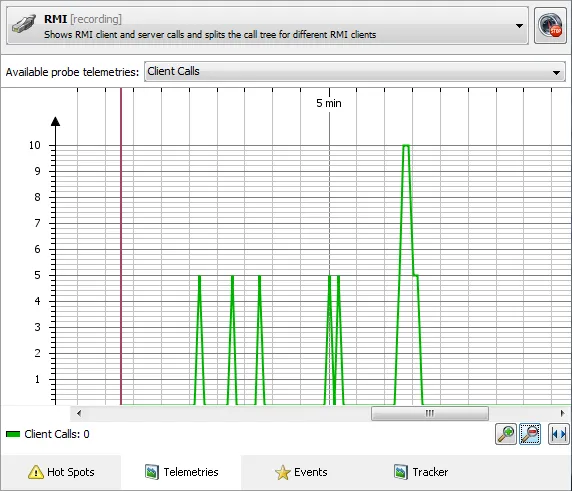
The telemetry view shows the number of client and server calls, as well as their average durations.
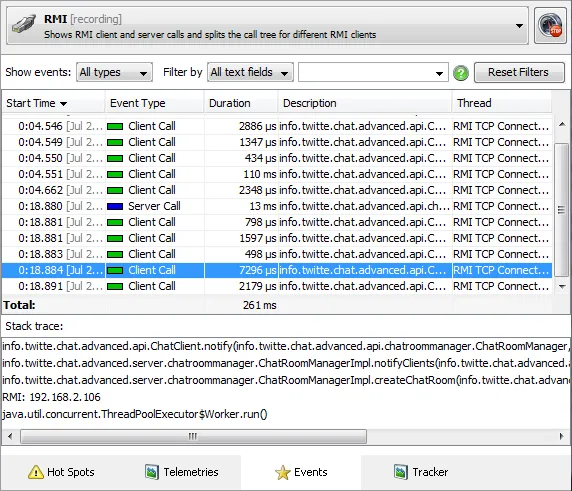
If enabled, single calls are resolved in the events view of the probe:
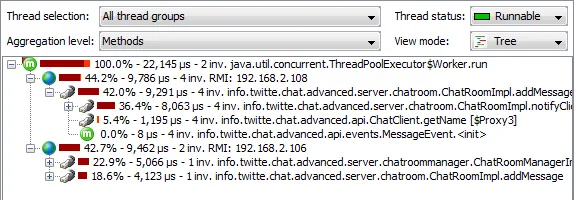
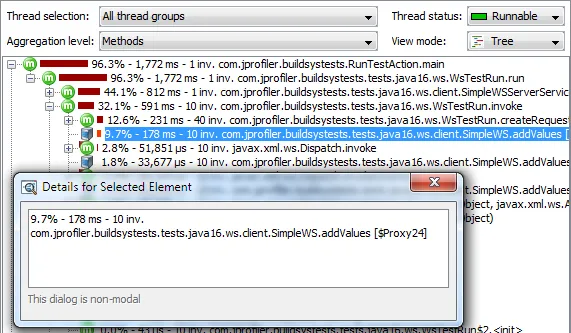
RMI implementation classes and proxies are shown with a special icon in the call tree.
Calls from different IP addresses are split in the call tree. For client calls, instead of the
nondescript proxy classes, the interface names are shown.
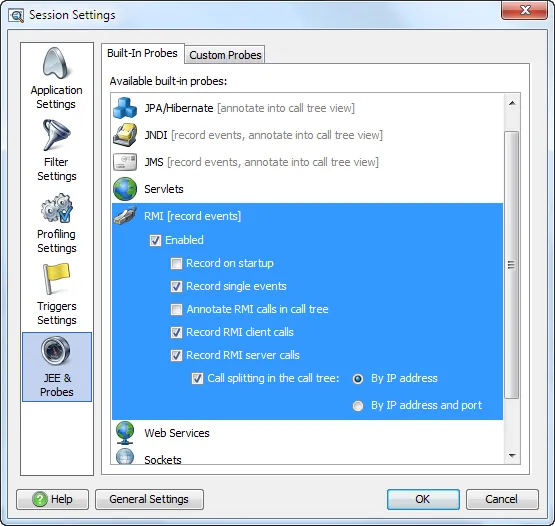
In addition to the common configuration options for all probes, you can choose if only server or client calls
should be recorded and how the call tree should be split for server calls.
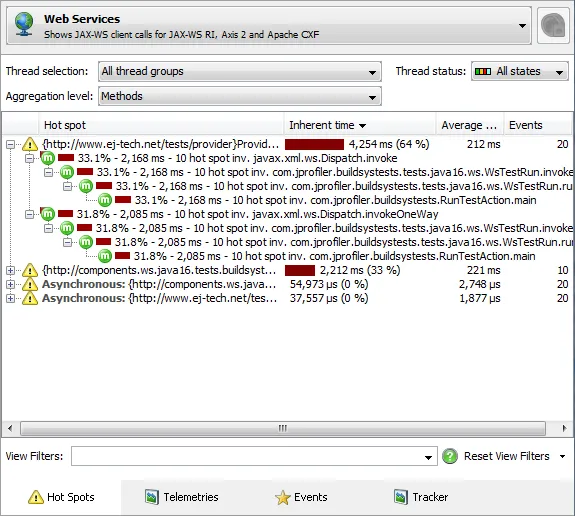
A web services probe. The probe shows client calls for JAX-WS-RI, Axis 2 and Apache CXF. Since server calls
are already handled by the servlet probe, they are not shown by the web services probe. As with RMI client calls,
web service calls in the JVM are made to proxy classes that do not give you any information about the actual web service.
JProfiler replaces the proxy class names with the interface names and gives the call a special icon as shown below.
In the hot spots view of the probe, the QNames of the web services are shown. This information can also be shown
in the call tree if you configure the probe to annotate web service calls into the call tree.
Just like the RMI probe, the web service also shows telemetries and single events.
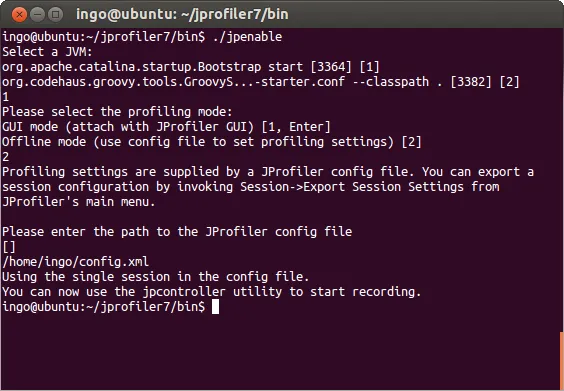
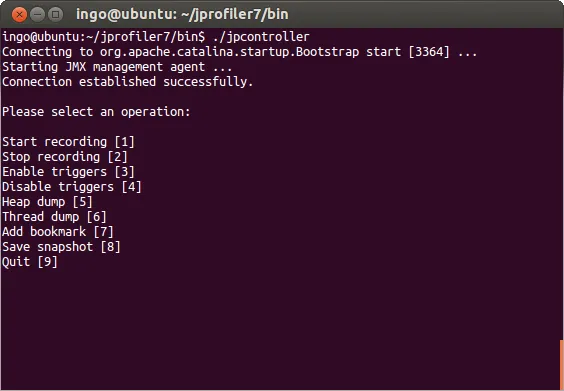
Offline profiling with jpenable allows you to take an unprofiled JVM and profile it without using the
JProfiler GUI. Previously, the command line utility jpenable could already prepare an unprofiled process for profiling.
However, you had to (remotely) connect with the JProfiler GUI to record and save profiling data.
Starting with this release, jpenable will ask you whether you want to enable GUI or offline mode. In offline mode,
you have to specify a config file with the profiling settings.
Then, you can use the command line utility jpcontroller to record and save profiling data.
In addition, command line options have been added, so that jpenable can be run without any user input.
If the config file with the profiling settings contains appropriate triggers, you can use it to automate
on-demand profiling without any user interaction.
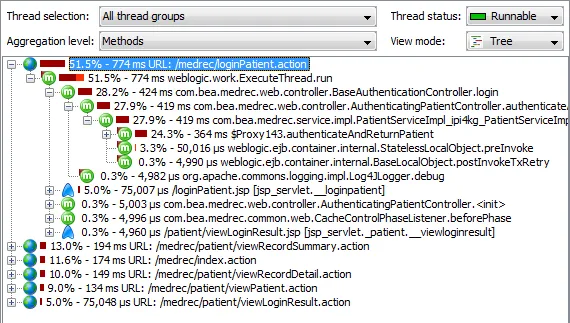
URL splitting now also works with sampling. Previously, you had to use the instrumentation CPU profiling mode
to get URL splitting in the call tree view. In this release, call tree splitting has been implemented for the low
overhead CPU profiling mode where call stacks are sampled. This also applies to the new splitting for RMI server calls
(see above).
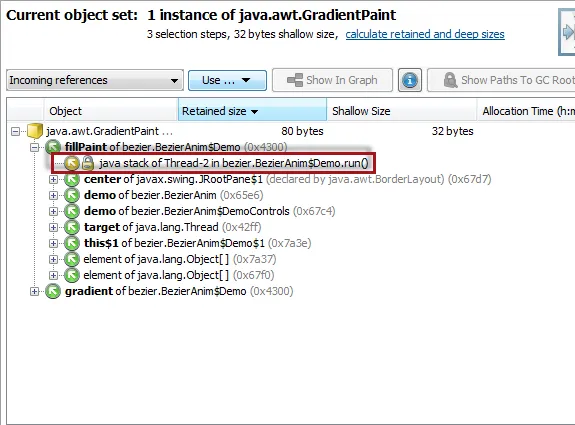
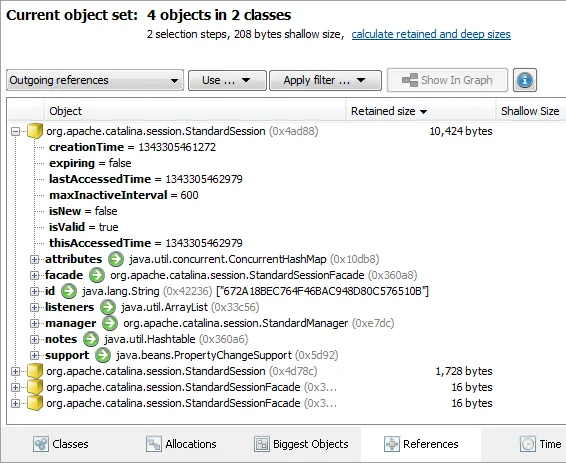
Improvements in the reference views of the heap walker. Previously, incoming references from the stack were only
shown as "java stack". This release adds thread and method information which help you solve stack-related memory
leaks much more quickly.
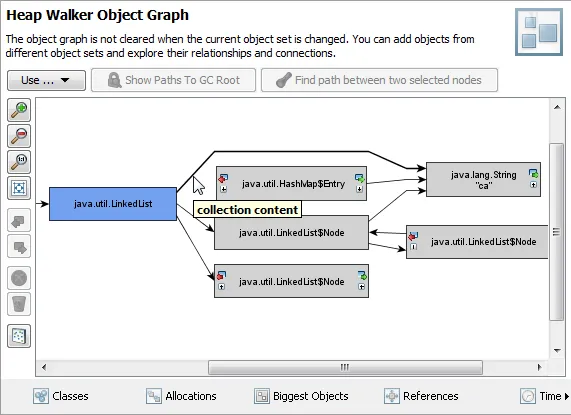
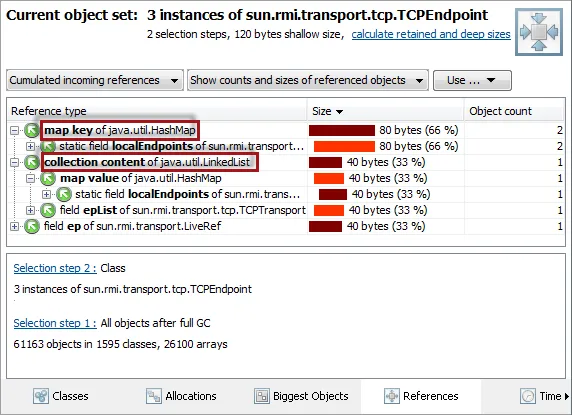
Up to now, linked lists could be a big problem when searching for memory leaks. The chain of incoming references
through a linked list scales with the size of the linked list and could make working with reference trees
or graphs next to impossible. JProfiler 7.2 introduces compact paths for some well-known collections with an
internal reference structure. For linked lists, the "collection content" reference shown in the screen shot points
directly from the linked list to the list item. If you search for paths to garbage collector roots, the found paths can
now be interpreted much more clearly.
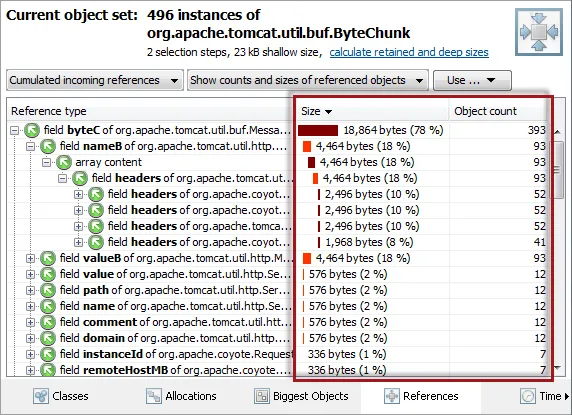
Compact paths are also shown for hash maps and tree maps. This is especially important in the cumulated incoming
reference view, because the internal reference structure of those collections could fragment collection content
into many blocks, thereby preventing a comprehensive analysis of the incoming references.
Also, hash maps are very common in reference chains and the "map key" and "map value" nodes are much more descriptive
than the internal structure.
Finally, the cumulated incoming reference view now shows object counts, sizes and percentages that refer to the
top level entry. Previously, each level was treated like a new independent object set. This change makes it
much easier to analyze what percentage of the current object set is held through a particular chain of
references.
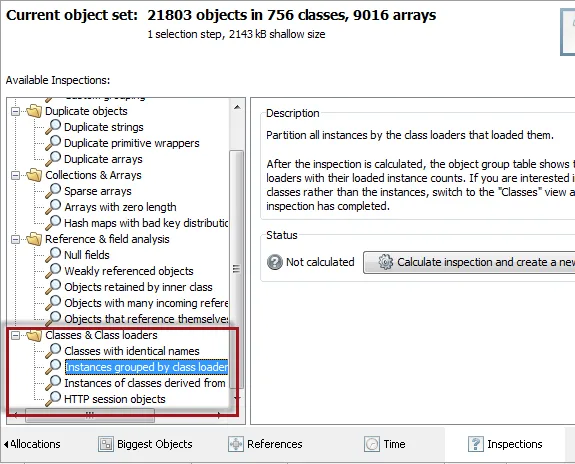
New inspections for class loaders and class inheritance have been added to the heap walker.
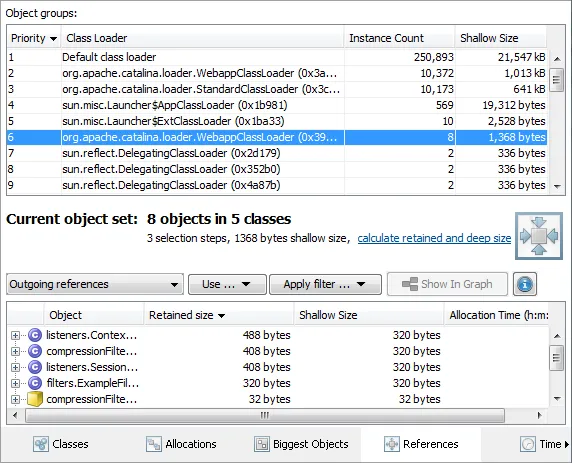
The "Instances grouped by class loader" inspection groups the current object set by the class loaders of each
instance's class. This is of great help when analyzing class-loader related problems. For example, by executing
this inspection on the entire heap, you can quickly get an overview of what class loaders are active and
how many associated instances are on the heap.
The "Instances of classes derived from specific base class" inspection lets you select a class or an interface and gives you
all instances of implementing or derived classes, something that was not possible before. As a convenience, we
have added the "HTTP session objects" inspection which selects all classes that implement javax.servlet.http.HttpSession.
This gives you quick access to all session objects without having to know their class names.
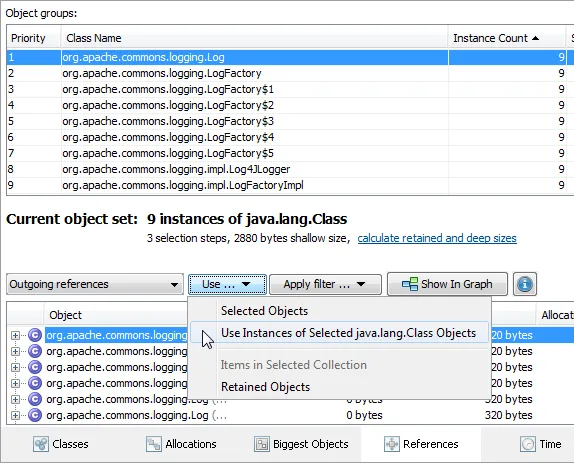
The "Classes with identical names" inspection selects all java.lang.Class objects of classes with the same name
that exist in the current object set. By default, this inspection takes you to the outgoing references view where
a "Use instances of selected java.lang.Class objects" action was added in the release. This complements the already existing actions that
go from instances to their java.lang.Class objects.
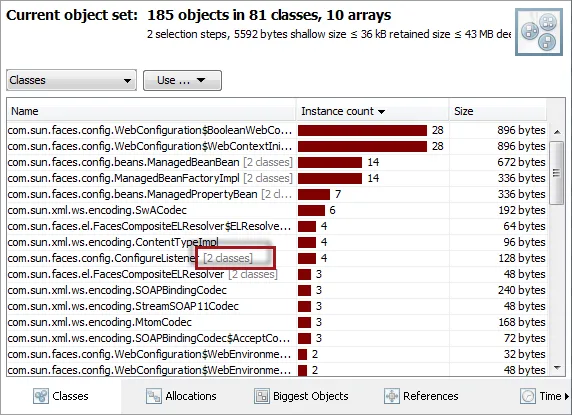
On a related note, JProfiler now groups classes with the same name and shows the class count in brackets after the
class name. This applies to the classes view in the heap walker and the "All objects" and "Recorded objects" view
in the dynamic memory views.