JProfiler 7.1 introduces the following notable new features:
A
JPA/Hibernate probe. If you're profiling an application that uses JPA or Hibernate, your productivity
and insight into the runtime characteristics will be increased substantially by this new probe. The following
providers are supported:
- Hibernate 3.x and 4.x
- EclipseLink 2.3+
- OpenJPA 2.1+
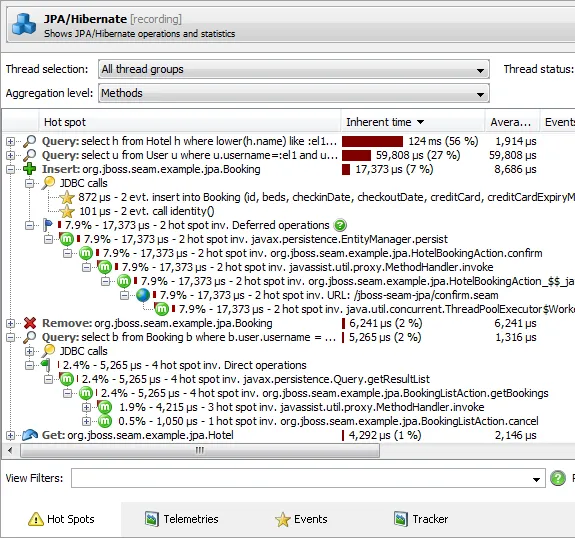
The probe shows hot spots, telemetries and single events. Instead of looking at convoluted JDBC statements, you
can directly see the JPA/Hibernate operation types such as "Query", "Criteria", "Get", "Update", "Remove" or
"Collection update" with meaningful descriptions:
The hot spots view shows the back traces if CPU recording is enabled. Many operations such as inserts are deferred
by JPA and Hibernate and are only executed when a "flush" occurs at a later time. The stack trace of the flush is
arbitrary and does not help you to diagnose problems. Because of this, the JPA/Hibernate probe remembers
the stack trace when the entity was acquired (for existing entities) or persisted (for new entities)
and shows it under a "Deferred operations" node. Operations that are executed immediately, such as queries,
are shown under a "Direct operations" node.
To correlate a JPA/Hibernate operation with the resulting database operations, the associated JDBC statements
are shown in a "JDBC calls" node below the hot spot. The JDBC probe has to be recording data for this feature.
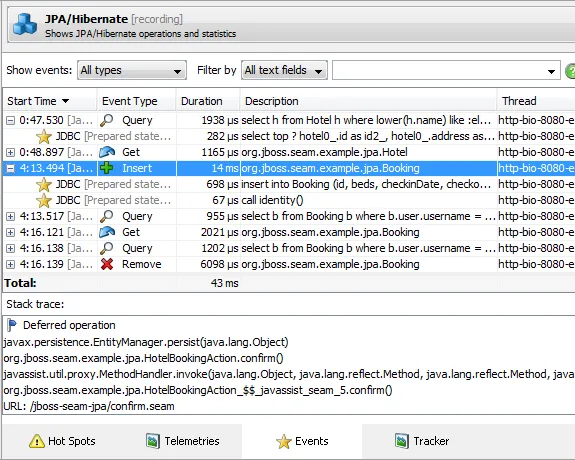
The events view gives you a chronological perspective on all JPA/Hibernate operations that were recorded:
You can open each event to see the associated JDBC statements, and the stack trace of the operation will be
shown below.
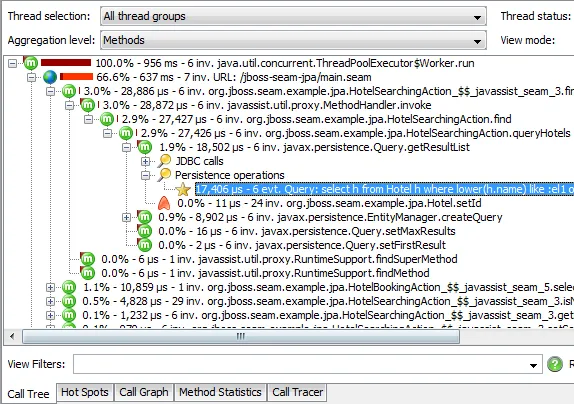
As for the JDBC probe, the JPA/Hibernate probe is configured by default to annotate persistence operations
into the call tree view:
The
probe tracker is a new view for all probes. It allows you to track selected probe measurements
over time:
- You can select one or more hot spots and track their average times or invocation counts
-
You can select one or more control objects and track their event durations or event counts.
Control objects are JDBC connections, files, sockets etc., depending on the probe.
When tracking control objects, event durations or event counts are split by the various event types and stacked in the graph.
Below you see event counts of a selected JDBC connection:
Each probe can track an arbitrary number of selections at the same time. You can switch between your selections
with the drop-down list at the top.
When tracking hot spots, the average times are split by time types (running, waiting, blocking, net I/O) and
stacked in the graph:
While you can add tracking selections directly in the probe tracker with the add button, it is often more
convenient to add them from your selection in the control objects or hot spots views.
For example, you can select two elements in the hot spots view and use the "Add to tracker" tool bar button
to add a new tracking selection for the combined hot spot times.
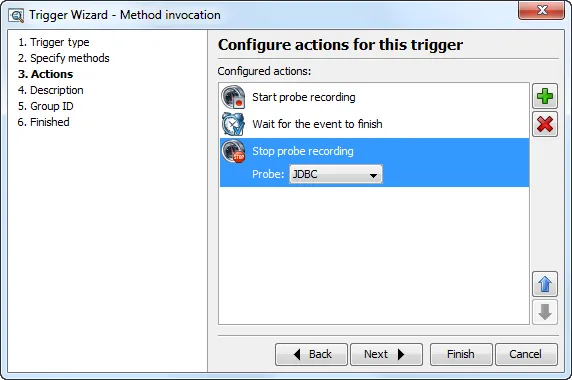
Apart from starting probe tracking in the JProfiler GUI, you can also use the controller API or the
new trigger action to do so:
Previously missing in JProfiler 7 were trigger actions to start and stop probe recording. They
have now been added in JProfiler 7.1:
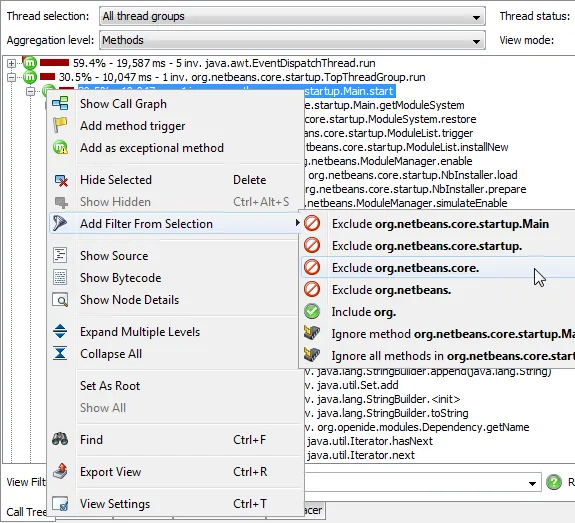
In the call tree, you can now quickly adjust filter settings and ignored methods by
choosing the appropriate entry from the context menu:
The contents of the context menu reflect whether the currently selected class is profiled or not and
what packages are currently in the filter settings. In the above example, "org.netbeans." is an inclusive
filter, and the selected node belongs to the class "org.netbeans.core.startup.Main", so JProfiler suggests
excluding packages below "org.netbeans." at various levels, or to include the entire "org." package.
In addition to modifying filters, you can also add the selected method or its entire classes to the ignored
methods tab of the filter settings (see below).
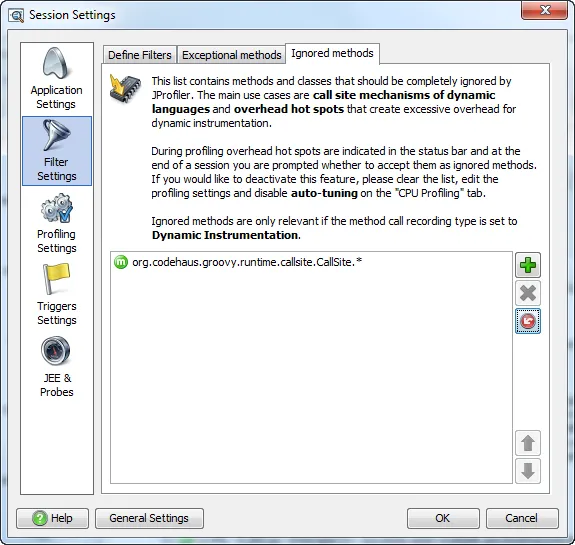
Better support for profiling Groovy and other dynamic languages. Up to now, the call site methods of
Groovy were shown in the call tree, even if you added exclusive filters for the groovy packages. As of JProfiler 7.1,
the "Ignored methods" tab of the filter settings allows to ignore entire classes, which makes it easy to remove all
Groovy call site methods from the call tree.
For new sessions, the default Groovy entry is always enabled. For existing sessions, you can reset the ignored methods.
Why is adding an exclusive filter not sufficient? The first call into unprofiled classes from profiled classes
is recorded and shown in the call tree. Ignoring a method or an entire class totally removes it from the call tree.