What's new in JProfiler 6.2
Change release:
Please see the change log for a detailed list of changes.
JProfiler 6.2 introduces the following notable new features:
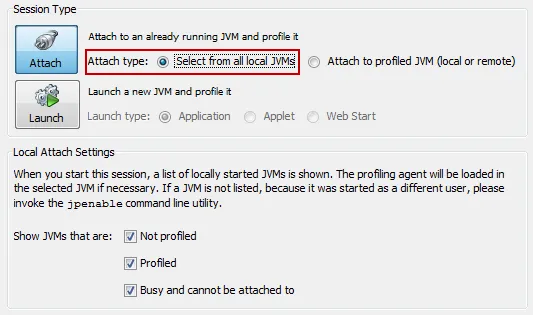
You can now attach the JProfiler GUI to running JVMs that were started without profiling.
For this purpose, the "Select from all local JVMs" session type has been added that holds
profiling, filter and trigger settings for repeatedly profiling the same application.
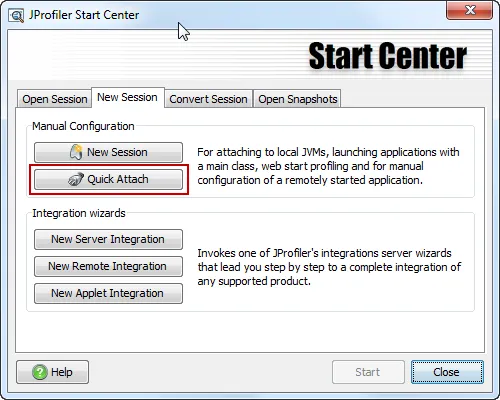
You do not have to create a session to attach to a running JVM, just use the quick attach
feature in the main menu or in the start center.
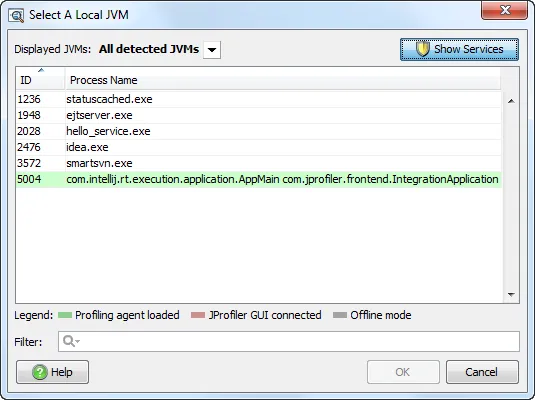
In the selection dialog, all available JVMs are updated in real time and it's also possible
to attach to services.
If you use instrumentation, the PermGen space of the garbage collector may not be sufficient
if you instrument a lot of classes. In that case, JProfiler warns you and gives you a chance
to select narrow inclusive filters.
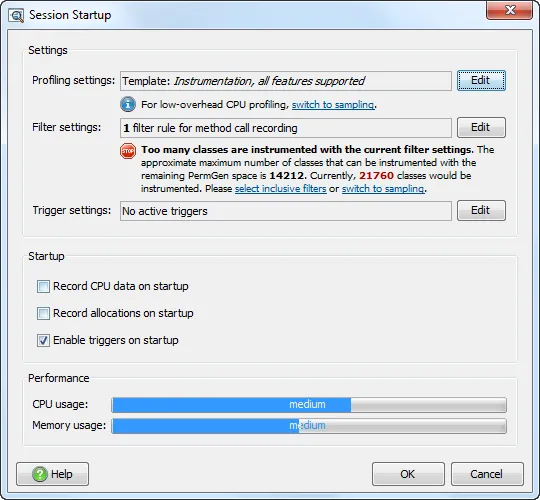
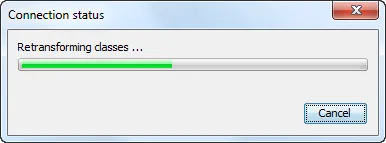
Instrumenting may take some time, so JProfiler informs you about the progress after you confirm the
session startup dialog.
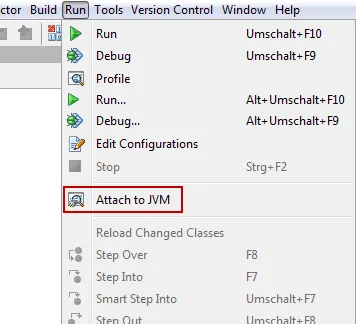
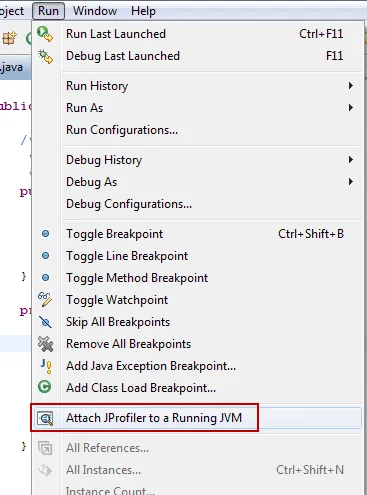
If you need source code navigation from JProfiler into the IDE, you can use the attach actions in the
IDE plugins for JProfiler - see the screen shots for IDEA and eclipse below. This is also useful if you
would like to profile a run configuration type that is not supported by the JProfiler plugin.
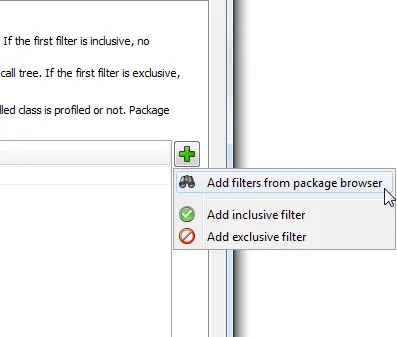
The filter selection in the session settings dialog has been improved. Previously, you had to
enter packages manually, or choose them from the configured class path. Now there is a
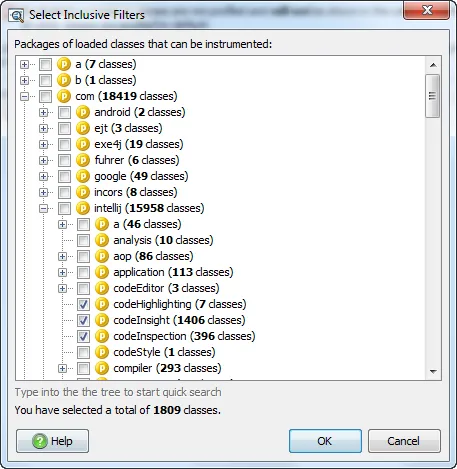
package browser in the filter settings configuration.
The package browser shows you all loaded classes and informs you about the number of classes that
are selected.
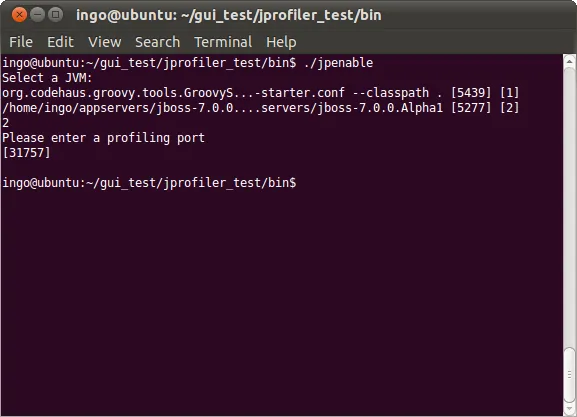
You can now enable any 1.6 JVM for remote profiling. If a production JVM on a server displays
anomalous behavior, use new the jpenable command utility to load the profiling agent.
On your desktop machine, you can then create a remote attach session and profile the JVM.
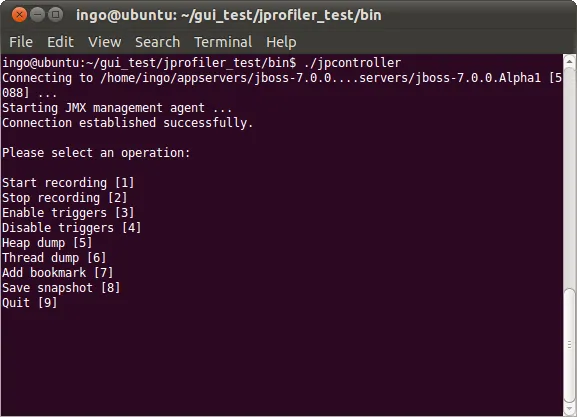
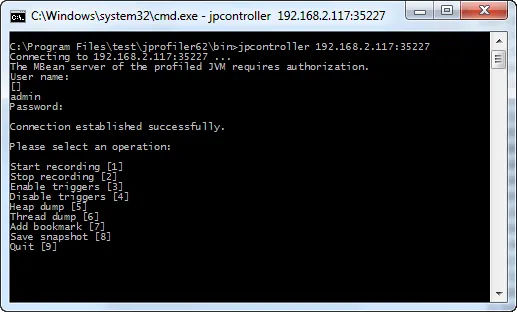
For offline profiling a command line controller has been added. With the jpcontroller
command line utility, you can perform operations that have previously only
been accessible through the profiling API and the JProfiler MBean. This includes
starting and stopping recording of profiling data, enabling and disabling triggers,
taking heap and thread dumps, adding bookmarks and saving snapshots.
This connection can also be made from a remote computer if the profiled JVM has been started with
the VM parameter -Djprofiler.jmxServerPort=[port]. For adding security, pass the VM parameter
-Djprofiler.jmxPasswordFile=[file] with a file that contains key value pairs of the form
user=password.
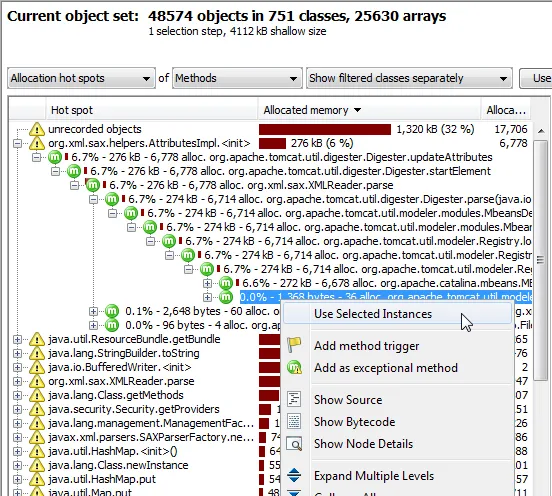
There are now backtraces in the allocation hot spots view of the heap walker, just like in the
dynamic allocation hot spots view. You can select nodes in the back traces and create a new object set with
the objects whose allocations contribute to the hot spot along the selected paths.
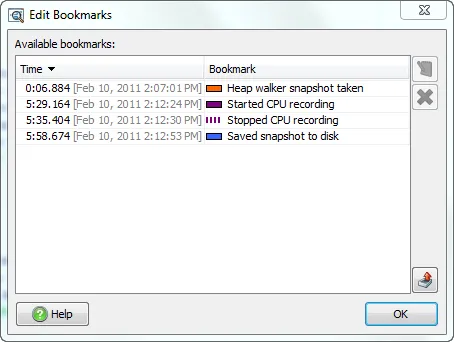
The calendar time is now displayed in various places. If you hover the mouse over views that have a time axis,
the calendar time is displayed in the status bar. For snapshots, the calendar time is shown in the status bar.
Also, the bookmark dialog shows the calendar time of each bookmark.