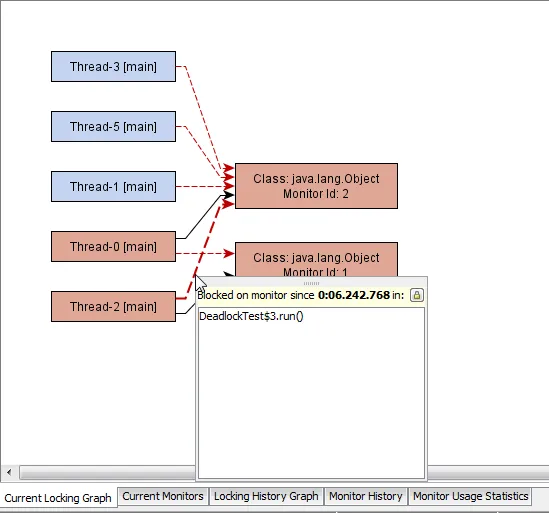
Locking graphs. The monitor analysis in JProfiler was extended with graphs that show the current locking situation and the history of all recorded locking situations. All views that concern monitor analysis are now in their own "Monitor views" section. The current locking graph view shows all threads that are currently waiting or blocking on a monitor as well as those that hold a contended monitor. Deadlocks are visualized with red nodes. Tool tips show times and stack traces.
What's new in JProfiler 6.0
Change release:
Please see the change log for a detailed list of changes.
JProfiler 6.0 introduces the following notable new features:
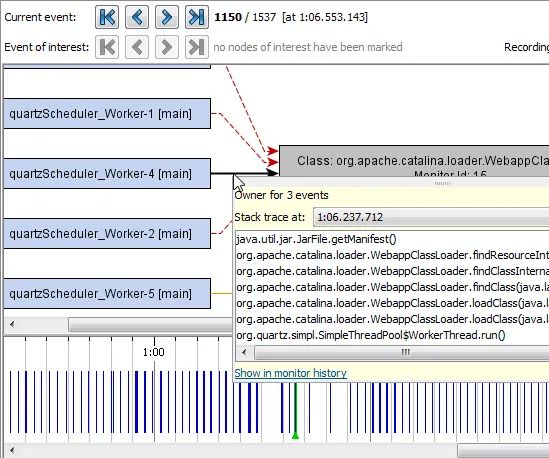
In the locking history graph you can record monitor events and navigate step by step through the recorded locking situations. A time line view at the bottom puts the distribution of events into context and provides an alternative way of navigating to other monitor events.
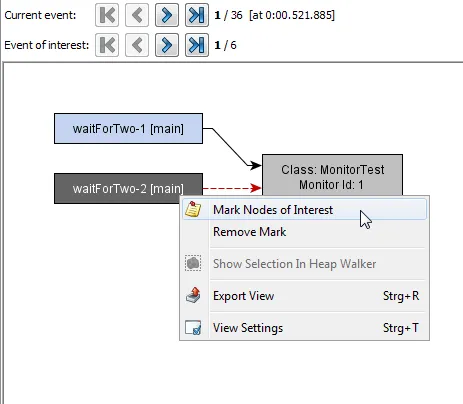
Since there can be a large number of monitor events, you can mark certain threads or monitors as nodes of interest. A separate set of navigation buttons will then only step through events that involve at least one node of interest.
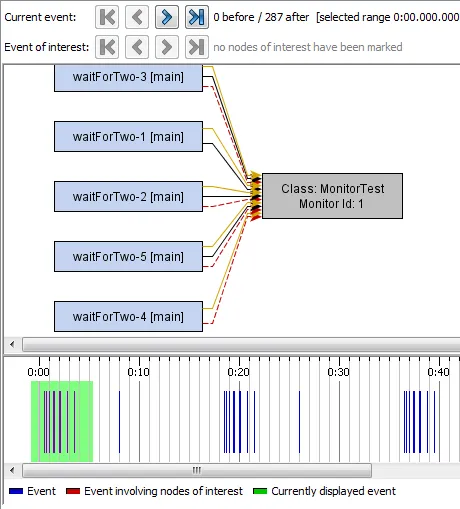
Monitor events can be cumulated by selecting a region in the time line with the mouse. Total blocking and waiting times as well as lists of stack traces are visible in the tool tip windows for the arrows in the locking graph.
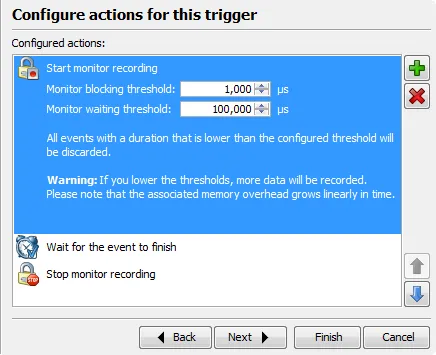
Monitor events are now recorded on demand. Previously, monitor events were always recorded which created unnecessary overhead in some cases. Monitor recording can be started in the locking history graph and the monitor history view. Also, there are new trigger actions to start and stop monitor recordings. Note the configurable thresholds for monitor events.
Monitor event recording can also be started and stopped with the JProfiler MBean or via the Controller API.
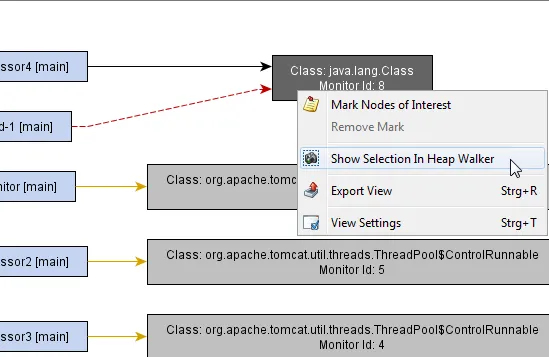
Monitor views are now linked with the heap walker. When analyzing a monitor in the monitor views, it is now possible to show the monitor object in the heap walker, so that you can analyze where it was allocated and how it is referenced. In the locking graphs, you can right-click a monitor node and switch to the heap walker.
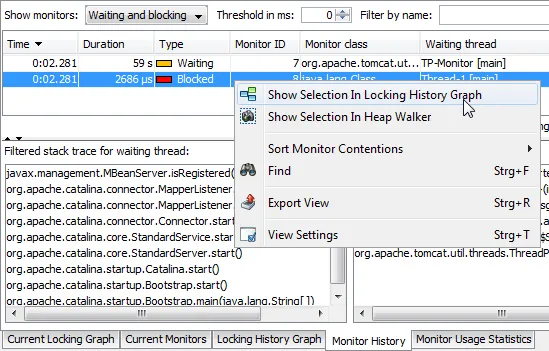
The same thing works in the monitor history view. Also, any monitor event in the monitor history view now offers a link to the locking history graph in the context menu.
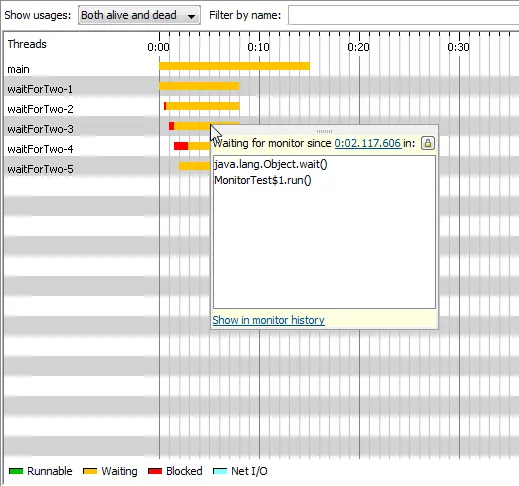
In the thread history view, there are now tool tips with stack traces that also include links into the monitor views. These tooltips are available if monitors have been recorded for the time under the mouse cursor.
A thread dumps view has been added. Thread dumps show all call frames, not only profiled classes. Multiple thread dumps are supported. You can stay on the same thread and cycle through different thread dumps to see changes in the stack trace. Single threads or the entire thread dump can be copied to the clipboard.
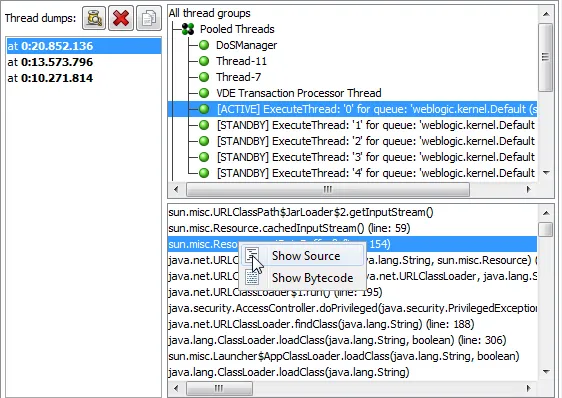
Thread dumps can also be taken with the new "Trigger thread dump" trigger action, the
JProfiler MBean or via the Controller API.
The new method statistics view shows statistical data on the distribution of method execution times. Most interesting is the "outlier coefficient" that shows how strongly the slowest invocation deviates from the median time. In the lower part of the view, a graph shows the distribution of call times. Here, the y-axis has been set to a logarithmic display in order to show single outliers more clearly.
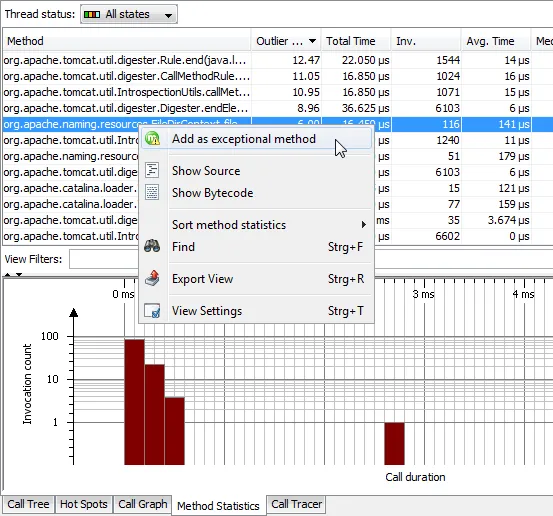
Methods with prominent outliers can be further analyzed with the new "exceptional methods" feature
explained below. You can right-click any method in the table and choose "Add as exceptional method"
from the context menu.
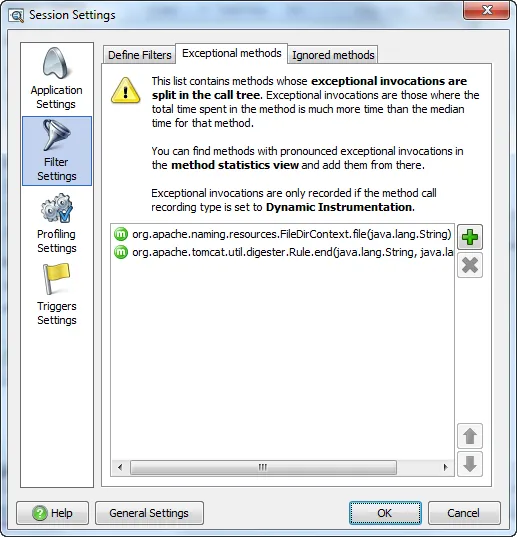
Exceptional method runs are the invocations of a method that take most time. Often, a method performs very similarly over a huge number of invocations, but sometimes it takes much longer. Looking at the call tree does not help in this case, since the regular invocations dominate the single slow invocation. With JProfiler 6, you can mark a method as an exceptional method in the call tree views or the method statistics view and the call tree will show the slowest invocations separately.
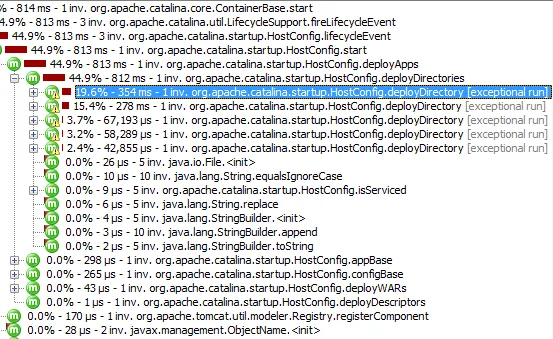
You can review and edit exceptional method configurations in the filter settings.
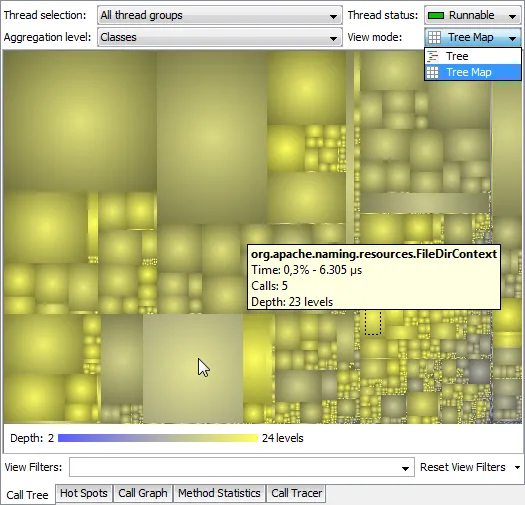
Tree map view modes have been added to all views that show call trees. The areas of the rectangles in the tree map are proportional to inherent time, and there is a cutoff for maximum nesting depth. You can mouse over rectangles to see the method information and zoom in to see a certain region in more detail.
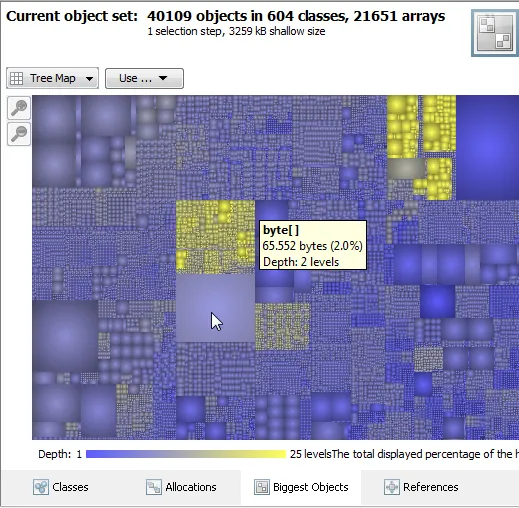
The biggest objects view in the heap walker has also received a tree map view mode. The areas of the rectangles are proportional to the retained size of the objects.
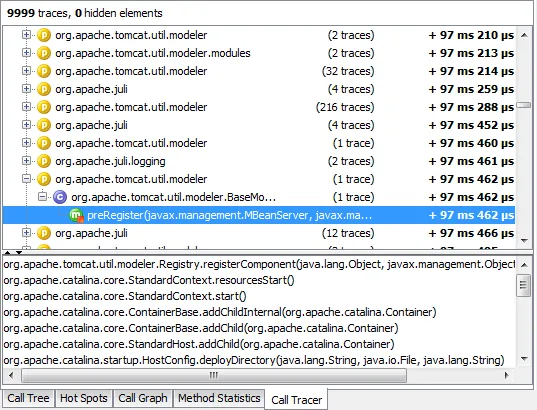
Stack trace information for the call tracer has been added. At each trace in the call tracer, you can see the current stack trace in the lower window. This makes it much easier to assess the context of the selected trace.
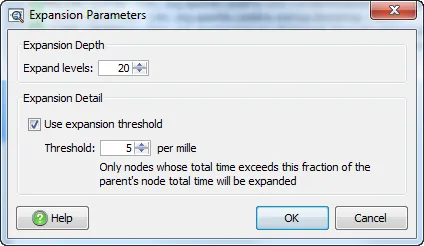
Expanding call trees is now more configurable. Instead of the old "Expand 10 level" action, an "Expand multiple levels" action has been added where the number of levels is now configurable. In addition, a threshold can be defined that prevents insignificant nodes from being expanded.
New profiling settings can now be applied without restarting the JVM if you profile a 1.6+ JVM. This applies to all available options in the profiling settings, the filter settings and the trigger configuration.
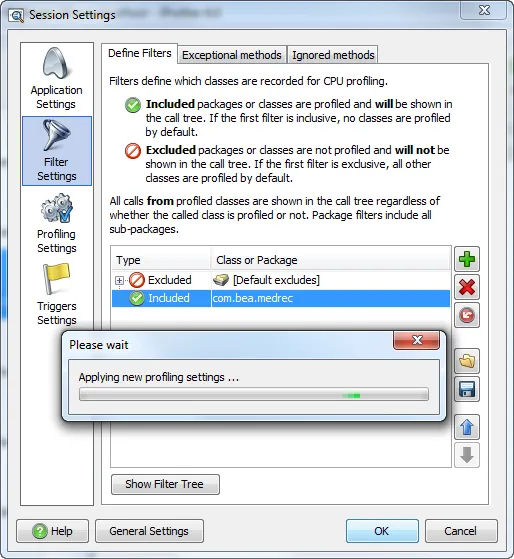
This also means that when profiling a remote application server that should start up immediately without waiting for a connection from the JProfiler GUI, you do not have to transfer a config file to the remote server and specify it on the command line anymore. This simplifies remote profiling considerably.
Manual configuration of profiling has been simplified if you profile a 1.5+ JVM. Instead of the -agentlib VM parameter, a boot class path VM parameter and the modification of the native library path environment variable, you now simply specify a single JVM parameter and no other modifications are required. On Windows, with JProfiler installed in C:\Program Files\jprofiler6, the VM parameter is
-agentpath:C:\Program Files\jprofiler6\bin\windows\jprofilerti.dll=port=8849
Any remote session configured for port 8849 can now connect to the profiled JVM.
Usually, you will use an integration wizard to insert the VM parameter for profiling into your start script, or use an IDE integration to start profiling without any configuration. However, sometimes it is convenient to make changes manually. In that case, it is now much simpler to set up profiling than before.
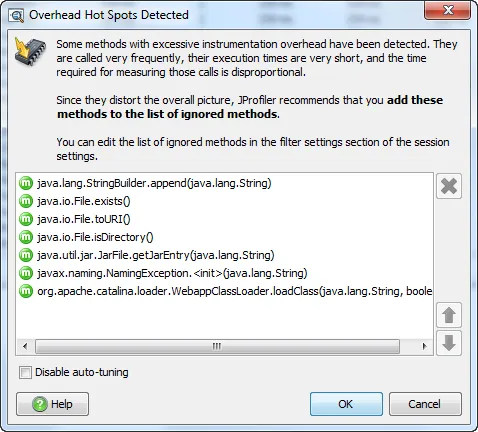
Auto-tuning for dynamic instrumentation determines methods with disproportional overhead and suggests them for exclusion in the JProfiler GUI. Very short-running methods that are called very frequently can distort the overall numbers, because the time required to measure those methods takes much longer than the actual method itself. An example of such a method is the method in an XML parser that reads the next character. During profiling, you are notified of such overhead hot spots in the status bar.
By clicking on that notification or when the session is terminated, a dialog is shown that shows you the overhead hot spots and lets you add them to the list of ignored methods with one click. For your next profiling session, these methods will not distort overall numbers anymore.
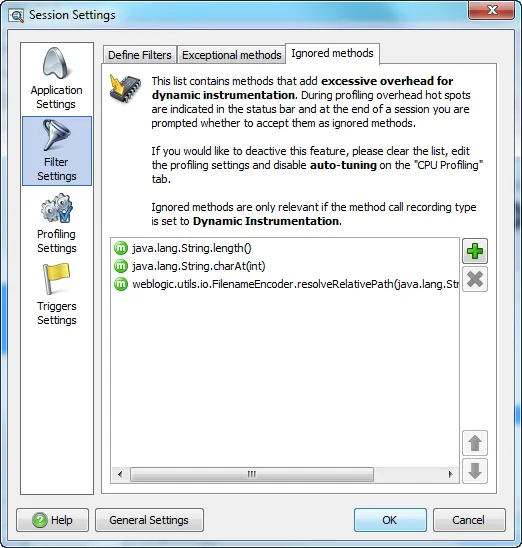
Ignored method configurations can be reviewed and deleted in the filter settings.
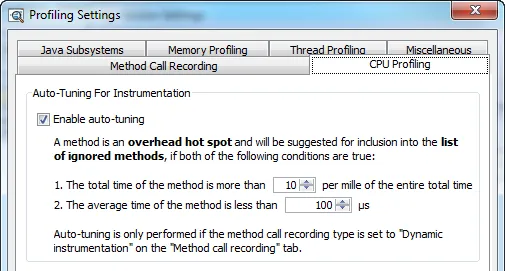
The behavior of auto-tuning is configured with two parameters in the profiling settings. Auto-tuning can also be completely disabled for a session.
JProfiler snapshots can now be opened from IDE integrations. The main advantage is that you get source code navigation in the IDE for a snapshot that way.
Two new platforms have been added. Profiling is now also possible on FreeBSD x86 and Linux PPC for both 32-bit and 64-bit JVMs.