What's New in JProfiler 5.2

Change release:

Please see the change log for a detailed list of changes.

JProfiler 5.2 introduces the following notable new features:

Significant reduction in memory overhead. We have rewritten the back-end for the heap walker with the following visible benefits:
  • When taking a heap snapshot, the overhead on the profiled JVM is now as small as possible. The remaining memory overhead is mainly due to the profiling interface of the JVM. This allows you to take heap snapshots for very large heaps.
  • It is now possible to open large snapshots regardless of the amount of physical memory that you have on the machine where the JProfiler GUI is running. If not enough memory is available to keep object indexes in memory, a disk-based fallback will be used.
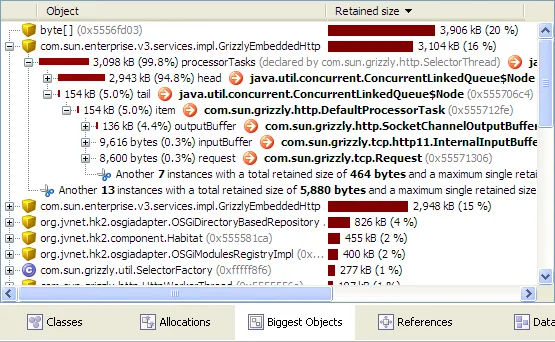
  • We can now implement features in the heap walker that require a more advanced analysis of the heap. The biggest objects view below is the first such result.

CPU data is now stored and loaded in a more memory-efficient way. The notable improvements are:

  • When profiling, CPU data of dead threads are periodically saved to disk in order to minimize the memory overhead on the profiled JVM. For long-running applications that constantly create new threads this makes a big difference.
  • When loading snapshots, not all CPU data is loaded into memory, but only the parts that are required for displaying data are selectively loaded from the snapshot. This applies to snapshots that have been saved with JProfiler 5.2+.

The biggest objects view shows the objects that retain most memory. This is useful for analyzing excessive memory consumption as well as for finding memory leaks. You can open each biggest object to show the tree of retained objects. This tree is a so-called "dominator-tree", where each object node contains the objects that are directly retained by it. In many cases, these are direct outgoing references. All objects that retain more than 0.5% of the retained size of the parent object are displayed in the tree.

Triggers were enhanced in several areas. The visual changes include:

JVM startup and JVM exit triggers were added. With those new event types you can execute actions when the JVM is started and when it is shut down:
Triggers can now be enabled and disabled from the JProfiler GUI and the controller API:
Triggers can now be organized into groups by assigning them a group ID in the trigger wizard:
Triggers in trigger groups can be enabled or disabled together:
The call tracer can now be controlled with a trigger action and from the API:

Bookmarks received the following new features:

You can now inspect all bookmarks in the current session in a separate dialog (Profiling->Edit Bookmarks). Bookmarks can also be exported to HTML or CSV from this dialog:
Bookmark properties can be edited, including the color and the line style of a bookmark:
The "Add a bookmark" trigger action can now set the color and the line style of the bookmark:
In the "Time" view of the heap walker you can now precisely select all objects allocated between two bookmarks:
The new console integration wizard allows you to use all integration wizards in JProfiler even if no GUI is available, for example on a remote machine. In addition, the console integration wizard exports a session config file that can be imported in a JProfiler GUI installation to connect to the profiled JVM without any further configuration.
Export and import of session settings. In this way, you can easily move sessions and their profiling settings to different JProfiler installations or share them with your colleagues.
View filters for snapshot comparisons with tabular or tree data have been added. Just like with the view filters for the dynamic views, you can now focus on specific packages, rather than having to look at all classes in the JVM.
Objects in heap snapshots and HPROF snapshots can now be compared. Previously the memory comparisons only offered to compare "All objects" or "Recorded objects". Comparing objects from the heap walker is useful if you want to make sure that you only compare strongly referenced objects.
Nodes can be hidden in call tree and hot spot views. In call trees, all nodes of the same name will be hidden. Times and percentages will be adjusted as if the hidden nodes did not exist at all. Hiding nodes on one view does not influence other views.
You can show hidden nodes again with the "Show hidden" tool bar button that appears after you hide a node.
Views with live differencing now show differences also as percentages. In the view settings you can choose whether the numerical difference or the percentage should be used for sorting the difference column.
All integration wizards now support offline profiling. Offline profiling means profiling without the JProfiler GUI, data is recorded and saved with the help of triggers or the profiling API.
The dynamic allocation views can now be auto-updated periodically. Previously, you had to click the "Calculate" button to refresh the allocation data.
HP-UX on Itanium is now supported for profiling. This complements the existing support for HP-UX on PA-RISC. Both 32-bit as well as 64-bit JVM are supported.
Support for the latest IDEs and application servers. JProfiler now has plugins for IDEA 8.x, Netbeans 6.5, and JDeveloper 11g. Application server integration wizards have been added for Websphere 7, Glassfish v3, Coldfusion 8, Jetty 6.