What's new in JProfiler 5.1
Change release:
Please see the change log for a detailed list of changes.
JProfiler 5.1 introduces the following notable new features:
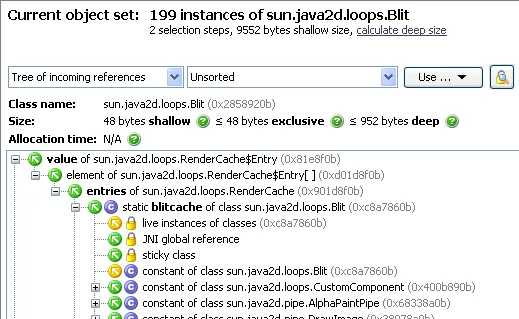
Tree views of incoming and outgoing references
in the heap walker reference view. These new views modes
complement the existing reference graph and are ideally suited for analyzing long chains of references. The tree of incoming
references has the same selection options and path to GC root functionality as the reference graph.
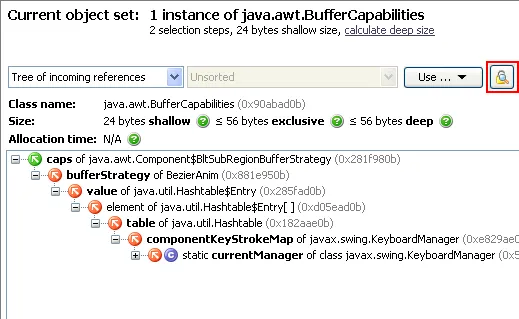
When searching for paths to GC root, the resulting chain is initially displayed without any other incoming references.
You can also search for path to GC roots from any object in the tree by using the context menu.
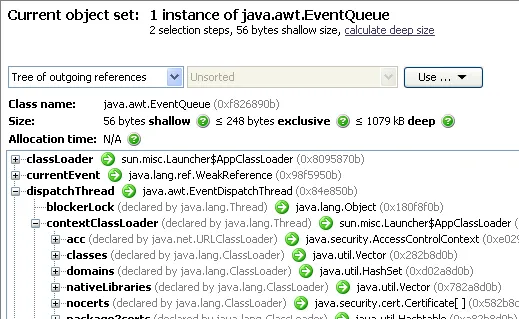
The tree of outgoing references shows a sorted list of fields for each object. Following known chains of references is
much easier than in the reference graph.
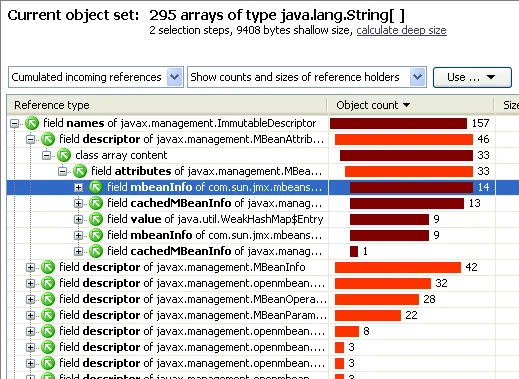
The cumulated reference views of the heap walker are now a tree table. Previously, you had to create new object
sets to follow chains of cumulated incoming or outgoing references for the current object set. Now, you can follow
multiple reference steps in the same view.
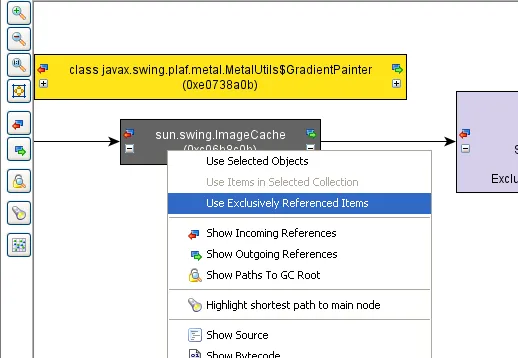
You can now select all retained objects in the reference view of the heap walker. Those are
the objects that would be garbage collected if a particular object were removed from the heap. The action is available
in the reference graph as well as in the new reference tree views.
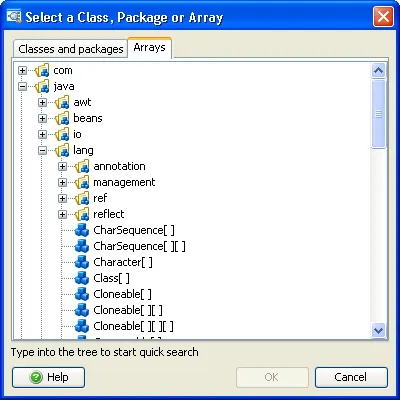
Types of object arrays are now resolved when profiling with Java 5+ and the new profiling interface JVMTI.
This change affects all memory views and the heap walker. Previously, all object arrays were grouped together.
For example, java.lang.String[] and java.lang.Object[] arrays are now separate entries.
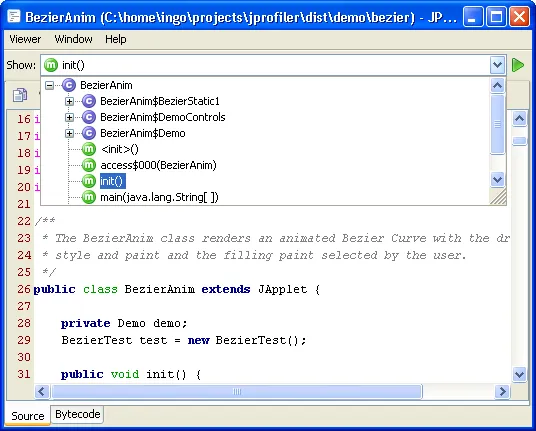
The internal source viewer has been redesigned. It features syntax coloring, a file structure display
of the current file with all inner classes and their methods as well as search functionality.
For IDE users, the internal source viewer will not be shown, but the IDE will be used instead to display source files.
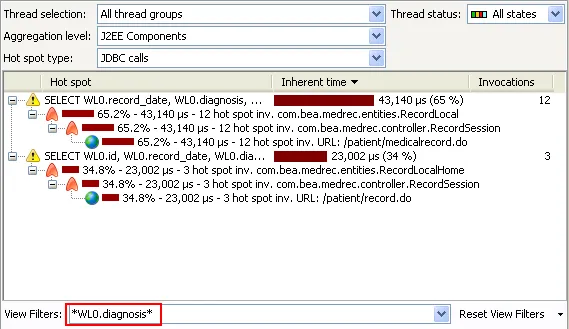
The CPU hot spot view has been improved when working with non-method hot spots. The node details dialog is non-modal,
expansion popups allow you to quickly see long hot spot values, and the view filters now work for non-method
hot spots, such as JDBC calls.
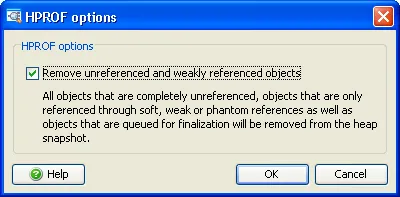
It is now possible to remove unreferenced objects from HPROF snapshots. This greatly simplifies the search for memory
leaks when working with HPROF snapshots.
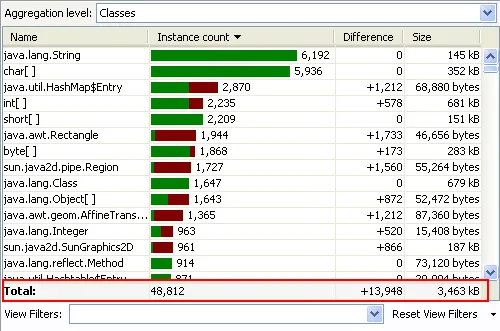
A fixed summary row at the bottom of the All Objects and Recorded Objects views has been added. This makes it easy to
track total changes when using the "Mark current values an show differences" action in those views. Together with view filters,
you can now quickly calculate sums for particular combinations of classes or packages.
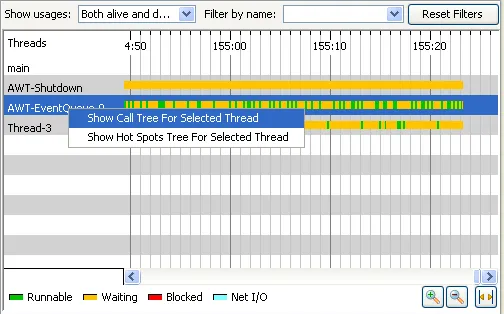
In the thread history view, you can now jump to the CPU view with actions in the context menu. This is
useful if you identify a problematic thread in the thread history view and wish to analyze it further in the
CPU views.
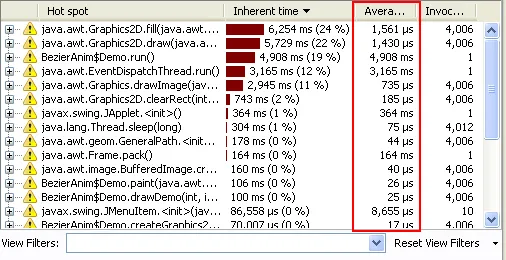
The average time is now a separate column in the CPU hot spots view. You can now sort by this column.
In back traces, average times are optionally annotated in brackets.
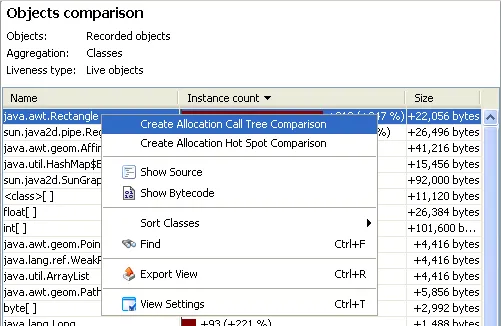
In object comparisons of snapshots, you can now
quickly create allocation call tree and allocation hot spot comparisons
by selecting a class and choosing the desired comparison in the context menu. In this way you do not have to locate
the desired class in the comparison wizard again.
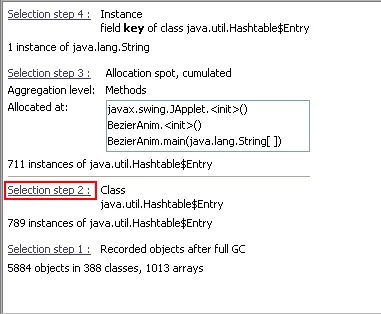
In the selection description of the heap walker, selection step labels are now hyperlinks that
take you to the first occurrence of the corresponding object set. Instead of having to use the back button
many times, which also tracks view changes, you can now directly jump back to an earlier point of
your analysis.