What's new in JProfiler 5.0
Change release:
Please see the change log for a detailed list of changes.
JProfiler 5.0 introduces the following notable new features:
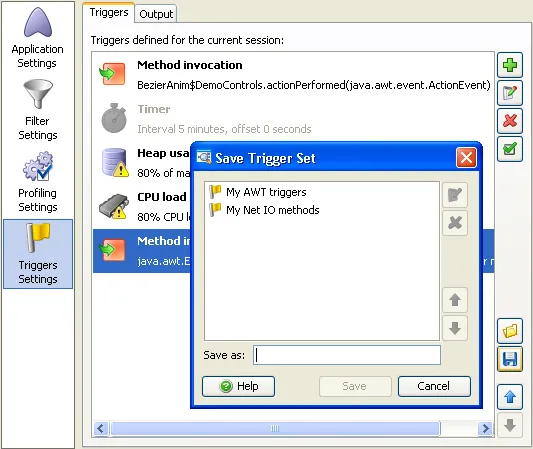
A powerful facility of trigger and actions has been added. With triggers, you can automatically react to certain events in
the JVM and perform a number of profiling-related actions. Triggers and actions are defined in the session settings and can be used for
profiling with the JProfiler GUI as well as for offline profiling.
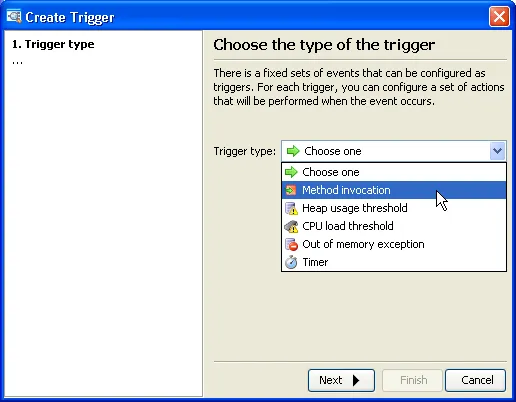
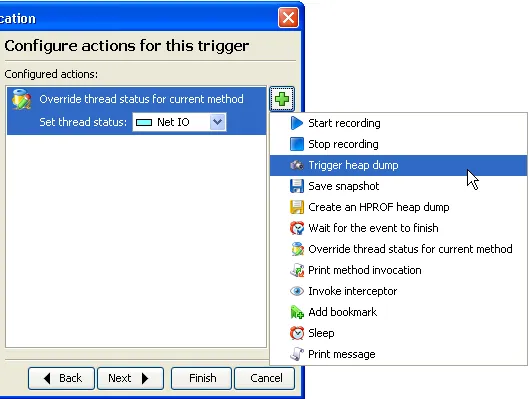
The list of available actions depends on the trigger type. Most actions are configurable and dispatch commands to the profiling agent.
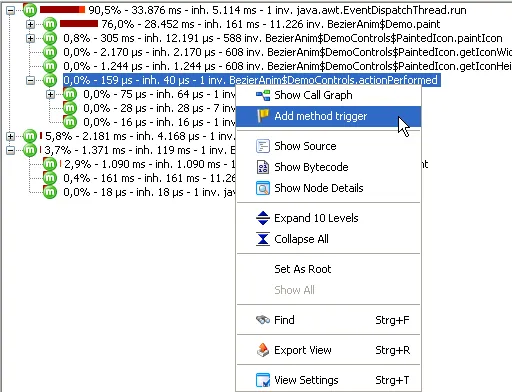
Selecting methods for method triggers is most easily done in the call tree and hot spots views where you can create a new method trigger
or modify an existing method trigger based on the currently selected node.
Trigger configurations can be saved as trigger sets, so they are easily reusable for other sessions.
JProfiler can now read HPROF memory snapshots. With recent patch levels of Sun Java 1.4 and Java 5 JREs, you can save HPROF memory
snapshots with the -XX:+HeapDumpOnOutOfMemoryError VM parameter when an OutOfMemoryError occurs. In this way, you can
analyze memory leaks from JVMs that were not profiled with JProfiler. Starting with Java 5, HPROF memory snapshots can also be saved from
JConsole. In Java 6, you can locally attach with JConsole to every Java process without command line modifications, so there is always a way
to analyze memory consumption when a Java application behaves badly.
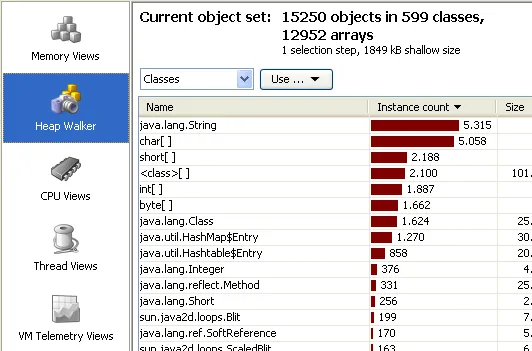
When viewing an HPROF memory snapshot, only certain parts of the heap walker are available, other sections are grayed out.
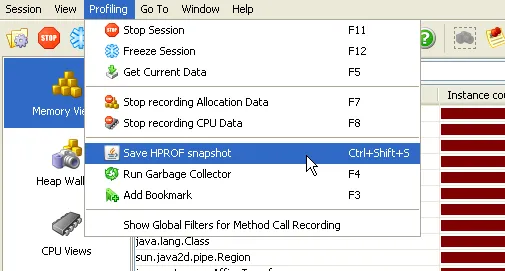
When profiling with Java 6, you can also save an HPROF memory snapshot from the JProfiler GUI. This is of interest if there is very
little physical
memory left. The new trigger system also provides an action to save an HPROF snapshot.
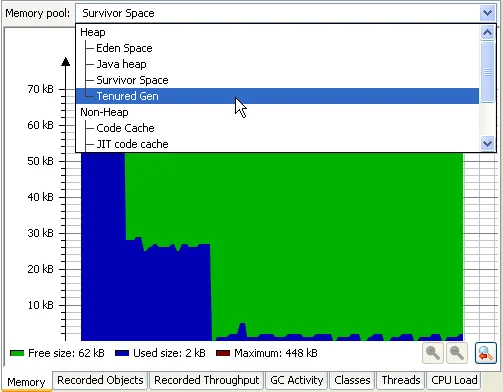
The VM telemetries have been overhauled. There is additional data that has become available in Java 5 and Java 6 that is now displayed by
JProfiler. The Memory VM telemetry now displays a list of memory pool in a drop-down list at the top, maximum pool sizes are displayed
where available:
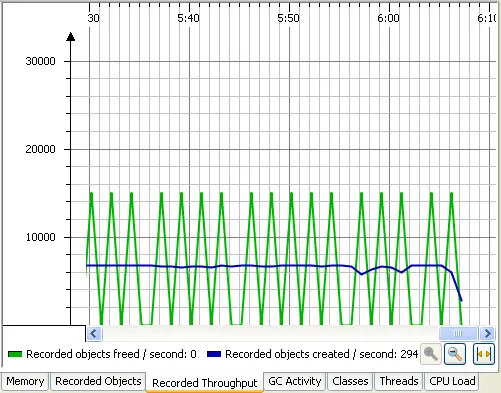
The Recorded Throughput VM telemetry now displays how many recorded objects are created and garbage collected per second:
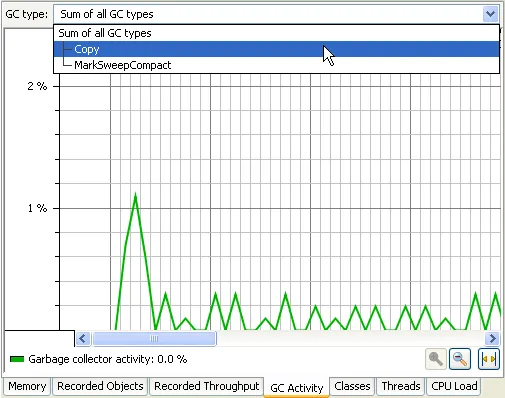
The GC Activity VM telemetry displays how much time was spent in the garbage collector. The various GC types as exposed by the JVM can be
viewed
separately:
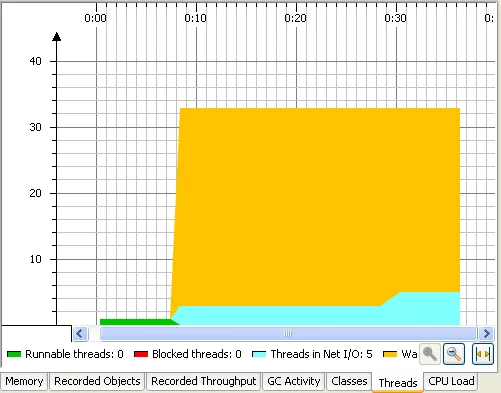
The Threads VM telemetry now resolves all thread states separately:
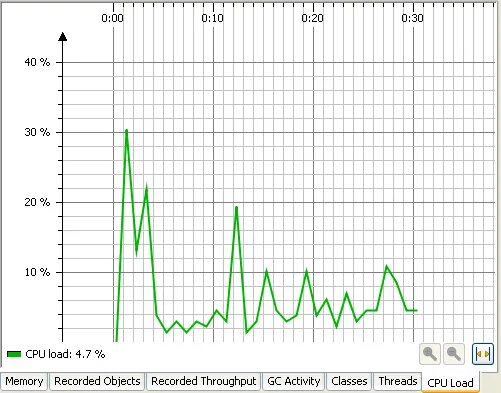
The CPU Load VM telemetry displays the percentage of the total CPU time that is consumed by the profiled application. There is also a
trigger event type
that is fired when a CPU load threshold is reached.
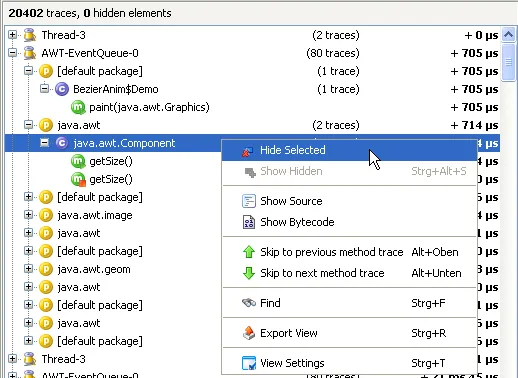
A call tracer view has been added. The call tracer shows you the chronological sequence of all recorded method calls. The call traces
are grouped by thread, package and class so that you can easily find specific areas of interest. It is possible to hide threads, packages,
classes or single methods in order to trim the amount of information to something that can be analyzed more easily. This view is useful for analyzing
use cases where multiple threads are involved or analyze the control flow in detail from a perspective that cannot be achieved with a debugger.
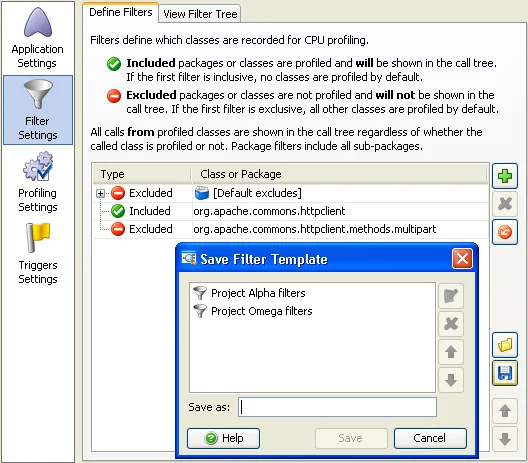
The session settings have been redesigned. All session settings are now accessible in a single dialog. The method call collection filters
have been rewritten. You can now specify a list of inclusive and exclusive filters. New sessions receive a list of default excludes that
excludes common frameworks or libraries. Filters can be grouped and saved as templates for easy reuse in other sessions.
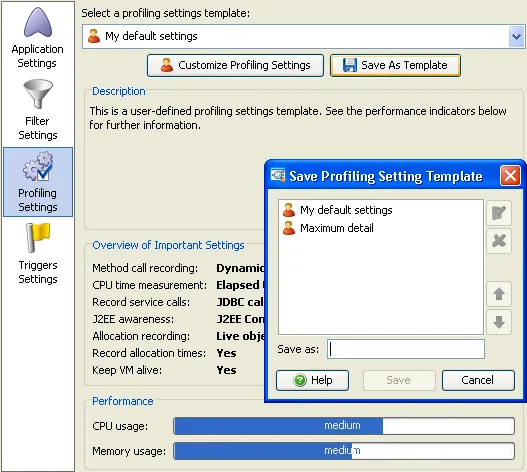
Profiling settings templates are now adjustable outside the session startup dialog and present an overview of important settings, Custom
profiling settings templates can now be saved.
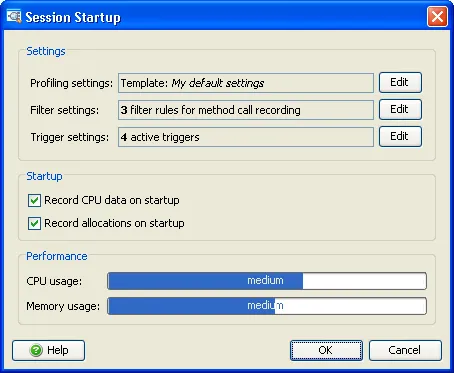
The session startup dialog now offers quick summaries and edit links for profiling settings, filter settings and trigger settings. This is
the dialog that is most important for IDE integration users.
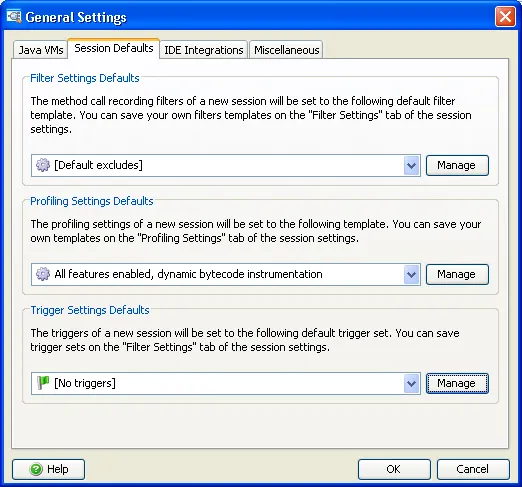
You can now define defaults for new sessions. A default filter template, a default profiling settings template and a default trigger set
are applied to every newly created session.
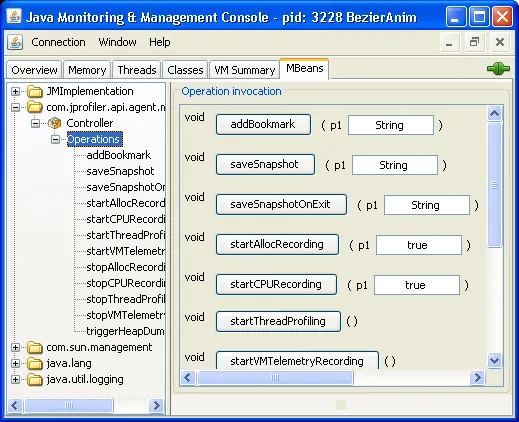
The new JProfiler MBean is registered for Java 5+ JVMs, so you can use JConsole or other technologies that support MBeans to control the
profiling agent manually. This is especially useful for offline profiling. Previously you had to use the API and write your own user interface
to expose the controller to the user.
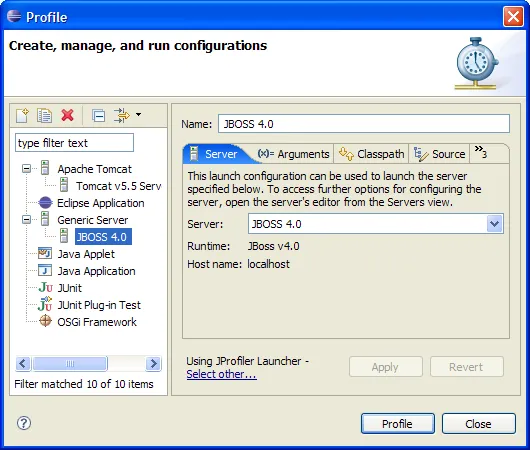
The JProfiler eclipse integration now supports eclipse WTP. This means that application servers can be profiled from within eclipse
without any further configuration. Previously you had to modify VM parameters manually or use JProfiler standalone.